$XRP: Bouncing from Support, Breakout in Sight?BINANCE:XRPUSDT CRYPTOCAP:XRP : Bouncing from Support, Breakout in Sight? 📊🚀
XRP's current 1H trend is bullish, solidly holding the main support at ~2.33 after a quick rebound—strong buyer interest here!
Expect a potential breakout above 2.61 resistance if volume spikes, targeting 2.80 next.
Low risk of deeper dip unless support cracks (possible test at 2.20).
Tracking RSI (hovering neutral ~55), 50 EMA crossover, and MACD histogram turning positive.
Stay bullish, but set stops! 💎📈
#XRP #CryptoTrading #Altseason
Trade ideas

XRPUSDT.P - November 15, 2025XRPUSDT is trading around $2.28 on the 15-minute chart, still moving within a short-term downtrend under a descending trendline. Price is currently reacting inside a $2.25–$2.29 support zone, showing early signs of compression near trendline resistance. Immediate horizontal resistance sits at $2.31–$2.34, which must be reclaimed for bullish momentum to develop. A clean breakout and retest above this zone could open a move toward the $2.49 resistance level.
Failure to break the trendline and rejection from the $2.31–$2.34 support may trigger another leg down, with downside targets at $2.21–$2.24 and possibly the deeper support around $2.14–$2.16. Overall short-term outlook remains bearish to neutral, pending a confirmed breakout above near-term resistance.

XRP Downward Move Incoming? Market Manipulation at Play?I’m watching XRP closely on the 1H chart, and something feels off. This recent push up looks like a liquidity grab — classic manipulation to trap late long entries before a potential reversal.
The structure still shows lower highs forming, and we haven’t reclaimed key resistance levels convincingly. I believe we could see a move down from current levels, possibly retesting the demand zone below before any sustainable bounce.
Let’s see how it plays out — stay patient, stay sharp, and don’t get caught in the trap.
📉💡

XRPUSDT.P - November 7, 2025XRPUSDT.P is showing early signs of a short-term bullish reversal after rebounding from the ascending trendline support near the $2.16–$2.18 zone. A buy limit is positioned around $2.219, aiming for a move toward the $2.283 partial profit zone and the $2.336 profit level.
A confirmed breakout above $2.283 would validate bullish continuation, while a drop below $2.158 would invalidate this setup and signal renewed downside pressure.
Risk Assessment: Moderate — structure leans bullish, but sustained strength above the partial profit level is needed for confirmation.

XRP Capital Sector. Price Slice TF 3M 4.9671🏷 XRP Capital Sector. Price Slice TF 3M 4.9671
🏷 4.9671 — At the time of publication, the price had not yet been reached. ( на момент публикации цена не достигнута )
🏷 3.6297 — Level confirmed. ( уровень подтвержден )

XRP / USDT (4H Timeframe)Pattern: Hammer Reversal + Demand Zone Accumulation Setup
The chart shows XRP reacting strongly inside a key demand zone, where the past 2–3 candles are showing clear buying pressure.
Maybe Price is collecting buying orders in this zone, forming a hammer candlestick that signals a potential reversal.
Key Observations
🔹 Accumulation in Demand Zone: Last 2–3 candles show buyers absorbing sell pressure and quietly building long positions.
🔹 Hammer Candlestick: Long lower wick indicates aggressive buying after a liquidity sweep into demand.
🔹 Demand Zone: $2.2415–$2.2830 — strong reaction area where buyers previously stepped in.
🔹 Order Collection: Price behavior suggests smart money collecting buy orders before attempting a move upward.
🔹 Market Structure: Short-term downtrend but showing early bullish reaction signs.
🔹 Supply Zone: $2.9797–$3.0546 — major resistance where strong sell orders remain.
Potential Move
If XRP continues holding above the $2.24–$2.28 demand zone, potential upside targets:
🎯 Target 1: $2.5200
🎯 Target 2: $2.7200
A 4H candle close below $2.24 would weaken and likely invalidate the bullish scenario.
Summary:
XRP is showing early signs of accumulation inside its demand zone, with the past few candles reflecting steady buying pressure. The hammer formation suggests a possible reversal, but the outcome depends on whether buyers continue defending the zone. Holding above demand keeps targets of $2.52 and $2.72 in play.

Nasdaq Approves Spot $XRP ETFThe first spot CRYPTOCAP:XRP ETF (ticker:XRPC) is scheduled to go live today, signaling another step forward for the broader crypto-ETF market.
This marks a major legitimacy boost for XRP—something the asset hasn’t seen in years. Whether it becomes a true catalyst now depends on one thing: sustained inflows.
TECHNICAL VIEW:
CRYPTOCAP:BTC continues to dictate broader market direction, while XRP remains stuck in a multi-month range. The structure still leans bearish, with a clear sequence of lower highs showing that momentum has yet to return.
CRYPTOCAP:XRP is currently ranging between $2.06 and $2.70, with the upper boundary holding as firm resistance. Price made an attempt to break through the liquidity curve, but if price just stall here without a decisive break above $2.60, then we do have a risk of breaking down into $1.80-$1.70 zone.

$XRP Channel Crunch – Hold the Line or XRP Dip to Fill?BINANCE:XRPUSDT CRYPTOCAP:XRP Channel Crunch – Hold the Line or XRP Dip to Fill?
Altcoin Pioneers! 🐋 XRP/USDT 1H is coiling tight in this blue descending channel, price scraping support at ~2,430 after a swift pullback from resistance 2,550. Ripple's regulatory shadow looms, but that blue box consolidation hints at pent-up energy – buyers defending the floor with conviction.
Hold support? Strong potential; low wick on the test candle + rising volume could ignite a squeeze. Breakout above resistance? On deck if >2,560 clears, eyeing 2,650 ATH retest. Deeper dip risk? Watch out – breach targets 2,350 (channel low), SEC drama fuel.
Target: Upside pop to 2,520 if holds, downside probe 2,380 on fail. Tracking: Ichimoku cloud for trend flip, ADX for strength surge, and XRP/BTC pair for BTC drag. XRP army, charge! ⚡📊
#XRP #RippleAnalysis #CryptoCharts

$XRP Resistance Test – Breakout Incoming?BINANCE:XRPUSDT Resistance Test – Breakout Incoming?
XRP's 1H chart building bullish momentum, probing resistance at 2.583 after solid bounce from support ~2.50—break above targets 2.65, but watch for rejection dip to 2.45 if volume dips.
Strong uptrend holds.
Key indicators: RSI at 65 (bullish), 50MA support intact, MACD histogram expanding. 🚀💥
#XRP #Ripple #AltcoinPioneers

XRPUSDT 30min Longs 🔵 Market Structure
Break of Structure (BOS): Above 2.4283 confirmed
Liquidity Sweep: Below 2.4019 before push upward
🟡 ICT Concepts
⚡ Trade Setup
Long Entry: 2.4150-2.4200 (current pullback)
Stop Loss: Below 2.3980 (FVG break)
Targets :
TP1: 2.4500-2.4750
TP1:2.5200-2.5700
Bullish structure intact - buying dips for liquidity grab above
#XRP #SMC #ICT #TradingView #Bullish


XRPXRP might show giant move after we touch support inside the channel. We can look at Long and gently accumulate your positions. NFA - DYOR.

XRPUSDT UPDATE#XRP
UPDATE
XRP Technical Setup
Pattern: Falling Wedge Pattern
Current Price: $2.49
Target Price: $3.80
Target % Gain: 52.61%
Technical Analysis: XRP is forming a falling wedge pattern on the 1D chart, suggesting bullish momentum is building. The price is approaching the upper resistance trendline and is expected to break out soon. A successful breakout, supported by volume expansion, could push XRP toward the $3.80 zone, aligning with previous structural highs.
Time Frame: 1D
Risk Management Tip: Always use proper risk management.
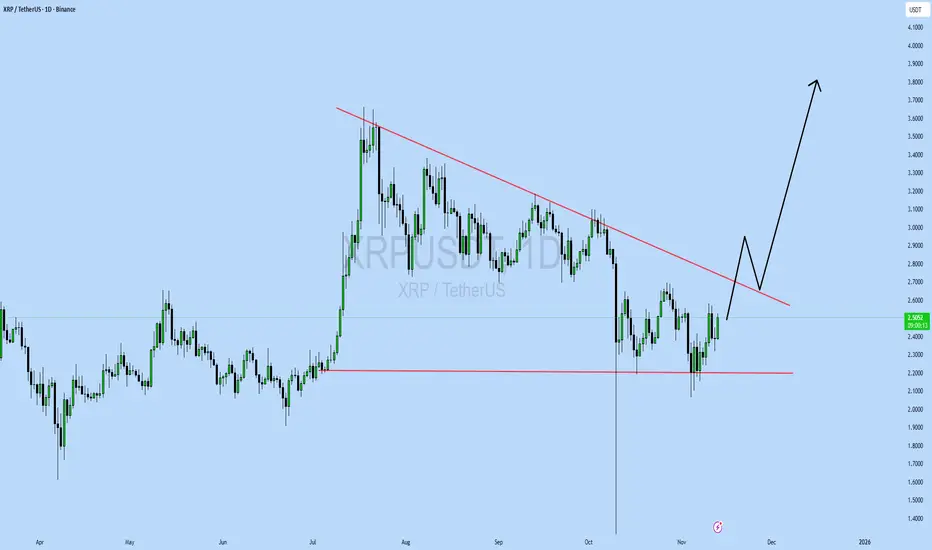
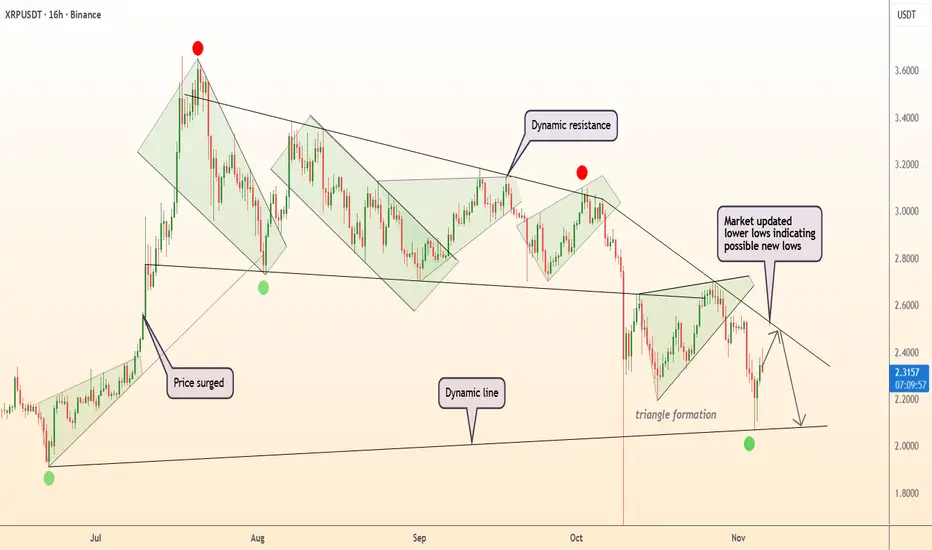
DeGRAM | XRPUSD keeps a descending structure📊 Technical Analysis
● XRP/USD remains below the dynamic resistance line, forming a series of lower highs and lower lows that reinforce the bearish structure. The recent rejection from $2.60 and continuation within the descending pattern point to possible retests of lower supports.
● A breakdown below the $2.20–$2.00 zone could accelerate selling pressure, confirming a move toward new lows within the broader downtrend channel.
💡 Fundamental Analysis
● Recent market uncertainty and reduced risk appetite among crypto investors continue to weigh on altcoins, with XRP showing weaker recovery compared to peers.
✨ Summary
● Key resistance: $2.60. Support: $2.00. A sustained move below $2.20 could extend the decline toward $1.90.
-------------------
Share your opinion in the comments and support the idea with a like. Thanks for your support!
xrp elliot wave probability (update)The current large dip is giving us more clarity.
My primary scenario is still the same:
We finished a wave I and are finishing a wave II now on the weekly timeframe.
The wave C of wave II has to move in 5 waves to the downside. After the crash of october 10th it has only been 3 waves and ending with such a wick never satisfies me as price needs to form a range at the bottom before moving back to the upside.
So we still expect another wave 5 to the downside that could be happening right now. The thing is that the wave 3 was a huge manipulation wick because of the tariff drama which makes it very unlikely and not even preferable for a wave 5 to take out that low as it would be larger than the wave 3. This is why consideration is that wave 5 is a truncation where it can't take out the low of wave 3.
Other bullish scenario?
I would count the the wave I as wave I, II and III and we are now in an expanded flat in a wave IV. The reason why this is not the primary scenario is because of the crash of october 10th that took out the 0.618 fib of wave 3. But this is on the XRPUSDT chart. If we take the XRPUSD chart of coinbase, the bottom was at 1.78 and we never hit the 0.618 fib. In that case this elliot wave count is still valid and in this case the wave 5 to the downside HAS to take out the wave 3 BUT the 0.618 fib sits at 1.58. The wave needs to stay above that to not invalidate a wave IV. in any case, both scenarios whether its a wave II or a wave IV still target the 5$ region at least.
Bearish scenario?
I can also count 5 waves on the weekly timeframe and with that the cycle has ended and we have started an ABC to the downside with price levels targeting as low as 0.70$. The reason why this has the least probability right now is because the wave V in this scenario doesnt have 5 waves (april low till july all time high). I can only see 3 waves to the upside which means it was only corrective (like an expanded B wave for example)
A lot of reading but being prepared for everything is key to win this game!
Share your opinion! Peace!

XRP elliot wave analysis: ending the wave IISee my first post for the xrp elliot wave count on the weekly timeframe
We finished a wave I last year towards 3.40
Then we started a wave II and topped it at 3.65 as an expanded ABC flat.
The wave C (in 5 waves as of elliot wave count) should now be in its last leg to the downside and this can be the most brutal.
I do not recognize this wick of wave 3 so deep because of huge manipulation that day so I stick to the low of coinbase which was at 1.78$
Interesting: I put this parallel channel a while ago and even though we have seen crazy dips, it closes above or at the edge of the channel. Preferably we get out of this channel and make some closing candles below it in a 5th wave to the downside.
After that we can look for a strong push in a wave III towards the 5$ region.
This is my most probable scenario as of now but things can change quickly as we get more information. I'll keep everything updated
Other scenarios?
see my posts.
Share your opinion! Peace!

XRPUSDT.P - November 6, 2025XRPUSDT.P is showing a short-term bullish recovery, holding above the ascending trendline after rebounding from the $2.2266–$2.0655 support zone. Price is currently testing near $2.2745, with upside potential toward the $2.3126 partial profit level and $2.3640 profit target.
A clean break above $2.3126 would confirm continuation toward higher resistance, while a drop below $2.2266 would invalidate the setup and suggest renewed bearish pressure.
Risk Assessment: Moderate — momentum is improving with trendline support intact, but confirmation above $2.3126 is needed to sustain the bullish move.

XRP - Key zones for a tradeXRP - Key zones for a trade
Price of XRP is in a range and key places for a trade area
LONG
- $2.32
- $2.19
Short $2.67

XRPUSDT.P - November 4, 2025XRPUSDT.P is maintaining a mixed-to-bearish market structure on the 15-minute timeframe, with price currently trading around the $2.3069 region after a corrective bounce. The pair continues to respect a sequence of lower highs and lower lows, suggesting that bearish momentum remains intact.
A potential short-term rally toward the $2.3347 resistance zone could occur before sellers reassert control. A rejection from this level may trigger a downside continuation toward the $2.1995 support target, aligning with the broader bearish projection shown.
However, a sustained breakout above the $2.3347 resistance and the invalidation level near $2.37 would negate this bearish scenario and signal a possible short-term bullish reversal.

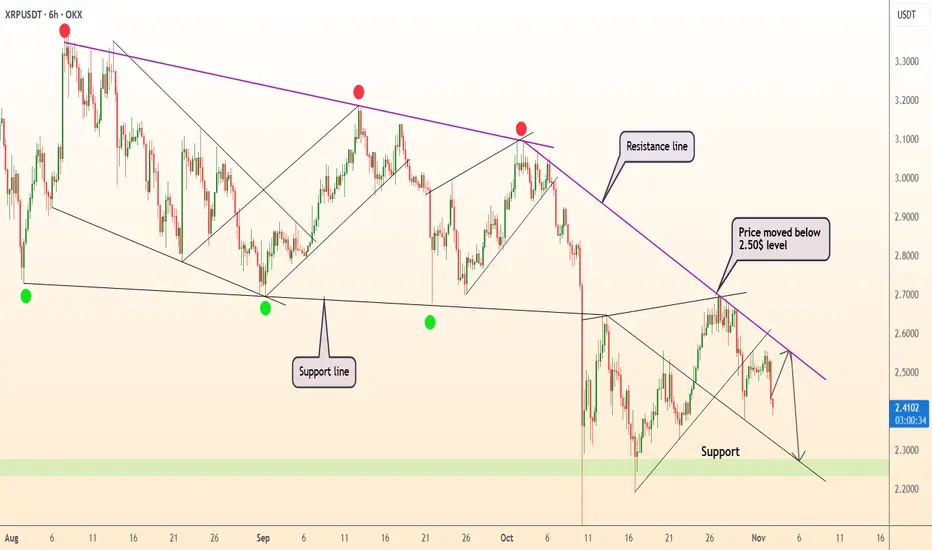
DeGRAM | XRPUSD moved below the $2.5 level📊 Technical Analysis
● XRP/USD continues to move within a descending structure, consistently rejecting from the resistance line near $2.50. The price broke below this level, confirming renewed selling momentum.
● With repeated failures to hold higher lows, the pair targets the next support zone around $2.30–$2.25, aligning with the broader bearish channel formation.
💡 Fundamental Analysis
● Ripple’s price remains under pressure as market liquidity tightens and investor appetite for altcoins declines amid rising U.S. yields.
✨ Summary
● Short bias below $2.50; targets $2.30–$2.25. Technical rejection and weaker sentiment reinforce bearish continuation.
-------------------
Share your opinion in the comments and support the idea with a like. Thanks for your support!
XRPAfter a strong surge at the beginning of 2025, XRP has entered a consolidation phase (sideways trend between 2.3 – 3.0 USDT). Momentum is weakening, as the last three weekly candles show lower highs. If the 2.33 USDT level holds, a rebound toward 2.74 – 3.00 could follow. However, if it falls below 2.30, it could open the way down to 1.80 or even 1.50 USDT.

[SeoVereign] RIPPLE BEARISH Outlook – November 03, 2025I would like to share my Ripple idea as of November 3.
This idea is an extension of the one from October 27. The short positions entered on the 27th will be closed in profit in connection with this idea, and I plan to add some additional positions at the same time.
Basis — 1:1 FIBONACCI & Breakdown at 2.38 USDT
Currently, Ripple has completed a 1:1 Fibonacci ratio relative to the previous upward wave
and is attempting to break below the 2.38 USDT support level.
Accordingly, this area indicates a high possibility of transitioning into a new downward trend.
I set the average target price around 1.2 USDT.
Further position management and updates will be provided depending on market developments.
Thank you for reading.

Are you ready ?XRP’s movement is consolidating around the 2.7–2.8 range and is expected to maintain this wave pattern until a breakout above the Fibonacci 0.61–0.65 level.
