XRP Approaching Key Supply Zone: Break or Reject?Hi!
Bullish Scenario
A bullish continuation becomes likely only if price breaks and closes above the $2.12–$2.18 S&D zone.
If that happens:
Buyers regain control
A retest could confirm support
Next target -> descending trendline at $2.35–$2.45
Conclusion:
Break S&D -> Long toward the descending trendline.
Bearish Scenario
If price rejects from the S&D zone and fails to reclaim $2.12–$2.18:
Momentum shifts back to the downside
Price may retest the $1.90–$1.92 zone, the most recent low
Further breakdown could lead to new cycle weakness
Trade ideas

XRP Breaks Out: Is a Major Bullish Wave Starting?XRP Breaks Out: Is a Major Bullish Wave Starting?
XRP just broke out of a Descending Wedge Channel pattern which indicates increasing bullish momentum.
Based on the pattern alone, the price should continue to rise after this move and could possibly make an aggressive move up to 3.00.
The current problem is that BTC is still very weak and without any clear signs of a reversal. If BTC starts to change to bullish and if XRP respects this pattern, then a bullish wave could start from this area. Main Targets: 2.27 2.5 3.0
You may find more details in the chart!
Thank you and Good Luck!
❤️PS: Please support with a like or comment if you find this analysis useful for your trading day❤️

XRPUSDT is near channel support zone As observed on the chart, XRP has initiated a corrective phase within a defined descending channel, experiencing significant downward momentum. The price is now testing the channel's lower support boundary for a potential reversal. A strong reaction at this level, followed by a bullish reversal candle with supporting volume, could signal the start of an upward move toward the channel's upper resistance.
A decisive breakout above the channel, especially with increasing volume, would indicate a shift in market structure and likely activate further bullish momentum. In such a scenario, initial technical projections suggest a measured move toward the $4.00 level, which aligns with the pattern's implied volatility and previous key resistance zones.
DISCLAIMER: ((trade based on your own decision))
<<press like👍 if you enjoy💚

Lingrid | XRPUSDT Short from Resistance Confluence ZoneBINANCE:XRPUSDT perfectly played out my previous trading idea . Price bounced sharply from the lower low, but price is now approaching a heavy confluence zone around 2.4340, where the upward trendline, the channel border, and the resistance block all meet. This is the same area that previously produced two lower highs, making it a structurally significant turning point. Unless buyers break through this cluster with strong momentum, the rally is likely to fade.
From a market perspective, CRYPTOCAP:XRP remains fundamentally sensitive to risk sentiment and regulatory headlines, while broader crypto flows remain mixed. If sellers defend the 2.4340 region again, the structure favors a continuation lower toward 2.0600.
➡️ Primary scenario: rejection from 2.4340 → move toward 2.0600.
⚠️ Risk scenario: breakout above the confluence flips momentum and opens the path toward 2.83 resistance.
If this idea resonates with you or you have your own opinion, traders, hit the comments. I’m excited to read your thoughts!

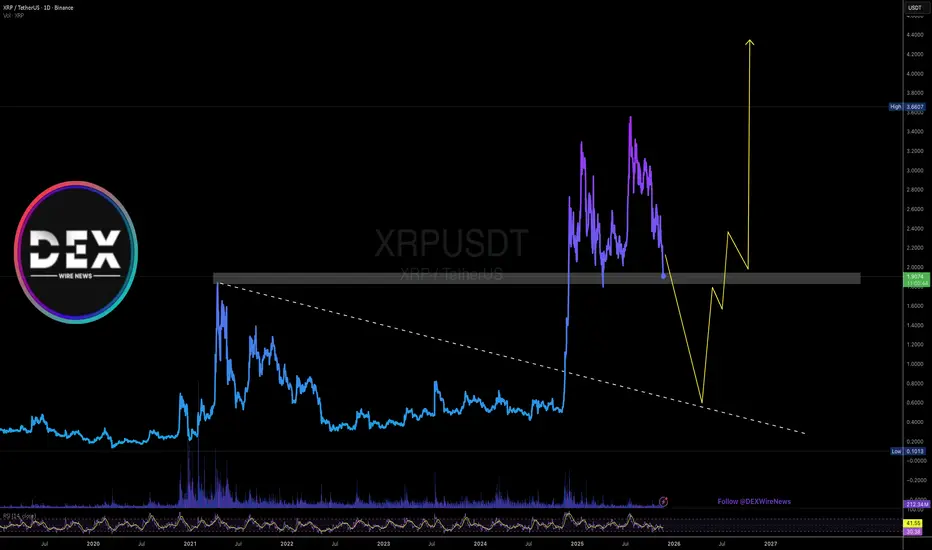
Lets Look at the historyIF.... We look at last year, when we consolidated and all the stars aligned, we broke up and climbed to over 400%, we hit past the fib 1.272 extension, and if we do so again, ( now that we are consolidating again) we might hit through the 1.272 again around the 3.40 range and hit the 1.618 Golden ratio to the $4.30 range. LETS GO!

TradeCityPro | XRP Bulls Eyeing Key Support for Surge👋 Welcome to TradeCity Pro!
In this analysis, I want to review the XRP coin, one of the oldest cryptocurrencies, with a $124 billion market cap, currently ranked 4th on CoinMarketCap.
⏳ 4-Hour Timeframe
After the recent market decline, XRP was one of the coins that managed to recover well. It was supported at 1.8733, and with the activation of the 2.0383 trigger, the price made an upward move.
✔️ Currently, the price is at a very important support zone, and as you can see, it is reacting to this level.
💥 The RSI oscillator has moved close to the overbought zone. If it enters this zone, the momentum of this coin will increase significantly, and the price could continue its bullish movement, potentially reaching higher levels.
✨ If the support zone holds, we can open a long position.
For a more accurate trigger, it's better to wait until the price touches this level a few more times and then activate the trigger.
🔔 The next resistance zones for XRP are 2.3404 and 2.5508, which can be used as targets.
The main trigger for confirming the bullish trend on higher cycles will be the break of 2.5508.
🔍 If the price gets rejected from this level and moves back toward 1.8733, we can open a position if volume starts to increase, using a candlestick setup. Otherwise, we can enter with a break of 1.8733.
📝 Final Thoughts
Stay calm, trade wisely, and let's capture the market's best opportunities!
This analysis reflects our opinions and is not financial advice.
Share your thoughts in the comments, and don’t forget to share this analysis with your friends! ❤️

Breaking; It is Time to Sell $XRPThe price of the notable altcoin Ripple ( CRYPTOCAP:XRP ), saw its value nosedived tanking to the $1.9 support enroute to breaking the $1.8 support point.
With the RSI at 30, if CRYPTOCAP:XRP breaks the $1.8 bottom, we will expect a selling spree to the $0.60 support offering a buy opportunity for traders and investors. Hence the statement "It is time to sale CRYPTOCAP:XRP ".
A bearish symmetrical triangle is already forming as the asset breaks the $1.9 support point.
However, in a bullish thesis, if the asset makes a bounce from the current support point to the $2.5 resistant there might be hope for Ripple.
In another news, XRP has fallen 12% this week as its ongoing decline continues despite growing institutional interest. The altcoin is struggling to recover, even with two XRP ETFs already live and two more scheduled to launch next week.
What Is XRP / XRP Ledger?
Launched in 2012, the XRP Ledger (XRPL) is an open-source, permissionless and decentralized technology. Benefits of the XRP Ledger include its low-cost ($0.0002 to transact), speed (settling transactions in 3-5 seconds), scalability (1,500 transactions per second) and inherently green attributes (carbon-neutral and energy-efficient). The XRP Ledger also features the first decentralized exchange (DEX) and custom tokenization capabilities built into the protocol. Since 2012, the XRP Ledger has been operating reliably, having closed 70 million ledgers.
XRPUSDT: Strong Downward Pressure – Risk of Falling Toward 2.02Over the past 24 hours, XRP has been under significant pressure as the key support level at 2.15 was broken. This breakdown happened alongside a broader “risk-off” sentiment across the crypto market, combined with Bitcoin’s shift into a bearish structure , adding more downward momentum to XRP.
On the 4H chart, the bearish trend of XRPUSDT is very clear as price remains trapped inside a long-term descending channel . Each rebound has been capped at the channel’s resistance line, showing weak buying pressure while sellers continue to dominate .
The 2.22 zone is now acting as short-term resistance. If price retraces to this level, there is a high probability of renewed selling pressure pushing the market back into the downtrend. The next bearish target lies at 2.02, a historically strong support area that has held price multiple times before.
With a combined view of fundamentals and technicals, the overall trend for XRPUSDT remains bearish. Traders may look for sell setups if price retraces into the 2.20–2.22 region, aiming for the 2.02 target in the short term.


XRPUSDTP. - November 20, 2025This chart illustrates a persistent downtrend with consistent lower highs and lower lows, confirmed by the descending trendline pressure. Price has recently broken below a key horizontal support at 2.167 and is accelerating downward toward the next major support zone around 1.95. Bearish momentum dominates, with no significant reversal signals present, and rallies are likely to face resistance near the 2.15–2.17 area. The bearish structure remains intact as long as price stays below the trendline and fails to reclaim lost support.

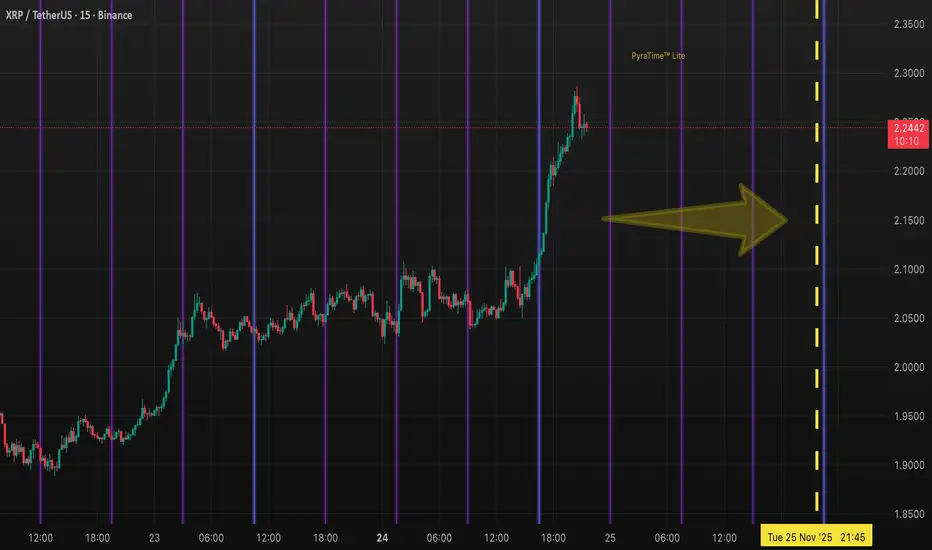
XRP: The "Time Singularity" – Rare Harmonic Convergence IncomingWe just witnessed the price respect the $2.20 geometric level perfectly. But Price is only half the equation. Time is about to take over.
If you study the chart above, look closely at the vertical timeline for Tomorrow (Nov 25) at 20:00 UTC.
⚠️ The Setup: A Harmonic Singularity Usually, our time pivots appear on specific timeframes independently. But tomorrow night, we are seeing a statistical anomaly. We have a Multi-Timeframe Convergence where the short-term high-frequency cycles and the medium-term swing cycles are hitting the exact same vertical coordinate simultaneously.
Think of this like two waves in the ocean combining to form a massive "rogue wave."
What does this mean? When these multiple pivot signals overlap, the market energy compresses. It creates a vacuum that must be filled by volatility. We are expecting a significant Expansion or Reversal event exactly within this window.
The Play: Do not front-run the time. Let the clock hit 20:00 UTC and watch the reaction.
Bullish Case: If Price is holding above $2.15 leading into 20:00, expect a violent expansion upward to challenge new highs.
Bearish Case: If Price is exhausted and below $2.15 entering this window, the time grid will likely force a sharp rejection/reversal to clear leverage.
Summary: Mathematics suggests the market is waiting for this specific minute to make its next major decision. Prepare for volatility.
Disclaimer: This is a time-based analysis using proprietary geometric modeling (PyraTime). This is not financial advice. Trade your own plan.
#XRP #Ripple #SacredGeometry #TimeAnalysis #Crypto
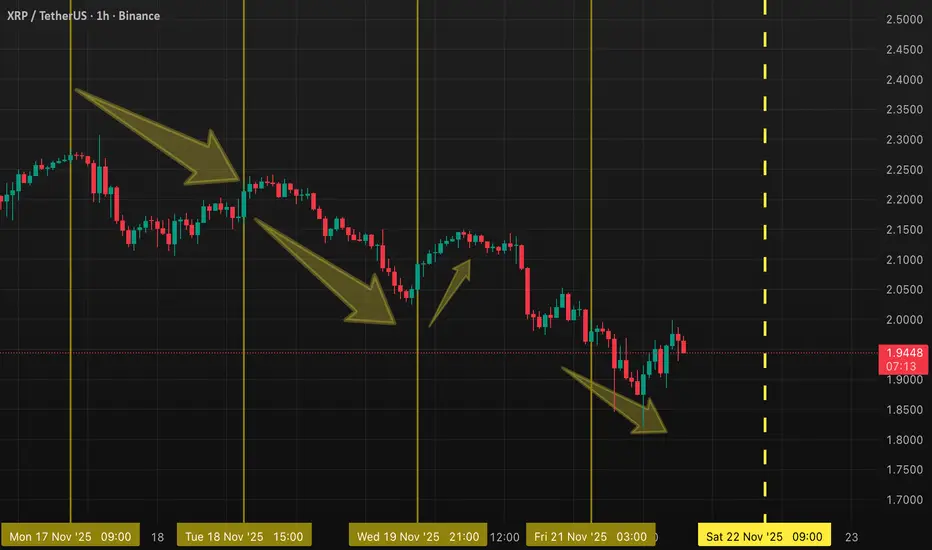
XRP/USDT 1H – Sacred Geometry Time Update (Nov 21, 2025)Current price: ~$1.95
Low today: $1.82
The last three visible reversals all landed exactly on the same forward-projected time grid (derived from one fixed ancient ratio – no repainting, no settings).
The recent drop from ~$2.15 stopped dead on the most recent line and bounced hard.
Next high-probability time window opens tomorrow:
Sat 22 November – 09:00 UTC
In oversold conditions like this (RSI <30, heavy selling exhaustion), these time confluences have repeatedly produced sharp reversals across XRP, BTC, Gold, ES, etc.
Personal bias: watching for a potential snap-back long if we get a confirmed 1H close above $1.98 into that window.
Targets if it triggers: $2.05 → $2.12 → $2.20 stretch
Stop below today’s low.
The trend is down. I'm not calling a bottom. I am saying that these lines have an amazing success rate at predicting reversals or acceleration points.
Not financial advice – just sharing a geometric timing pattern that keeps lining up perfectly.
Curious how one 4500-year-old constant can do this? Happy to explain in the comments.
#XRP #Ripple #Gann #SacredGeometry #TradingView
XRP back to flying?XRP giving big confirmations for a reversal. Let's see if it can breaks the RESISTANCE before new years and achieve new highs for new years.

XRP USDT SHORT SIGNAL---
📢 Official Trade Signal – XRP/USDT
📉 Position Type: SHORT
💰 Entry Price: 1.9000
---
🎯 Take-Profit Targets (Partial Exits)
TP1 = 1.8424
TP2 = 1.7538
TP3 = 1.6190
TP4 = —
TP5 = —
TP6 = —
---
🛑 Stop-Loss: 1.9800
📊 Timeframe: —
⚖️ Risk/Reward Ratio: 4.11
💥 Suggested Leverage: 5× – 10
---
🧠 Technical Analysis Summary
XRP is showing strong bearish signals after repeated rejection near the 1.95–2.00 resistance area.
The price structure is shifting into a downward trend, with lower highs forming across lower timeframes.
Key confirmations for this SHORT setup:
Major resistance rejection at the 2.00 psychological level
Breakdown of intraday support near 1.88
Increasing bearish momentum and downside liquidity gaps
RSI and trend indicators showing weakening bullish strength
TP targets align with key demand zones and liquidity pools from previous market structure
The move toward 1.8424 and 1.7538 is supported by strong bearish continuation patterns.
---
⚙️ Trade Management Rules
✔️ Take partial profit at TP1
✔️ Move Stop-Loss to Break-Even once TP1 is hit
✔️ Trail SL lower as price approaches TP2 and TP3
✔️ Avoid any re-entry if SL at 1.98 is hit
✔️ Use proper risk per trade — no overexposure
---
⚠️ Important Risk-Management Note
After hitting TP1, move SL to the Entry Price immediately.
This eliminates risk and protects your capital.
❗ If the price reaches TP1 and later reverses back to break-even, this is not a loss — it is proper professional trade management.
🔐 Capital protection always comes before profit targets.
---
📌 TradingView Hashtags
#XRPUSDT #XRP #CryptoSignal #ShortSetup #TechnicalAnalysis
#TradingView #FuturesTrading #Altcoins #ProSignal
---

Monthly Crypto Analysis: Ripple (XRPUSD) – Issue 105 The analyst expects Ripple’s price to decline by the specified end time, based on quantitative analysis.
The take-profit level only highlights the potential price range during this period — it’s optional and not a prediction that the market will necessarily reach it.
You don’t need to go all-in or use leverage to trade wisely.
Allocating just a portion of your funds helps keep overall risk low and ensures a more sustainable approach.
Our strategy is built on institutional portfolio management principles, not the high-risk, all-in trading styles often promoted on social media.
Results are evaluated over the entire analysis period, regardless of whether the take-profit level is reached.
-The validity of this analysis is based on a specific time range (until 19 Dec 2025), and after this period, the analysis will be reviewed and updated (once every 28 days).

XRPUSDT.P - November 17, 2025Price remains in a clear short-term downtrend and is retesting support around 2.16 after a sharp decline. A long setup becomes valid only if price shows a confirmed bounce from this support, with resistance and the projected target positioned at 2.26–2.27. A break below 2.10 would likely continue the downtrend toward the lower support near 2.03.
Risk Assessment
With a stop level near 2.03 and a target at 2.26–2.27, the trade offers favorable reward relative to risk but remains high-risk due to trading against the prevailing downtrend.

XRPXRP might show giant move after we touch support inside the channel. We can look at Long and gently accumulate your positions. NFA - DYOR.

Way that i think ,the graphic XRP/USDT it Is going to do Abaut actually frame of tarde over the price of XRP ,from my personal opinion the price have to take the 2.60 USDT per XRP to this moment ahead

XRP - Could Be An Explosive Move Coming From OversoldXRP Crypto1
In all of this time since early 2025 peak XRP hasn't really gone anywhere and although the range has been very broad it has effectively been drifting sideways.
Sideways drifts tend to be re-accumulative.
Notice that XRP day RSI is oversold for the second time in this area.
It did also stab down to record oversold, but this is the first time that price has trended into oversold in all of this long correction.
Current price is drifting in the 1:0.618 Golden Window.
In the recent slump, it did slightly exceed the overshoot bands and so if it dropped to a similar level again that it may signal a move to a lower fib band.
But this is a HTF fib band and so it can get stretched and still give us a signal.
Now, if it does hold then the 1:0.618 GW is a weak ratio because the third wave is shorter than the first.
And so this might be a signal that there is significant bullish momentum building for a next wave up.
When XRP gets impulsive it really flies 🤨.
This analysis is shared for educational purposes only and does not constitute financial advice. Please conduct your own research before making any trading decisions.

XRPUSDT.P - November 21, 2025Price is locked in a well‑defined short‑term downtrend, with a descending trendline capping every rally and the latest breakdown extending from the recent lower high.
The highlighted resistance band around 2.12–2.15 is the key pivot; as long as price remains below this area, momentum favors a continuation lower toward the prior swing‑low support cluster near 1.92, with any bounce into that resistance likely to be sold.

XRP Bullish after 3 YearsXRP in consolidation. Once its breakout we may take entry for long.
For longer period investment you can buy some XRP now.

XRPUSDT.P - November 20, 2025This chart shows a corrective upward move within a broader downtrend, with current resistance at 2.14 and major resistance at 2.17. The price action indicates a possible rejection from these resistance zones, with a projected move down toward the support level around 2.03. Trend structure remains bearish as rallies are failing to break above prior resistance levels. Momentum appears weak, suggesting sellers are likely to regain control near overhead resistance.

XRP - UPDATE: CRYPTOCAP:XRP - update:
TP2 hitted on my short ✅📉
Same view, similar setup under the red resistance zone + downtrend .
The next move will likely depend to CRYPTOCAP:BTC , but keep in mind that the 1.880 - 1.920$ demand zone act as magnet level and could be tested next!
Neutral PA yet & resilient against market crash, but
If #BTC fall under 88k, #XRP will follow.
Not financial advice, #DYOR before following the Froggy guru pic! 📸🐸
