XRP will retest the support line ┆ HolderStatBINANCE:XRPUSDT on the daily chart shows a consolidation breakout, now retesting the 3.26 resistance. A false break scenario may fuel bullish continuation toward 3.50–3.80. Strong support remains near 2.80, keeping the higher-low structure intact.
Trade ideas

XRP Price Struggles Below $3 As Outflows Reach 9-Month HighAt the time of writing, BINANCE:XRPUSDT trades at $2.87, remaining stuck under the $2.95 resistance level. The altcoin has attempted to reclaim the $3.00 threshold for the past two weeks but has repeatedly failed to close above it, highlighting the weakness in bullish momentum.
The Chaikin Money Flow (CMF), a metric tracking capital inflows and outflows, has dropped to a nine-month low. This decline confirms that outflows are currently overwhelming inflows, a bearish sign for XRP's short-term outlook .
Given these conditions, BINANCE:XRPUSDT could face further declines. A drop toward $2.74 remains likely if selling pressure continues, with the asset consolidating above this zone.
If investor sentiment shifts, BINANCE:XRPUSDT could attempt recovery. Reclaiming $2.95 as support would provide momentum to test higher levels. A successful breakout above $3.07 and later $3.12 would invalidate the bearish thesis.

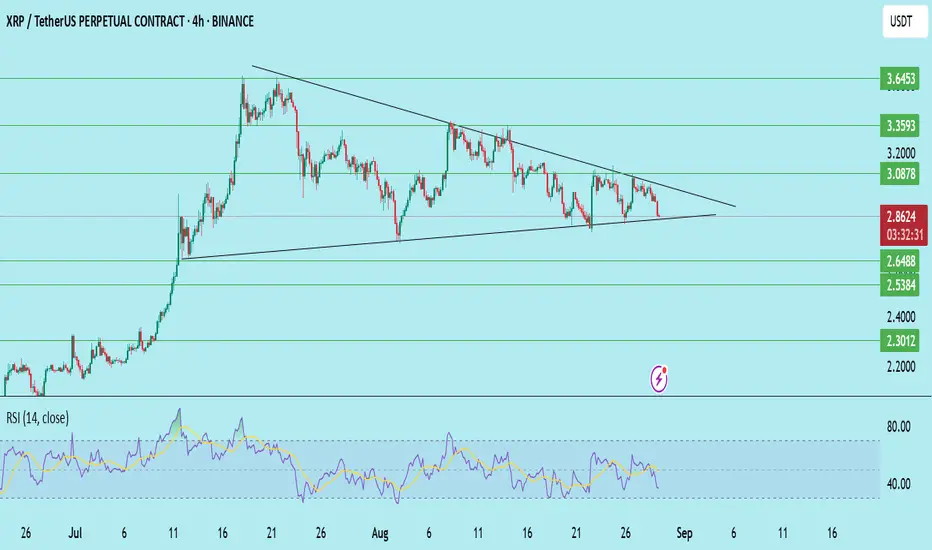
XRP/USDT – Breakdown & RetestCRYPTOCAP:XRP recently broke below its key trendline and has now retested the level, showing rejection — a strong bearish continuation signal.
Structure
Breakdown of the ascending trendline
Retest rejection confirms selling pressure
Supports stacked below at key levels
Trade Plan
Entry: After rejection near the trendline retest
Stop Loss: Above broken trendline
Targets: 0.3540 → 0.3422 → 0.3310 → 0.3240
Bias
Bearish unless XRP reclaims the trendline with a strong close. If reclaimed, the short setup is invalid.
Trading Insight
This is a classic breakdown + retest setup, often signaling continuation to lower support zones. Manage risk with SL.
DYOR | Not Financial Advice
XRP/USDT – Wave 4 Consolidation Before Wave 5?✅ Wave 1 & 2 complete
✅ Strong Wave 3 impulse above $3.6 zone
🔄 Now retracing in Wave 4, contained in a falling wedge
Wave 4 has respected the 0.618 retrace at $2.72, lining up with prior structure support. As long as bulls defend this zone, the setup favors a Wave 5 push toward new highs.
📌 Key Levels
Wave 4 support: $2.7 zone, FVG
$2.20 demand zone
Wave 5 targets: Above or equal prior highs zone
Bias: Wave 4 accumulation → watching for breakout confirmation into Wave 5.

XRP 4X PotetialCRYPTOCAP:XRP did a clean 400% move after breaking out last time.
It just broke out again—same structure, same setup.
$12 XRP isn’t a dream—it’s a target.

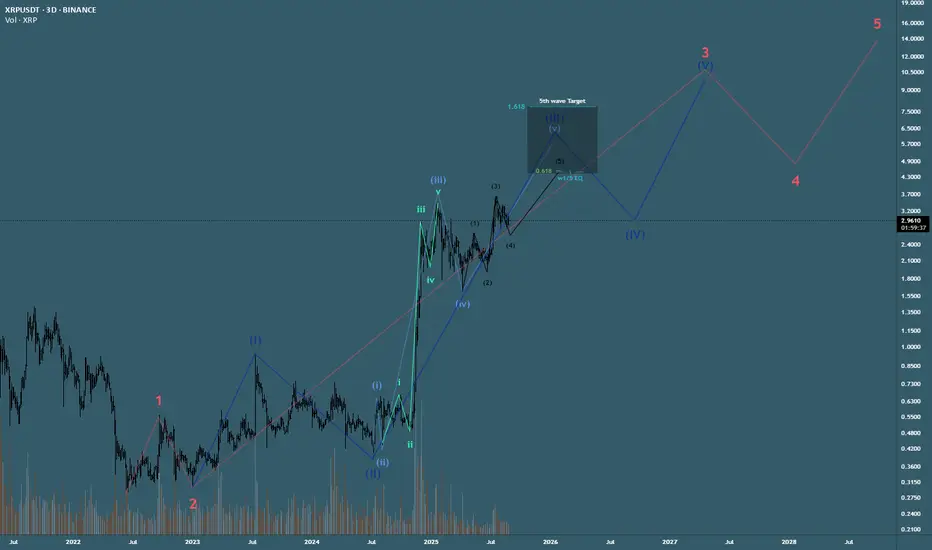
Elliot wave A,B,CI think that we are going to A B C and then pop 5 or 6 bucks still waiting for BTC dom to get to 50% or around there

Super Bullish! HTF XRP Elliott Wave Count - Triple 1,2 ImpulseHere is my most bullish scenario for XRP, all rules followed, higher probability than the diagonal playing out. Expecting a choppy grinding 4,5 structure to finish out the pattern similar to the beginning 1,2 1,2 pattern
XRP - LONG SET-UP (SUPER BULLISH)BINANCE:XRPUSDT
Looking Good To Long Between 2.39 - 2.49
With SL Below 2.24
Safe Target 2.56 , 2.8++
Low Lev only as per your risk capacity
JUST FOR EDUCATIONAL PURPOSE

XRP is moving inside the triangle ┆ HolderStatBINANCE:XRPUSDT on the 16h chart shows a triangle formation developing after a recent high at 3.48. The market is compressing between support and resistance, building energy for the next move. Holding above 2.80 keeps the bullish structure intact, with 3.30 as the breakout level to watch.

#XRPUSDT - UniverseMetta - Analysis#XRPUSDT - UniverseMetta - Analysis
Setup for potential wave 5 continuation
📆 W1 – Weekly Timeframe
🔹 Price has spent over a month in a corrective structure following the completion of wave 3
🔹 A continuation of the 5th wave in the broader uptrend is possible — if price breaks and closes above the trendline
🔹 A down fractal may serve as a key trigger for the next bullish impulse
🎯 Medium-term structure target: $4.32 (Wave 5 — 2.618 Fib from Wave 1)
📉 D1 – Daily Timeframe
🔹 Price has formed a triangle consolidation — signaling potential breakout soon
🔹 Breakout of the upper trendline could lead to a strong upward continuation
🔹 If the move extends as part of a broader correction, we may see targets up to $5.17 (2.618 Fibonacci extension)
🎯 Key resistance zones:
• $4.32
• $5.17
🎯 Trade Idea:
#XRPUSDT #BUY
Entry: 3.1275
Take Profits (TP):
• 3.5193
• 3.7917
• 4.0420
• 4.4544
• *5.1642
Stop Loss: 2.7723
‼️ Risk exposure should not exceed 1–3% of your portfolio
This signal/idea is not financial advice

XRP 4H – Golden Pocket Rejection, Can Support Zone Hold?XRP is consolidating between major Fibonacci levels and clearly defined supply/demand zones. Price has rejected the golden pocket (0.618–0.786) around 3.15–3.25, leaving resistance stacked above near 3.30–3.35.
The downside focus is now on the support zone at 2.85–2.90, which has provided reaction in recent sessions. A breakdown beneath this box could open further downside, while a successful defense could keep XRP ranging under the golden pocket.
Key levels to watch:
Resistance: 3.15–3.35 (Golden Pocket + Supply Zone)
Support: 2.85–2.90
Until one of these boundaries breaks, price remains locked in a range with Fib retracements providing the roadmap.

XRP *UPDATE*Hello friends
After the drop we had, the price was supported by buyers in the support area marked with Fibonacci and is now near an important resistance that if this resistance is broken, the price can grow to the specified limits.
The specified support areas are good points where you can buy in steps and with risk capital management.
*Trade safely with us*

Sweep-&-Reclaim at Range HighXRP is holding the upper third of the range with liquidity building on both sides. Classic SMC setup: sweep the inside of the range → reclaim → trend continuation upward. Confluence from author view: strenSetup & Levels
Entry idea: $2.70-2.80 (limit after reclaim)
Stop: $2.62 (below range low/liquidity pocket) → -9.66%
Target: $3.70 → +33.59%
R:R: ~3.29 : 1
Decision/Flip zone: prior range high / reclaim line around $2.90
Liquidity pools: equal lows cluster below $2.70–$2.62, resting buys above $3.30–$3.50 into $3.70
Scenarios
A) Sweep & Reclaim (Preferred)
Trigger: Wick below the mid/inner range (ideally toward $2.80–$2.75), H1/H4 SFP + close back above $2.90 (acceptance).
Execution: Buy the reclaim > $2.90 or first retest of $2.90 as support.
Targets:
TP1: $3.25–$3.35 (range mid/imbalance fill)** — reduce 30–50%
TP2: $3.70 (range high extension)
Invalidation: H4 close back below $2.90 after reclaim (failed acceptance) or hard stop $2.62.
B) Direct Continuation from $2.90
Trigger: Clean H1/H4 hold above $2.90 without deep sweep.
Execution: Limit at $2.90–$2.93 with tight risk to plan stop.
Targets: Same as A (TP1 $3.25–$3.35, TP2 $3.70).
Invalidation: H4 close < $2.90 (acceptance lost) or hard stop $2.62.
Bearish Invalidation Scenario
Daily close < $2.62 = range demand lost → idea invalid. Stand aside and reassess lower liquidity magnets.
Risk Management
Move stop to BE on break-and-hold >$3.25 or after TP1 hit.
If entry comes after a deep sweep, allow for one retest of the flip before tightening stops.
Avoid chasing mid-range; wait for acceptance signals, not just wicks.
Smart Money View
Purposeful liquidity take below intra-range lows to fuel a reclaim bid.
Equal lows near the stop zone invite the sweep; equal highs overhead (into $3.70) offer the draw.gth into alt rotation once majors resolve.

Is 2.8000 the Godfather of XRP??Historically, It has pump twice when it dumped into this 2.8 weekly fair value gap

XRPUSD Bullish till canceledI am long in XRP, and accumulate my longs, at 2.827 onlöy if the level holds.
Below 2.664 bearish bias starts,and can lead to 1,63
Bullish targets are 3,5327, 3.6796, 4.0248
Risk and stop based on risk tolerance and account risk

XRP 4H – Golden Pocket Retest at Trendline, Decision AheadXRP has bounced into the Fib Golden Pocket and is now testing downtrend resistance at a decision point.
Bullish path: A clean breakout through the trendline could trigger continuation, with further upside if momentum carries through.
Bearish path: A rejection here could send price back into the golden pocket range, with deeper liquidity resting around 2.82.
With Stoch RSI elevated, the next move should confirm whether buyers have strength or if sellers defend the trendline.

Consolidation → Breakout → Pump → Repeat!Consolidation → Breakout → Pump → Repeat! 🔄
That’s how it will continue in the coming months. 📈
All the fun is still ahead. 🤫

XRPUSDT📊 The BINANCE:XRPUSDT is correction-trend. I think the short-term downtrend has come to an end.
🟢 Best support: 2.8640$
🔴 Targets: 3.2060$ - 3.6020$
⚠️ Please control risk management.

Long XRP to All time highThis morning, I entered a long position on the retest of the weekly Volume Area High, which aligned with the significant imbalance left after Powell’s speech yesterday. I’m considering increasing my position if price breaks above the high at $3.10, and may adjust the stop loss to manage risk accordingly.
T1 is intentionally conservative. Upon reaching this level, I plan to move my stop loss to break-even without taking any partial profits, allowing the entire position to run while minimizing risk.
GL

XRP will break the resistance lineBINANCE:XRPUSDT on the 1D chart shows extended consolidation after a breakout from a larger triangle. The current sideways action near $3.48 indicates buyers are absorbing supply before the next move. A breakout above $3.48 could extend gains toward $3.80 and $4.00, with $3.20 acting as the key support level.

XRP Above Support · 5X Lev Trade-Numbers · Mid-Range (PP: 388%)XRP is trading above support. We can see EMA34 (green) being safe on the chart and not yet tested, a signal of strength. Our "support" range is also unmolested on the second drop. So far, support holds.
You know what we always say: "Sell at resistance, buy at support."
This looks like a good chart setup now but it can go wrong. You can have a good trade do bad, just like a bad decision can end up yielding good results. Our goal is to make the right decision all of the time and produce positive results more often than not.
At support, we have lower risk for a drop and higher chance for reversal. If we go deeper and look for other signals, we can wait for a stronger chart setup. Not all chart setups are the same.
Some trades have higher risk, others lower. Some trades move fast others slow. Some trades are a win; certainly, some other trades are a loss.
Our focus is not necessarily on winning once but on producing a positive outcome consistently. Can we achieve or goals? Can we reach success?
This chart setup is bullish but also a mix, prices have been dropping but again, we are looking at support.
Prices have been dropping since 18-July, more than a month. Why would a retrace go for longer? Is it necessary?
I don't know. XRP has been rising since November 2024 and is likely to resume going up. It will do so within hours or days. It will do so within weeks. You can decide to jump now or maybe later, there is no reward without risk.
Go ahead and take the plunge. We are ready for the bullish jump.
______
LONG XRPUSDT 5X (PP: 388%)
ENTRY: 2.73 - 2.95 (STOP: 2.65)
TARGETS: 3.08, 3.30, 3.46, 3.66, 4.02, 4.28, 4.59, 4.85, 5.17
______
You can notice some difference in the trade-numbers compared to previous posts. This is because we have different methods for extracting targets and it all depends on the goals and the timeframe. A daily chart setup will not give you the same targets as a weekly or monthly one.
Normally, I using the long-term targets for all ranges. These targets have been extracted with the mid-term range. But the move can cover a long space.
I am wishing you health, wealth, good luck, profits and success.
Namaste.

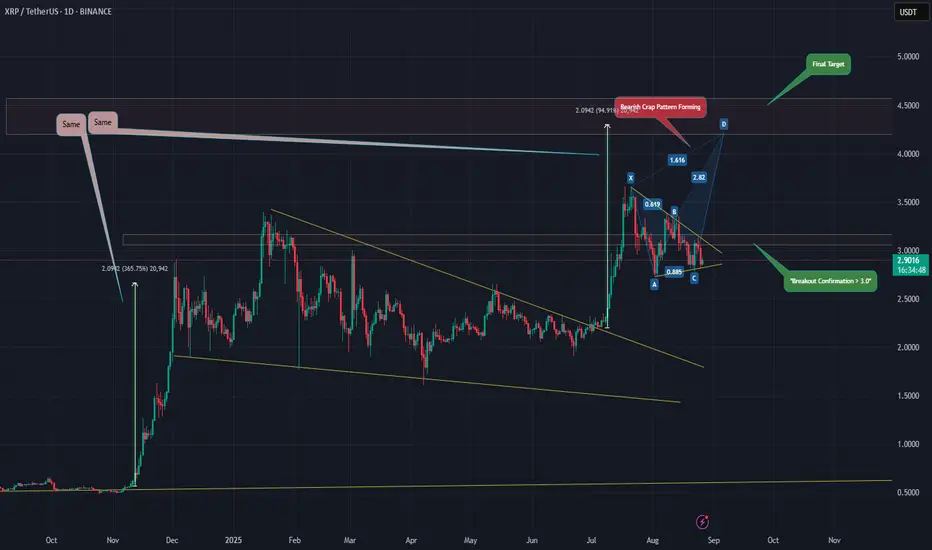
XRP– Bearish Crab Pattern Forming | Breakout Confirmation NeededDescription:
XRP is forming a Bearish Crab harmonic pattern, with price currently consolidating inside a triangle structure. A breakout above the $3.0 level would confirm the move toward the completion of point D.
Key Points:
Harmonic structure: Bearish Crab (XABCD).
Breakout confirmation: > $3.0
Final target zone: $4.5 – $4.6 (potential completion of pattern).
Invalidation: Breakdown below point C (~$2.85).
If price reaches the D zone, it would align with a strong resistance cluster — a possible reversal zone. Until then, breakout confirmation is essential.
📌 This is an educational idea, not financial advice.
XRPUSDT:Trade 15 min FractalConsidering the Ripple chart and the fact that the majority of the movement is bearish, we can have this view, so we can expect the decline to continue even to $2.5.
