XRPUSDT #008 ( XRP goes its own way !!! ) Hello dear traders.
Good days.
First of all thanks for your support and comments.
————————————————————————
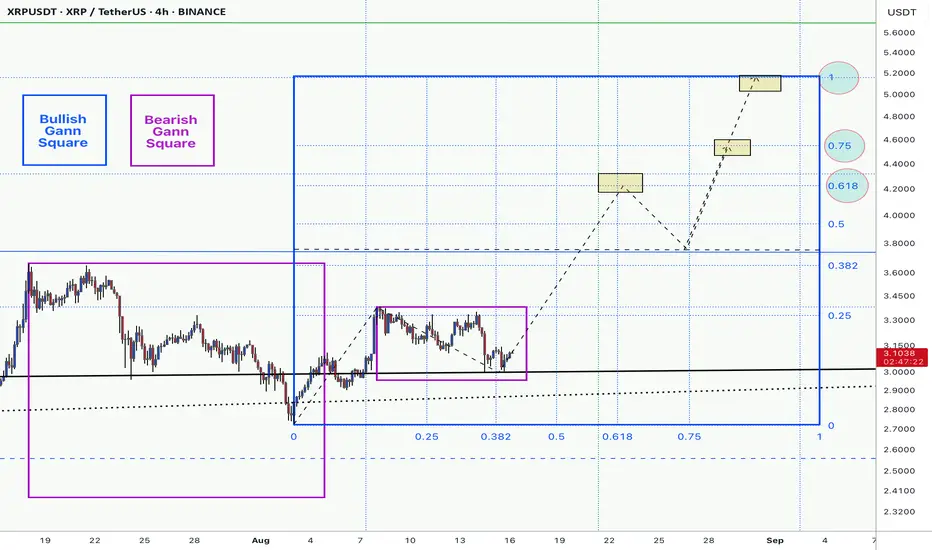
On daily time frame bearish Gann Square is finished and XRPUSDT started its bullish move .
first leg of bullish rally passed and on 4HRS time frame bearish Gann filled 0.75 Gann box Correction and seems close to finish correction time .
Expected to
Expected to grow up from here for next cycle up to 0.618 Bullish Gann Square price zone .
All news came against market but XRP always goes its own way when nobody expected.
Good luck and safe trades.
Trade ideas
XRPUSDT — Descending Triangle Key Zone: Breakout or Breakdown?📊 Overview
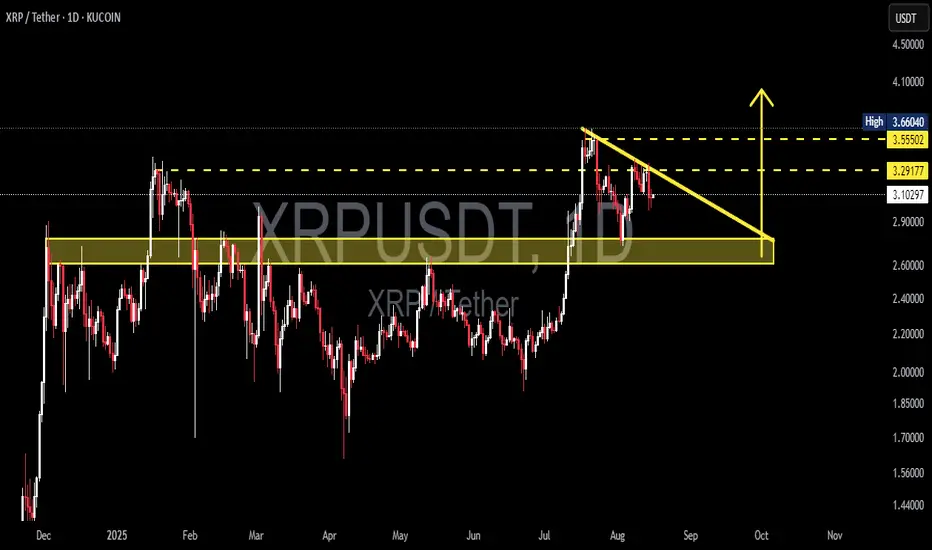
XRPUSDT is currently trading inside a descending triangle formation after its strong rally in July. Price action shows consistent lower highs pressing downward while the support zone at 2.70 – 2.95 (major demand area) is still holding.
This setup is now at a critical decision point: Will the bulls defend the demand zone and push XRP back toward the major resistance at 3.55–3.66, or will bears take control and trigger a deeper correction toward 2.30?
---
🔥 Pattern Explanation
Descending Triangle: Downtrend line connecting lower highs with a flat horizontal base at demand support.
Supply & Demand: The 2.70–2.95 area was a major resistance in the past, now flipped into demand.
Psychological level: The 3.00 mark acts as a psychological pivot zone where reactions often accelerate.
Timing: The triangle’s apex points toward late September – October, meaning volatility is likely to explode before then.
---
✅ Bullish Scenario (Breakout)
1. Trigger: Daily close above the descending trendline and reclaiming 3.29.
2. Strong confirmation: Break and hold above 3.55, opening the path toward 3.66.
3. Measured move target: Triangle height (~0.60–0.75) projects upside to 3.90 – 4.00.
4. Extended target: If volume expands during breakout, rally could extend to 4.10–4.20.
---
⚠️ Bearish Scenario (Breakdown)
1. Trigger: Daily close below 2.90, breaking the demand zone.
2. Immediate targets: 2.60 and then 2.40 as historical supports.
3. Measured move target: Full breakdown projects downside toward 2.30 – 2.15.
4. Invalidation: Price reclaiming 3.10–3.29 after a breakdown.
---
📌 Key Levels to Watch
Supports: 2.95 – 2.70, 2.60, 2.40.
Resistances: 3.29, 3.55, 3.66, 3.90, 4.10.
---
📈 Conclusion
XRPUSDT is consolidating at a make-or-break level inside a descending triangle. As long as 2.70–2.95 holds, bulls have a chance to push price back toward 3.55–3.66 and potentially higher. But if this demand zone gives way, a sharp correction toward 2.30 could follow.
⚡ This descending triangle could act as the catalyst for XRP’s next big move in the coming quarter. Wait for a daily close confirmation to reduce the risk of fakeouts.
#XRP #XRPUSDT #CryptoAnalysis #PriceAction #DescendingTriangle #BreakoutTrading #CryptoTraders #AltcoinAnalysis #SupportResistance
Check if the price can hold above 2.9092
Hello, traders.
If you "Follow" us, you'll always get the latest information quickly.
Have a great day.
-------------------------------------
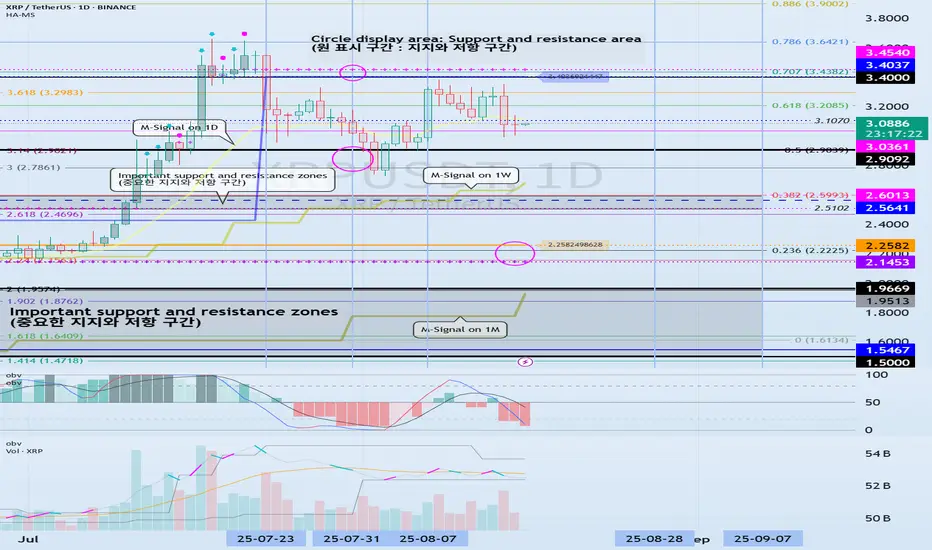
(XRPUSDT 1D Chart)
If the price falls below the 1.5-1.9669 range, a major downtrend is likely to begin.
To maintain the uptrend, the price must hold above the 2.5102-2.6013 range.
If the price falls below the M-Signal on the 1D chart, it is highly likely to meet the M-Signal indicator on the 1W chart.
In that sense, we should check for support around the previous all-time high (ATH) area of 2.9092.
The next period of volatility is around August 28th.
However, since BTC's volatility period is around August 24th, you should closely monitor its movements from around that time.
-
(1M Chart)
While it's virtually impossible to predict the price as it's currently hitting a new all-time high (ATH), the area marked by a circle could potentially become a resistance zone.
The key is whether the price can maintain its upward momentum above the Fibonacci range of 0.618 (3.2085) on the right and 3.618 (3.2983) on the left.
The Fibonacci range on the left was drawn during the first wave.
-
Thank you for reading.
I wish you successful trading.
--------------------------------------------------
- This is an explanation of the big picture.
(3-year bull market, 1-year bear market pattern)
I will explain in more detail when the bear market begins.
------------------------------------------------------
Something I've never ever seen before. Strange? You tell me!getting right to the point there are two charts both XRP The top is the two hour time frame and the bottom is the one hour time frame. As you can see they are both using the squeeze momentum indicator. Have you ever seen before in your life that the two hour time frame would show green already while the one hour time frame would still be in the red for the squeeze momentum indicator? I've never seen that before. Always I've seen that the one hour time frame would go green before the 2 hour time frame. Any comments are appreciated on this matter. Interesting? I'd say so. A bit confusing? Yes. by the way a quick plug for myself if you don't know how to do this I'll create any indicator you want. the catch is I'm making it for myself too

XRP 8H – Testing Key Support Inside Wedge PatternXRP is retesting the $3.00 support area, where horizontal demand aligns with ascending trendline support. Price remains inside a narrowing wedge, with the Stoch RSI oversold—signaling possible short-term relief if buyers defend this zone. A breakout above descending resistance could target $3.40–$3.60, while a breakdown risks a slide toward $2.19 major support. The reaction here will likely define the next swing direction.

XRP - 1H Elliott Wave Analysis - 15.08.25Greetings! We hit 100 Followers, welcome to all the new joiners :) Happy to have you here with us, thank you! ^-^
We assume that the move up from the 3rd of August was a Wave 1 of a Diagonal as ABC and now we are working on the C Wave of the Wave 2 of this diagonal. Alternatively you could count it as double 1-2 set up instead of an diagonal.
The Wave 2 support area is between the 0.5 FIB at 3.0552 USD and the 0.786 FIB at 2.8681 USD.
The next Wave C targets are the 1.382 FIB at 2.9665 USD which is within the golden pocket of the Wave 2 Support area and lastly the 1.618 FIB at 2.9007 USD.
Be aware that if we break the Wave 2 support area we are looking for a deeper retracement which would take us to 2.52 USD or even lower. In this scenario we would need to count the move up that we started in April as a diagonal or even some corrective structure to the upside.
Thanks for reading.
NO FINANCIAL ADVICE.

XRP Hovering Around 20-Day EMA — Possible Breakout Ahead?XRP has been trading near its 20-day exponential moving average, showing indecision in the short term. Price action over the past few sessions suggests traders are watching this level for clues on the next price move.
Holding above the 20-day EMA could signal renewed bullish momentum, potentially opening the way for a retest of recent swing highs.
On the other hand, sustained weakness below this dynamic support may shift sentiment towards the bears, increasing the probability of a pullback.

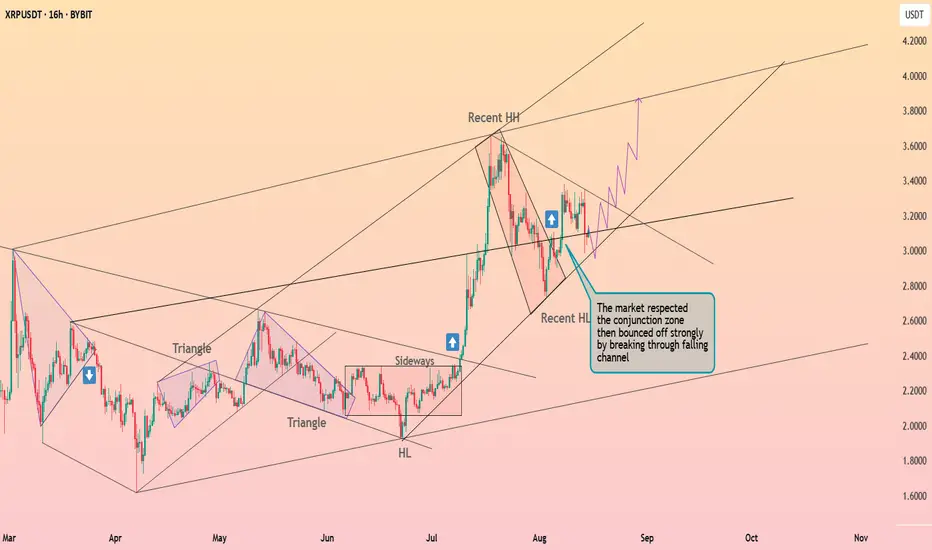
XRP is preparing for a sharp surge ┆ HolderStatBYBIT:XRPUSDT broke out of a falling channel, bouncing off the conjunction zone and maintaining a higher low structure. Bulls are targeting the $3.80 level while defending $3.20 support.
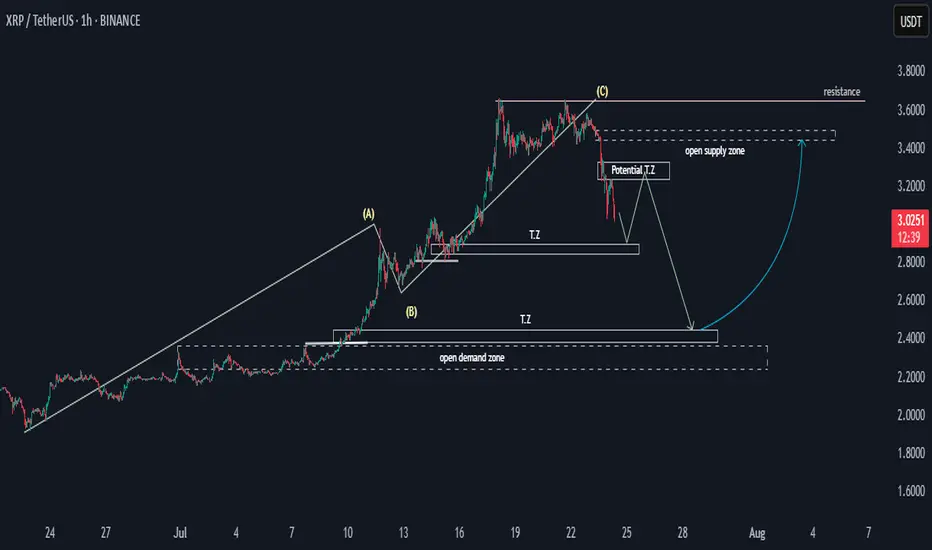
XRP Potential SND Flow MapHello,
This is a general overview of the XRPUSDT flow map, outlining potential price movements.
The price may experience a decline, followed by a pulse upwards before a final drop. Target zones have been identified, and following this, there is a possibility for the price to rally toward the 3.4 supply zone. This would establish the 2.4 to 2.2 range as a key potential bullish zone.
Happy Trading,
Khiwe.
Not trading advice
XRPUSDTTechnical Setup
Pattern: Bullish flag
Trendline: Respected ascending trendline; bounce from dynamic support
Fibonacci Levels: Entry near 0.5–0.618 retracement of prior leg; strong demand zone
RSI: Above 50 and curling upward → momentum building
Target (TP1): ~3.74 – aligns with prior structure and flag projection
Stop Loss: ~3.10 – below recent swing low and structure support
If price breaks and holds above ~3.30 with strong volume, the path to 3.74 opens up quickly.
Just monitor closely around 3.30 resistance — it’s your decision zone.

XRP 4H – Pullback Toward Fib Support ZoneXRP’s 4H chart shows a breakdown from a descending trendline, with price now heading toward the key Fibonacci retracement support zone between $2.80 and $2.30. Oversold Stoch RSI suggests a potential bounce setup, but a sustained move below the 0.618 level could open deeper downside toward the 0.786 retracement. A reclaim above $3.20 would invalidate the immediate bearish bias.

XRPUSDT Bearish Breakdown Setup From Range SupportAI Trade Setup Analysis
Timeframe: 4H (Four Hour)
Position Type: Short (Sell)
Entry Point: 3.1931
Positioned exactly between the stop loss and take profit zones, marking the breakdown level from a recent range structure.
Stop Loss (SL): 3.3600
Placed above the recent swing high and consolidation ceiling to protect against a false breakdown. Risk is approximately +5.23% from entry.
Take Profit (TP): 2.8200
Target set at a major support level, offering a potential downside of around -11.68% from entry.
Risk/Reward Ratio: 2.24
A solid setup offering more than double the reward compared to the risk.
Technical Outlook:
XRPUSDT has broken below its recent range floor with strong bearish momentum, signaling potential for further decline. The breakdown from this consolidation zone increases the probability of continuation toward the $2.82 support.
Bearish Scenario: Continuation of selling pressure below 3.1931 could lead to a move toward 2.8200.
Bullish Invalidation: A sustained close back above 3.3600 would negate the breakdown setup and could trigger a reversal.
Summary:
This trade setup aims to capitalize on a confirmed breakdown from range support, with a well-defined stop above resistance and a target at the next key support, supported by a favorable risk/reward profile.

XRPUSDTHello Traders! 👋
What are your thoughts on RIPPLE ?
On the XRP chart, we can see that after breaking the descending trendline and reaching a resistance level, the price has entered a corrective phase.
We expect this correction to continue down toward the support zone, which coincides with the ascending trendline. This area also represents a pullback to the previously broken bearish trendline.
Once the pullback is complete, we anticipate a bullish continuation toward higher targets.
Don’t forget to like and share your thoughts in the comments! ❤️

XRPUSDT Bearish Reversal Setup From Resistance Level(AI) Trade Setup Analysis
Timeframe: 4H (Four Hour)
Position Type: Short (Sell)
Entry Point: 3.3200
Positioned exactly between the stop loss and take profit zones, providing an optimal short entry from a resistance zone.
Stop Loss (SL): 3.4100
Placed above the resistance area to protect against a bullish breakout. Risk is approximately +2.71% from entry.
Take Profit (TP): 3.1200
Target set at a notable support zone, offering a potential downside of around -6.02% from entry.
Risk/Reward Ratio: 2.22
A moderately favorable setup with more than twice the reward potential compared to the risk.
Technical Outlook:
XRPUSDT is testing a resistance area after a short-term rally. This zone could act as a cap, potentially triggering a retracement back toward support.
Bearish Scenario: Rejection around 3.3200 could lead to a decline toward the 3.1200 target.
Bullish Invalidation: A sustained break above 3.4100 would invalidate the bearish setup and could trigger further upside momentum.
Summary:
This trade setup is structured to capture a short-term pullback from a resistance level, with a well-defined stop loss and target, supported by a clear risk/reward profile.

XRP 1:3 SCALPDrop down to 5min time frame
Risky trade only 0.5% risk 1.5% gain
Lets see how we go 🚶♂️
XRP Price Analysis and ProjectionOn 1 day timeframe, the price action of XRP is described via Smart Money Concepts showing various key levels and zones over a period of little over year-to-date
NOTE 1:
From YTD (Jan 2025 - Aug 2025), XRP was moving sideways until the recent the upside movement
On observing end of June 2025 to Aug 2025 on the same timeframe
NOTE 2:
two trend lines can drawn which suggest the following
-- price may reach upto $3.8 if steeper trend lines is followed
-- price may consolidate between the two FVGs around $3.1 & $3.4
(both estimations are valid till August 30, 2025)
On 45 mins timeframe, the price is tracked by EMA with bollinger bands helping visualizing the volatility and strength of the move with probable highs and low points. It also contains RSI showing overbought and oversold conditions neatly
NOTE 3:
In previous 7 days,
-- 14 Points of Interest (price crossing/touching EMA line) can be observed
-- 10 oversold (buying chance) and 7 overbought (selling chance) can be seen via RSI
-- Price may fall down today (14th Aug 2025) to the steeper trend line (marked on 1D)
-- RSI suggesting buying chance is around the corner
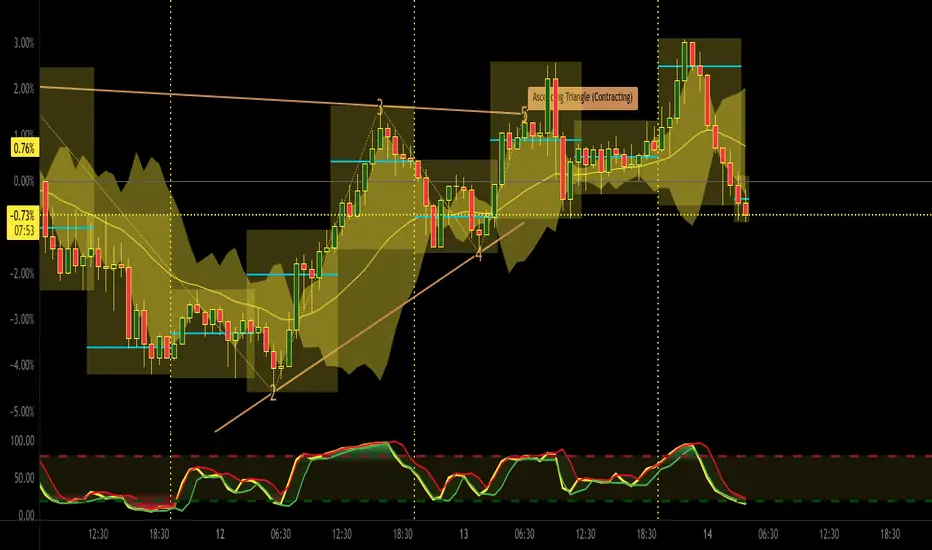
On 3 mins timeframe, price is observed over three 8-hours session-a-day. A LSMA and Supertrend is used to carve-out 1 or 2 good moves in a session.
NOTE 4:
In today's first 8 hour session,
-- an upside move followed by a sharp downside move can be seen
-- both moves had good volume
-- LSMA sugggested potential reversal to downside before it actually happened
-- Supertrend highlights the trend in the session
SUGGESTION
1. Use RSI for signals of buy / sell, on 45 min timeframe (higher timeframe signal)
2. Use Supertrend as confirmation of the RSI signal (lowe timeframe confirmation)
3. Build the position over next dew days
TIP:
Wait for the RSI (yellow) line to overlap the red line and show the green line before entry
:)
XrpusdtLooks sólid to me Macd Cross to the up side resistance is broken if it closed avobe 3.31 i think xrp is headed to 3.60 then make new all time high

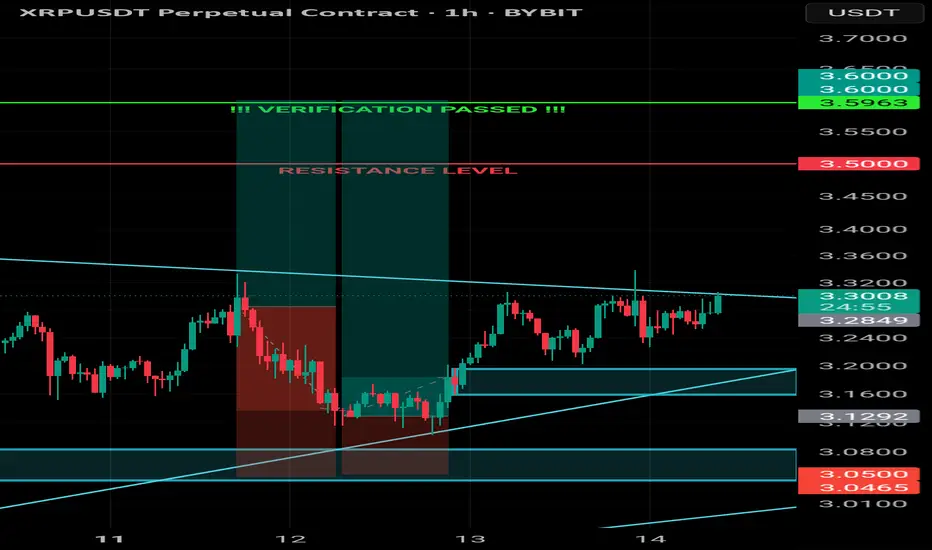
FTMO PASSED! (Maybe)Documenting the point when I pass (or not 😜) my current FTMO funded account verification stage for a $50k account
I've tried a bunch of times and failed but feel this time will be it
Stage 1 passed in 7 days with 10% gain and I'm now on day 4 of the verification stage 😀
Both trades are active with the newest trade stoploss at breakeven
XRPUSDTprobably this expectation will be real until end of tomorrow. let see what will happen. but if give some info regarding setup. internal structer bring high and it created fvg and idm also there is mitigation below of them. even if mitigation or fvg does not bring new high it will give powerfull reaction .

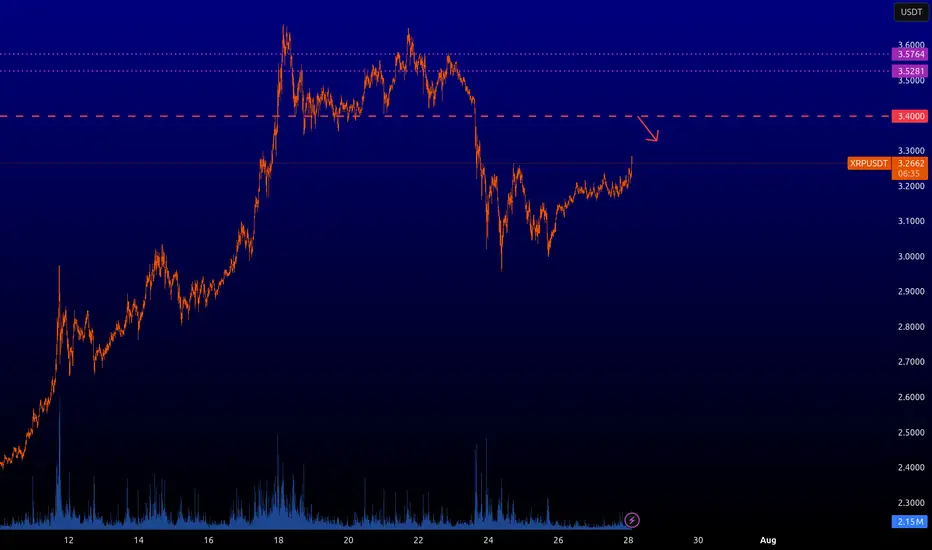
XRPUSD : Key levelsIt is possible to short from the red level with arrow, other levels are inactive for now.
XRP - 1H Elliott Wave Analysis - 13.08.25Greetings, this is our updated Elliott Wave Count for XRP.
This one is slightly more complex as we got two cases to discuss, so bear with me!
We assume that we are in an impulse to the upside in a five wave move displayed as white.
We finished white Wave 1 and 2 and started working on the Wave 3. In this white Wave 3 we have finished green Wave 1 and potentially green Wave 2.
Case 1 (very bullish):
Assuming the low of the 12th August was the green Wave 2 we would look for strong move up now in a 3rd Wave. In this move we have a blue five wave move of which we finished blue Wave 1 and potentially blue Wave 2 in the yellow ABC. Due the yellow B Wave being an overshooting B Wave it is possible that the yellow C Wave was very shallow and we already finished it. Next we would look for a strong Wave 3 which could take us to a new ATH with only shallow pullbacks in wave 4's. For this case we want to stay above the 0.786 FIB of the blue Wave 2 support area which is at 3.1535 USD, dropping below it would shift probabilities heavily to case 2.
Case 2 (bullish):
In this case we still finished the green Wave 1 but we didn't finish the green Wave 2 which would unfold as a bigger correction displayed as red ABC. The 12th August low was only the A Wave and the rally afterwards was the red B wave. Assuming the red B Wave is finished we would look for the C Wave next which should re-enter our green Wave 2 support area. The Wave 2 support area lies between the 0.5 FIB at 3.1420 USD and the 0.786 FIB at 3.0044 USD. The 1 to 1 FIB target for the C Wave is at 3.0552 USD which is right below the golden pocket.
Trade safe <3
Thanks for reading.
NO FINANCIAL ADVICE.

XRP BUYOne can take a buy now since there is already a breakout after the resistance that has now become support.The expected take profit is at 3.5614.

XRP Forms Fifth Wave and Bullish Flag With Potential Breakout AbAccording to wave analysis, XRP is trying to form a fifth fall, according to wave analysis, after breaking through the fifth wave , price growth is often observed
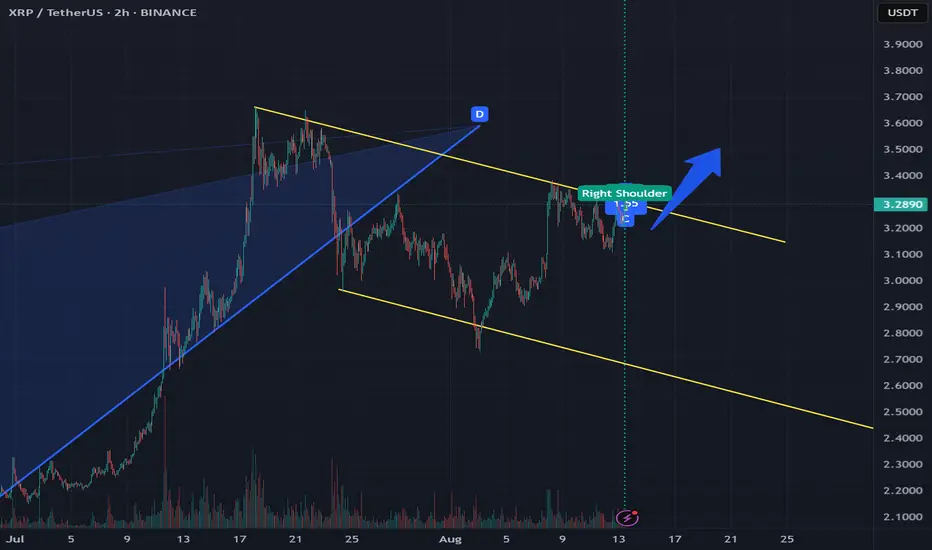
There is also an attempt to exit the descending corridor, which forms the bullish flag pattern
The descending corridor was formed after exiting the global butterfly pattern
On the minute timeframe, we see two patterns that tried to break through the upper border of the descending corridor, these are the head and shoulders, and the butterfly
Current price: $3.2830
If there is a breakthrough of the upper border of the descending level, according to the bullish flag pattern, the price is more likely to rise to the level of $3.30 , after which it can go to the levels of $3.33
Also, if the price does not hold after the breakthrough, it can fall to the level of $3.2637 and below