XRPUSDT → Pre-breakout base. Are the bulls back?BINANCE:XRPUSDT is attempting to break through the resistance of the trading range as part of a bullish run across the entire market. There is a chance that a breakthrough could form after a pullback...
The market is gradually buying back the liquidation that occurred on October 10. Bitcoin is breaking the structure, which indicates a possible return of the bulls. This sets a positive tone for the cryptocurrency market.
XRP is testing resistance and entering a consolidation phase. The trigger that could provoke growth is 2.661. However, as part of the consolidation, the market may test support before growth in order to hunt for liquidity.
Resistance levels: 2.661, 2.739
Support levels: 2.587, 2.547, 2.500
Since the opening of the session, the market has formed a fairly strong momentum, and at the beginning of the European trading session, a correction may form before the growth continues. As part of the correction, XRP may form a pullback to 2.587 - 2.500.
Best regards, R. Linda!
Trade ideas

DeGRAM | XRPUSD seeks to the $2.4 level📊 Technical Analysis
● XRP/USD continues to trade under a major descending resistance trendline, facing repeated rejection near 2.70. Price consolidation beneath this zone signals waning bullish momentum.
● The pattern shows lower highs and potential for a corrective decline toward 2.38 support, aligning with prior reaction lows and structural confluence.
💡 Fundamental Analysis
● Investor caution remains as Ripple awaits further regulatory clarity post-SEC settlement, while broader crypto risk sentiment weakens amid dollar strength.
✨ Summary
● Short bias below 2.70; target 2.38. Failing momentum and macro headwinds reinforce bearish continuation.
-------------------
Share your opinion in the comments and support the idea with a like. Thanks for your support!

XRPUSDT.P - October 28, 2025Entry price is at 2.6375 with a market order; if price has moved slightly higher, consider placing a better limit order entry. Profit level is set at 2.6969, stop level at 2.5976, and move stop level to breakeven at 2.6614. Based on the recent consolidation and breakout attempt, this is a medium-risk setup due to moderate volatility and proximity of stop to recent swing lows.

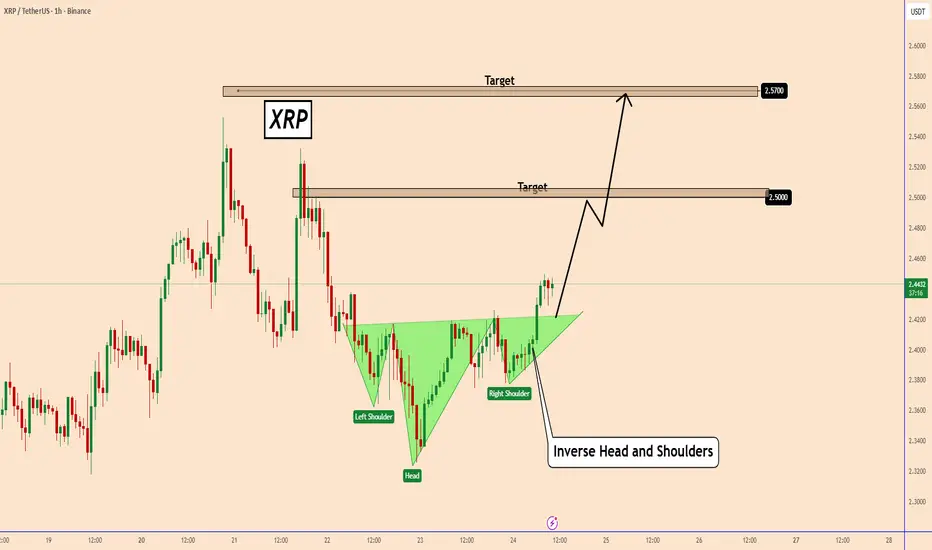
XRP Prepares to Resume Uptrend with an Inverted H&SH PatternXRP Prepares to Resume Uptrend with an Inverted H&SH Pattern
On the 60-minute chart, XRP confirmed a clear bullish pattern. The price has already broken out of the neckline of an Inverted Head and Shoulders pattern, indicating that the bullish trend is emerging again.
If the price holds strong around this area, there is a good chance that XRP will perform well in this short-term trading setup, possibly reaching targets today or over the weekend.
Main targets:
2,500
2,570
You may find more details in the chart!
Thank you and Good Luck!
❤️PS: Please support with a like or comment if you find this analysis useful for your trading day❤️
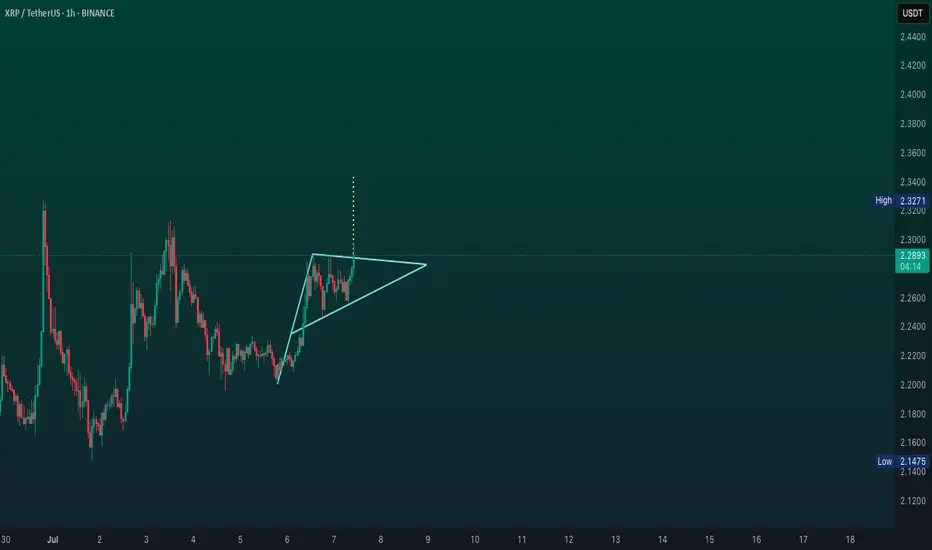
XRP hourly timeframe updateRipple CEO Brad Garlinghouse will testify at a July 9 U.S. Senate Banking Committee hearing on crypto market structure. This comes alongside proposed legislation to clarify SEC/CFTC jurisdiction over tokens like XRP, potentially resolving its multi-year regulatory limbo. Markets are pricing in reduced litigation risk after Ripple’s recent moves to integrate RLUSD stablecoin with institutional platforms like Hidden Road
XRP big reverse cup and handle?Is this the beginning of a reverse cup and handle?
If the pattern plays out, be ready for a drop to 1 dollar. If it breaks its triangle, then the 4 dollar price is in sight.

XRP/USDT 1D Chart Review🔹 1. General Trend
A long-term downtrend is visible, confirmed by the descending trendline connecting the peaks (black diagonal line).
The price continues to respect this trend, and the current rebound looks like a test of this line from below.
🔹 2. Key Levels
✅ Resistance:
2.77–2.80 USDT – current strong resistance (being tested now, with the price trying to break through it).
→ This is the confluence zone: downtrendline + horizontal level.
2.85–2.86 USDT – next resistance (previous local high).
3.12 USDT – main weekly resistance, where the last major downward wave began.
✅ Support:
2.48 USDT – key daily support from which the market rebounded.
2.13 USDT – lower support that halted the earlier crash (large wick).
🔹 3. Stochastic RSI
Currently in the overbought zone (80–100), and the %K and %D lines are close to crossing.
→ This signals that upward momentum may be weakening – a local correction or consolidation is possible.
🔹 4. Scenarios
🟢 Bullish (breakout of resistance 2.77–2.80)
A confirmed breakout and close of the candle above 2.80 USDT will signal a continuation of the move to:
🎯 2.85–2.86 (first target)
🎯 3.12 (second target)
🔴 Bearish (rejection of resistance)
If the daily candle closes below 2.65 USDT, a possible pullback to:
🎯 2.48 (key support)
🎯 2.13 (deeper retest)

Will XRP Form a Death Cross or Repeat July 2025 Rally?At the time of writing, XRP trades at $2.55, holding slightly above the crucial $2.54 support level. The altcoin needs renewed bullish activity to break through resistance at $2.64, which would confirm upward momentum.
If the Death Cross materializes, XRP could face a short-term correction, possibly dropping toward $2.35 or lower. Such a decline might trigger short-lived selling as traders react to the technical setup.
Conversely, if investor maturity continues to grow, XRP could replicate its July 2025 breakout. A successful push above $2.64 could propel the token toward $2.75 and potentially $2.85. This would invalidate the bearish outlook and reigniting bullish sentiment

BUTTERFLY BEARISH PATTERN FOR XRPI've check XRP and its making a butterfly bearish pattern. (4 hour time frame)
- As we can see in our TA. The price is increasing but the RSI is going down. It is showing weakness.
We might see a short term bearish movement for XRP. Lets wait for more signals to come for us to support our technical analysis. Stay tuned! I'll be updating this technical analysis if we see more signal to come.
Lets go! Trade at your own risk and always do your own research!

XRP Whales’ $500 Million Accumulation Pushes Price Past $2.5At the time of writing, XRP trades at $2.65, attempting to establish $2.64 as a new support floor. The token has climbed more than 12% in the past week, marking one of its strongest short-term rallies in months.
If bullish sentiment continues, XRP could extend its rise toward the $2.75 resistance level. Investor support, particularly from whales, may help drive the asset closer to the $3.00 mark, signaling a broader recovery phase.
However, if XRP faces renewed selling or bearish market cues, it could retrace to $2.54 or even $2.35. Such a decline would invalidate the current bullish outlook and suggest short-term exhaustion among investors.

XRPUSDT - BULLISH CONTINUATION IN SIGHTSymbol - XRPUSDT
XRPUSDT is making an attempt to break above the upper boundary of its trading range amid a broader bullish rebound across the cryptocurrency market. A confirmed breakout could develop after a short-term pullback.
The market continues to recover from the liquidation event of last week, with Bitcoin displaying structural strength - hinting at a possible return of bullish momentum. This supports a more optimistic outlook for the overall crypto sector.
Currently, XRPUSDT is testing resistance and entering a consolidation phase. The main breakout point sits near 2.661 However, during consolidation, a retest of support levels remains possible as the market may seek liquidity before a potential upside move.
Resistance levels: 2.661, 2.739
Support levels: 2.587, 2.547, 2.500
Since the beginning of the session, momentum has remained notably strong, though a short correction could occur before the upward trend resumes. During this corrective phase, XRPUSDT may retrace toward the 2.587 – 2.500 zone to gather liquidity before continuing higher.
Ripple vs Tether — Can Bulls Escape the Resistance Trap?📌 TradingView Idea Description (XRP/USDT Thief Strategy)
Asset: XRP/USDT — “Ripple vs Tether”
Market: Crypto Wealth Strategy Map (Swing/Day Trade)
Bias: 🔵 Bullish Setup
🗺️ Trading Plan
Entry Style (Thief Layer Strategy):
Multiple buy-limit layered entries →
✅ 2.8000
✅ 2.8500
✅ 2.9000
✅ 2.9500
(Layers can be increased based on your own risk tolerance)
Stop Loss (Thief SL):
@ 2.7000 (personal setup — adjust as per your own risk appetite)
Target Zones:
🎯 Primary Target: 3.1500 → Key resistance zone + overbought condition + potential bull trap (take profits smartly).
🎯 Secondary Target: 3.3500 → Strong resistance cluster (“police barricade” zone) + overbought trap risk (partial/exit profits advised).
⚠️ Important Notes
👥 Dear Ladies & Gentlemen (Thief OGs):
I’m not recommending my exact stop loss or target — these are my personal levels.
Manage your own risk responsibly: “Make money, then take money at your own risk.”
This strategy is built around layered entries for flexibility in volatile markets.
🔍 Correlation & Related Pairs to Watch
Ripple (XRP) often shows sentiment correlation with broader altcoin momentum and BTC’s dominance. Key pairs worth monitoring for confirmation:
BINANCE:BTCUSDT → Bitcoin drives overall crypto market liquidity.
BINANCE:ETHUSDT → Strong ETH moves can influence Ripple flows.
BINANCE:XLMUSDT → Stellar often mirrors or diverges from XRP due to similarity in use cases.
BINANCE:ADAUSDT → Watch ADA for altcoin sentiment correlation.
Monitoring these pairs can give early signals of potential XRP strength or weakness.
✨ If you find value in my analysis, a 👍 and 🚀 boost is much appreciated — it helps me share more setups with the community!
📜 Disclaimer
This is a “Thief Style” Trading Strategy, shared for educational & entertainment purposes only.
Not financial advice. Trade responsibly — risk management is your best weapon.
#XRP #Ripple #Crypto #Altcoins #USDT #TradingStrategy #SwingTrade #DayTrade #LayeredEntries #ThiefStrategy

[SeoVereign] RIPPLE BEARISH Outlook – October 27, 2025Hello everyone,
This idea presents a bearish (short) outlook on Ripple (XRP).
Currently, Ripple has reached a major resistance zone following a short-term upward movement,
and from a technical standpoint, a corrective phase is likely to occur.
Basis — BEARISH BAT PATTERN (Alternate Bat Pattern)
Structurally, Ripple has entered the PRZ (Potential Reversal Zone) of a Bearish BAT Pattern.
This zone coincides with a price range that has historically shown strong selling pressure,
and typically, a downward reversal tends to occur once the pattern is completed.
Accordingly, the average target price is set around 2.3 USDT.
This perspective is based on data as of October 27,
and further detailed updates will be provided depending on future price developments.
Thank you for reading.

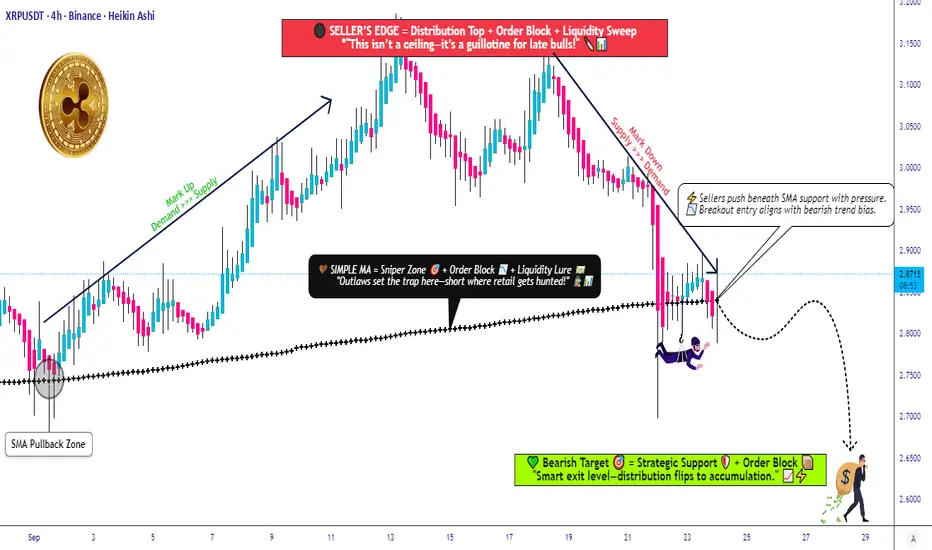
Ripple vs Tether: Key Technical Levels Every Trader Should WatchXRP/USDT | "RIPPLE vs TETHER" Market Wealth Strategy Map (Swing/Day Trade)
📊 Plan:
We’re eyeing a bearish confirmation if candles break below the 0.786 Fibonacci zone + SMA breakout @ 2.8300. At that point, sellers could gain momentum and dominate short positioning.
💡 Thief Strategy Highlight → Using a layered entry style (multiple limit orders). This method allows staggered entries rather than “all-in at once.”
🎯 Layered Short Entries (Sell Limits):
2.9300
2.9000
2.8800
2.8600
(You can expand layers based on your own strategy adjustment.)
🛑 Stop Loss (Thief SL):
Placed near 3.0000 — but ⚠️ please note: Risk management is personal. Thief OG’s — make your own choices. My SL is just an example.
✅ Target (Thief TP):
The “police barricade” (aka strong resistance zone with overbought pressure + possible trap) aligns around 2.6500. That’s where profit-taking may be wise before liquidity hunters catch us.
Again, this is flexible — adjust TP to your own risk/reward plan.
🔗 Related Pairs to Watch
$BTC/USDT → Major market leader, XRP often follows Bitcoin’s momentum.
$ETH/USDT → Correlation with altcoin sentiment; strong ETH moves ripple across XRP.
$ADA/USDT & $SOL/USDT → Competing Layer-1s, often mirror similar retail/institutional flows.
$XLM/USDT → Direct cousin of XRP, highly correlated in macro movements.
Watching these can help confirm broader market bias & correlation flows.
✨ “If you find value in my analysis, a 👍 and 🚀 boost is much appreciated — it helps me share more setups with the community!”
⚠️ Disclaimer: This is a Thief style trading strategy shared just for fun & community engagement. Not financial advice. Manage your own risk, make your own decisions.
#XRP #Ripple #CryptoTrading #SwingTrade #DayTrading #Fibonacci #TechnicalAnalysis #CryptoCommunity #TradingStrategy
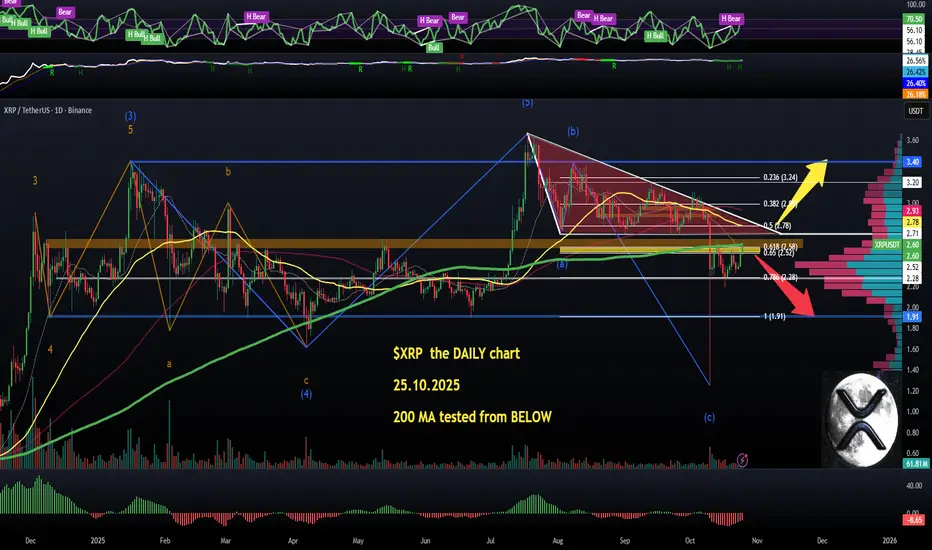
$XRP (DAILY): THE key 200 MA being TESTED from belowCRYPTOCAP:XRP has been fighting HARD TO RECOVER some of its lost value after topping out at $3.67 in JULY.
The #XRPArmy is bloody but not yet beaten, it seems, trying to reclaim the all-important (fat green line, 200 MA just above the GOLDEN POCKET) BEAR/BULL line in the sand.
So, the $2.6~ zone is a pivot level, a long-term horizontal resistance/support level, #XRP MUST close above to flip the MARKET Structure BULLISH.
The worst part of a correction may be finished for now, yes, but this is still a heavy RESISTANCE AREA, not to mention a HIDDEN BEAR RSI divergence flashing.
So, in a nutshell:
1) either a strong show of INTENT to push the price above fib 0.5 ($2.78) in order to continue upwards and toward the BEAR Liquidation zone ($3.05+)
2) or a rejection in the current zone, DAILY CANDLE CLOSES below the 200 MA and further bleeding towards $2.28.
For now, a BEAR MARKET coin until proven otherwise.
💙👽
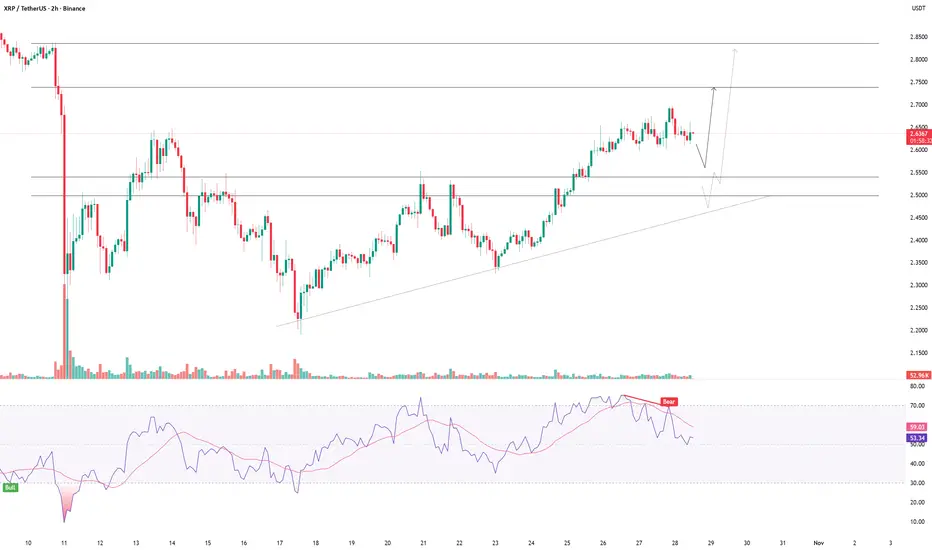
XRP's situation+next targets and expected movementsAs you can see, the price is forming two bullish patterns on the 4h timeframe, If my view is correct, XRP will rise to $2.8
And if this pattern is correct and breaks, higher targets are possible.

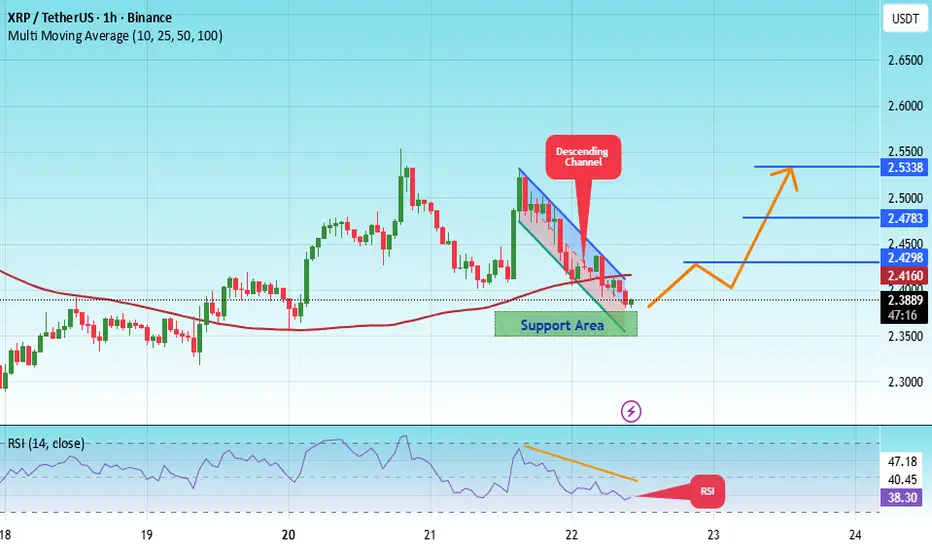
#XRP/USDT (1H) chart, here’s a full technical read:#XRP
The price is moving within a descending channel on the 1-hour frame, adhering well to it, and is heading for a strong breakout and retest.
We have a bearish trend on the RSI indicator that is about to be broken and retested, which supports the upward breakout.
There is a major support area in green at 2.36, representing a strong support point.
We are heading for consolidation above the 100 moving average.
Entry price: 2.38
First target: 2.41
Second target: 2.47
Third target: 2.53
Don't forget a simple matter: capital management.
When you reach the first target, save some money and then change your stop-loss order to an entry order.
For inquiries, please leave a comment.
Thank you.
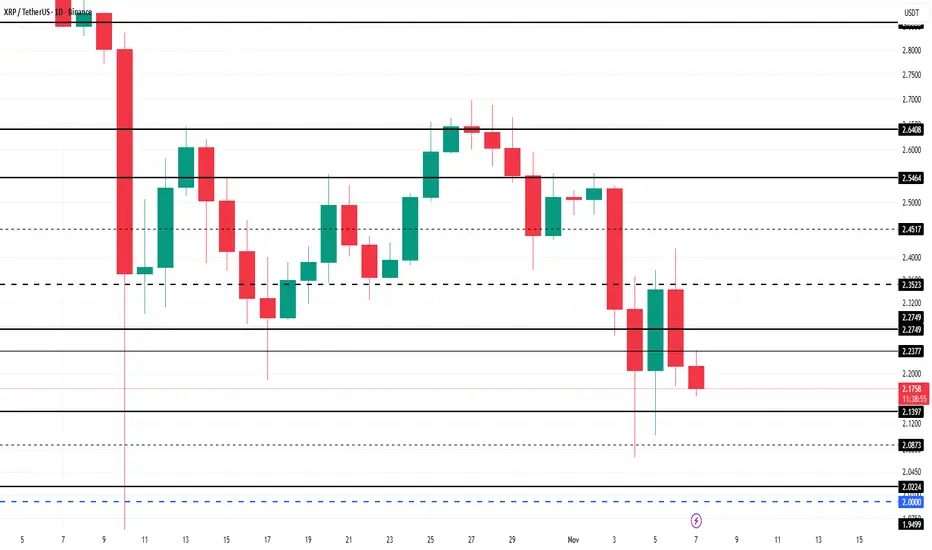
XRP Price Is 9% From Crashing To $2, Can It Be Avoided?At the time of writing, XRP is priced at $2.21, trading below the key resistance at $2.27. If long-term holders begin selling aggressively, the altcoin could fall toward $2.00, marking a 9% decline from current levels.
A drop to $2.00 would require XRP to break through supports at $2.13 and $2.02, both critical levels for short-term stability. If these fail to hold, the altcoin could experience accelerated losses.
However, if investor sentiment strengthens, XRP could rebound above $2.27 and aim for $2.35. A decisive break beyond $2.54 would confirm recovery and invalidate the current bearish outlook, signaling renewed bullish control.
XRP Profits at 12-Month Low, But New Investors Eye Price RevivalAt the time of writing, XRP trades at $2.26, down 10% over the past 24 hours. The altcoin continues to face resistance amid broader bearish market sentiment. However, strong support remains near the $2.27 mark, offering hope for a potential recovery.
If XRP maintains this key support level, it may move sideways in the short term, with possible rebounds to $2.35 or $2.45 as buyers regain confidence. This consolidation could set the stage for a stronger move upward later in November.
However, if selling pressure intensifies, XRP could fall below $2.27, slipping through $2.23 and hitting $2.13. Such a drop would invalidate the bullish scenario and confirm a deeper corrective phase.

XRPUSDT.P - October 25, 2025XRPUSDT is showing bullish momentum with a potential continuation toward the 3.1327 resistance zone, making this a medium-risk long setup. Move the stop level to 2.7152, and while it’s recommended to take full profit at 3.1327 for a better RRR, traders may choose to take partial profit and move the stop to breakeven or simply adjust the stop to breakeven within that range.

Monthly Crypto Analysis: Ripple (XRPUSD) – Issue 103The analyst expects Ripple’s price to decline by the specified end time, based on quantitative analysis.
The take-profit level only indicates the potential price range during this period — it’s optional and not a prediction that price will reach it.
You don’t need to go all-in or use leverage to trade wisely.
Allocating just a portion of your funds keeps overall risk minimal.
Our approach follows institutional portfolio principles — not the all-in or blow-up trading style often seen on social media.
Results are measured over the full time window, regardless of whether the take-profit level is hit.
The validity of this analysis is based on a specific time range (until 21 Nov 2025), and after this period, the analysis will be reviewed and updated (once every 28 days).

Lingrid | XRPUSDT Bearish Pressure Continues BINANCE:XRPUSDT continues its decline within a well-defined downward channel after facing rejection near the resistance trendline. The pair remains trapped under a bearish structure marked by lower highs and lower lows. Unless it breaks above 2.50, the bias stays bearish with potential continuation toward 2.10. Overall momentum reflects sustained selling pressure as the market follows its descending trajectory.
⚠️ Risks:
A sudden shift in BTC sentiment could invalidate the bearish setup.
A breakout above 2.45 would signal a reversal toward 2.83.
Unexpected regulatory or liquidity events could distort short-term technical flows.
If this idea resonates with you or you have your own opinion, traders, hit the comments. I’m excited to read your thoughts!

XRP RIPPLE XRP is a digital asset and cryptocurrency developed by Ripple Labs, primarily designed for fast and low-cost cross-border payments. It serves as a bridge currency in Ripple’s payment network (RippleNet), enabling financial institutions to transfer money globally with improved speed and reduced costs compared to traditional banking systems.
Key Features of XRP
Speed: Transactions take 3-5 seconds to settle, significantly faster than traditional wire transfers.
Low Cost: Transaction fees are minimal, making it suitable for micropayments and international transfers.
Scalability: XRP can handle around 1,500 transactions per second, much higher than Bitcoin or Ethereum.
Decentralized Ledger: XRP runs on the XRP Ledger, a decentralized blockchain-like system maintained by a network of independent validators.
Use Cases
Cross-border Payments: Banks and payment providers use XRP to source liquidity on-demand, avoiding the need to hold multiple fiat currencies.
Remittances: Enables cheaper and faster remittance transfers worldwide.
Microtransactions and Digital Content Payments: Its low fee structure supports small-value transactions efficiently.
Market Overview
XRP is among the top cryptocurrencies by market capitalization.
It has experienced regulatory scrutiny, most notably with the U.S. SEC lawsuit filed by the SEC against Ripple Labs, resulting in legal debates around its classification as a security.
Despite challenges, XRP retains a strong community and ongoing institutional partnerships.
Summary
XRP is a fast, scalable cryptocurrency designed for cross-border payments and liquidity provision, used in RippleNet global payment solutions. It offers efficiency improvements over conventional payment rails and remains significant in the crypto ecosystem.
