XRPUSDT Short Opportunity -6.58% TargetWe just bounced (convincingly) off the mean average price established over the last 10 days and we are currently accelerating further down as I write this. I am short this area, it has already moved into profit so I will trail this to it's conclusion.
I think there is a high degree of likelihood we retest the swing low of $1.95 based in the continuing trend on the 1D chart.
Trade ideas

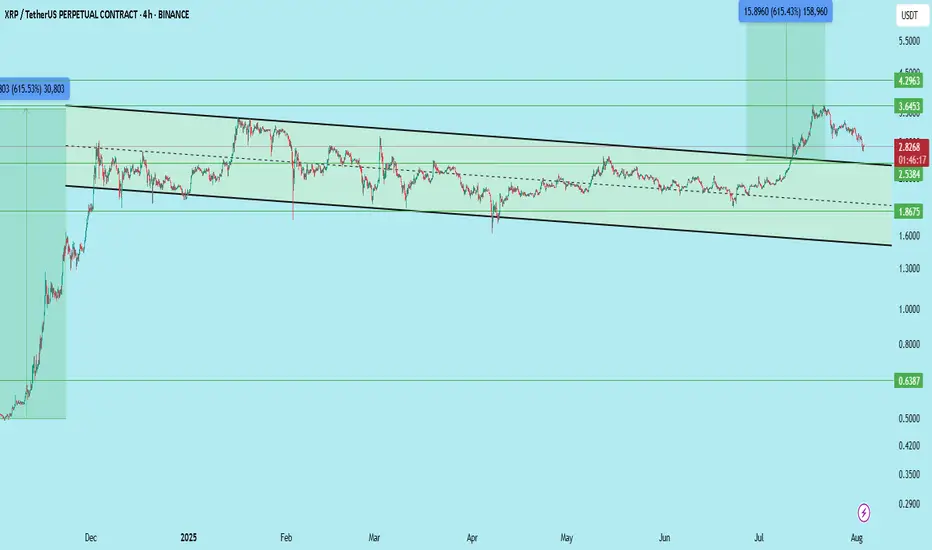
XRP 1D – Major Support Bounce Inside Channel, Will Range Hold?XRP just defended a critical long-term support zone near $2.70 — aligning perfectly with the mid-channel range and previous breakout level. After rejecting from multi-month resistance around $3.15, price has returned to structure for a potential higher low.
🔹 Structure & Range
The macro channel (white lines) has guided price action for over 9 months.
XRP recently tagged the upper boundary, rejected, and pulled back into support around $2.70.
This zone was tested multiple times historically — it now serves as a pivot for continuation vs. reversal.
🔹 Momentum Signal
The Stoch RSI is printing a bullish cross from oversold — a classic confluence for reversal setups.
If the support zone holds, we could see price attempt another run at the $3.15–$3.30 resistance and eventually challenge the upper trendline.
🔹 Macro Outlook
Holding this structure = bullish midterm continuation.
Losing it opens the door for a drop back toward $2.00–$2.25, where the lower channel support sits.
Will XRP defend this channel — or is a breakdown back to $2.00 inevitable?
Drop your analysis in the comments 👇

XRP 8H – Rejection Off Resistance, Can Golden FIB Save It?XRP just printed a clean rejection off the $3.15 resistance zone, and price is now pulling back into a high-probability demand zone — the classic Golden Pocket (0.5–0.618) retracement from the July impulse leg.
With momentum cooling off, bulls need to step in soon or risk a drop into deeper Fib levels.
🔹 Key Levels & Structure
Price failed to reclaim the prior breakout zone (blue box) and is now in a short-term correction phase.
The Golden Pocket between $2.79–$2.59 lines up with price structure from late June.
Below that, 0.786 at $2.28 marks the final zone before invalidation of the full move.
🔹 Momentum Check
Stoch RSI remains in overbought territory — a deeper reset could align with a Fib bounce and create the next opportunity.
Price may need to sweep lows before continuation.
🔹 Scenario to Watch
A bullish bounce from the Golden Pocket → reclaim of $3.15 = strong upside continuation potential.
Otherwise, XRP may revisit the 0.786 level before stabilizing.
Do you trust the Fib support — or are you waiting for confirmation above $3.15?
Let’s discuss 👇

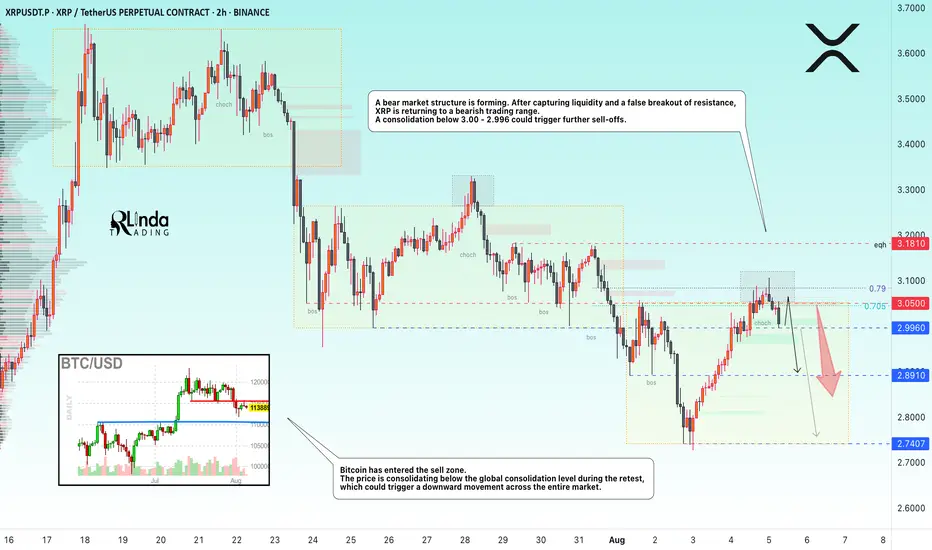
XRPUSDT → Hunting for liquidity ahead of a possible declineBINANCE:XRPUSDT.P is forming a downward market structure after a false breakout of global resistance. Bitcoin is in a correction phase and, after a slight rebound, may continue its movement...
Bitcoin has entered the sell zone. The price is consolidating below the global consolidation boundary of 115,500 during the retest, and if Bitcoin continues to decline, this could trigger a downward movement across the entire cryptocurrency market.
XRP is forming a bearish market structure. After capturing liquidity and a false breakout of resistance, the price is returning to a bearish trading range. There is no potential for continued growth at this time. A consolidation of the price below 3.00 - 2.996 could trigger further sell-offs.
Resistance levels: 2.996, 3.050, 3.181
Support levels: 2.996, 2.891, 2.74
The local bearish structure will be broken if the price starts to rise, breaks 3.050, and consolidates above it. In this case, XRP may test 3.181 before falling further.
At the moment, after a false breakout of resistance, the price is consolidating in the selling zone, and the downward movement may continue. I consider 2.74 - 2.655 to be the zone of interest in the medium term.
Best regards, R. Linda!
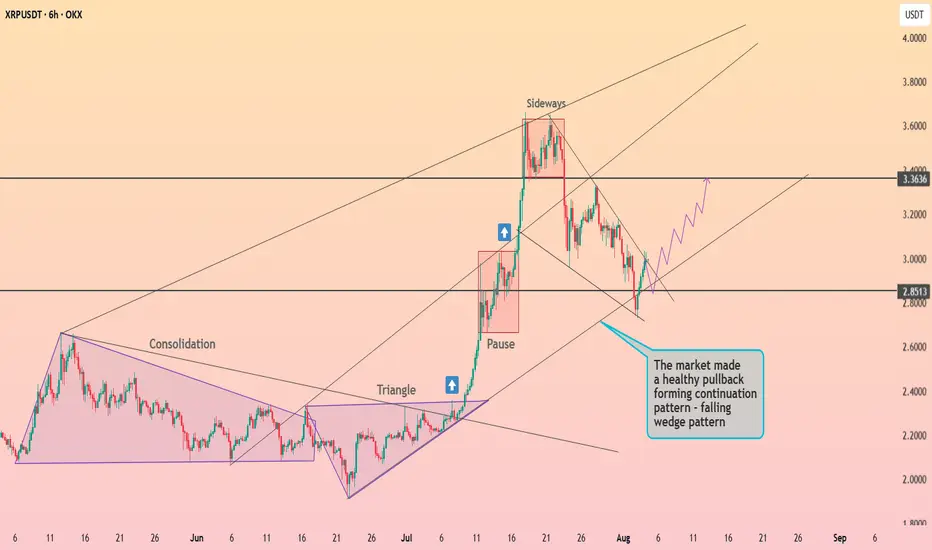
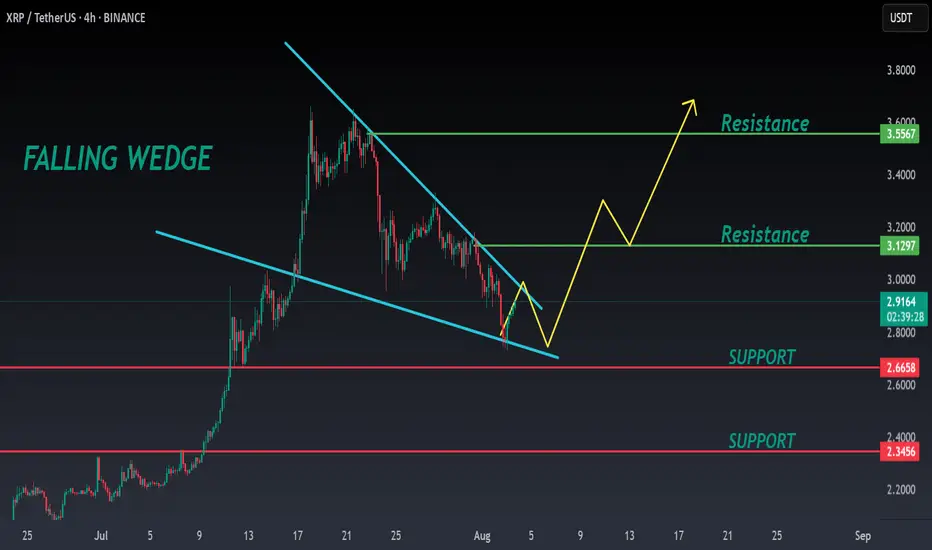
XRP is preparing to exit the wedge ┆ HolderStatOKX:XRPUSDT is forming a falling wedge after a sharp breakout and pullback. Price is stabilizing near $2.85, a key former resistance level. If bulls reclaim momentum here, a move toward $3.36 becomes a high-probability scenario.
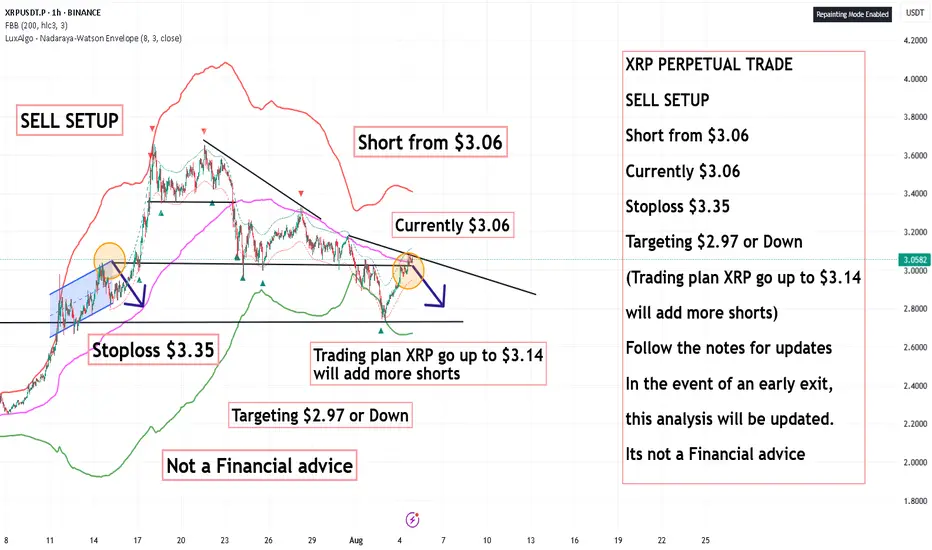
XRP PERPETUAL SELL SETUP ,Short from $3.06XRP PERPETUAL TRADE
SELL SETUP
Short from $3.06
Currently $3.06
Stoploss $3.35
Targeting $2.97 or Down
(Trading plan XRP go up to $3.14
will add more shorts)
Follow the notes for updates
In the event of an early exit,
this analysis will be updated.
Its not a Financial advice
XRP 1H – Support Ladder Holding Strong Into Supply WallXRP continues to climb the support ladder on the 1H chart, forming a series of higher lows while building pressure against a well-defined supply zone around $3.15–$3.20. Each dip has been bought up quickly, with demand zones flipping into short-term support — a strong bullish signal in the short-term trend.
Momentum remains healthy, with Stoch RSI just turning back up from mid-range, suggesting there's still fuel left if the upper resistance breaks.
🔍 Key Highlights:
– Clear multi-step structure of higher lows and support retests
– $3.15–$3.20 has acted as major rejection twice — third test incoming
– Stoch RSI reset and turning upward = potential continuation
– Break above $3.20 could open up a move toward $3.50+
The key question now: Will bulls finally crack the wall, or will this zone continue to act as a ceiling?
👇 What’s your bias from here — breakout or fade?

XRP 4H – Precision Bounce from Golden Pocket After All-Time HighXRP just executed a perfect technical pullback — retracing into the golden pocket (0.618 Fib) after hitting its all-time high. The 4H chart shows textbook structure: a breakout, clean Fibonacci retracement, and an instant reaction from key levels.
📍 0.786 (2.28) marked the original breakout
📍 0.618 (2.58) triggered an aggressive bounce
📍 0.5 (2.79) saw instant rejection on the rebound
📍 All-time high resistance still looms above ~$3.75
What makes this setup especially clean is how XRP respected each Fib level like a playbook — reacting on the dot while Stoch RSI reset completely and flipped upward.
This could be the beginning of a bullish continuation… if we reclaim the mid-range and break above $3.30–$3.50 cleanly.
Until then, this is prime territory for range-bound volatility.
How are you playing it: swing long, short fade, or watching for confirmation?
👇 Drop your setup below.

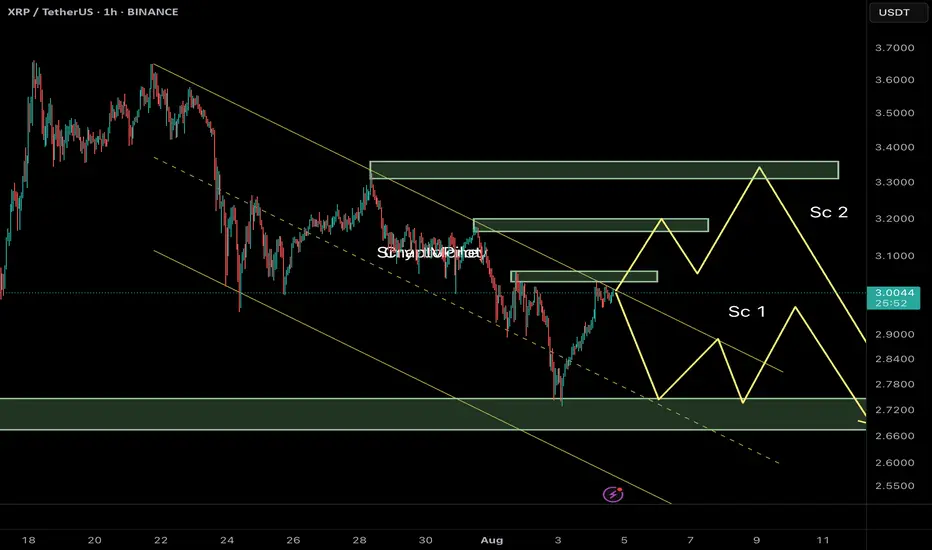
Ripple (XRP/USDT) Technical Analysis – 1H Timeframe🔰 Current Market Context:
After breaking below the ascending channel near $3.50, XRP has entered a corrective phase within a descending channel. Price is now hovering around a mid-range resistance zone, and we can outline two key potential scenarios from here:
⸻
📌 Scenario 1 (Sc1) – Immediate Rejection and Bearish Continuation
In this case:
• Price gets rejected from the current resistance zone ($3.05–$3.10).
• A quick corrective pattern (likely a Zigzag or Flat) plays out.
• XRP moves down to test the next demand zone near $2.70–$2.65, breaking below recent swing lows.
✅ This scenario aligns with the current weak structure and visible sell-side pressure. Liquidity above recent highs has likely been swept, creating a setup for continuation downward.
⸻
📌 Scenario 2 (Sc2) – Extended Correction with a Final Bull Trap
In this case:
• Price pushes higher toward a deeper resistance zone near $3.30–$3.40.
• A liquidity grab above the prior highs triggers a sharper reversal afterward.
• The overall structure could form a Diametric or Complex Correction, suggesting a deeper and more time-consuming wave before resuming the bearish trend.
⛔ This scenario requires strength and acceptance above $3.15, and should be treated as an alternative unless proven by price action.
⸻
🎯 Summary & Trade Strategy:
Scenario 1 is currently more probable unless we see a strong break and close above $3.10. Expectation: XRP may head toward the $2.70–$2.65 demand zone if resistance holds.
⚠️ Avoid entering early. Wait for confirmation via internal BOS (Break of Structure), bearish engulfing near OB zones, or signs of rejection with volume at resistance.
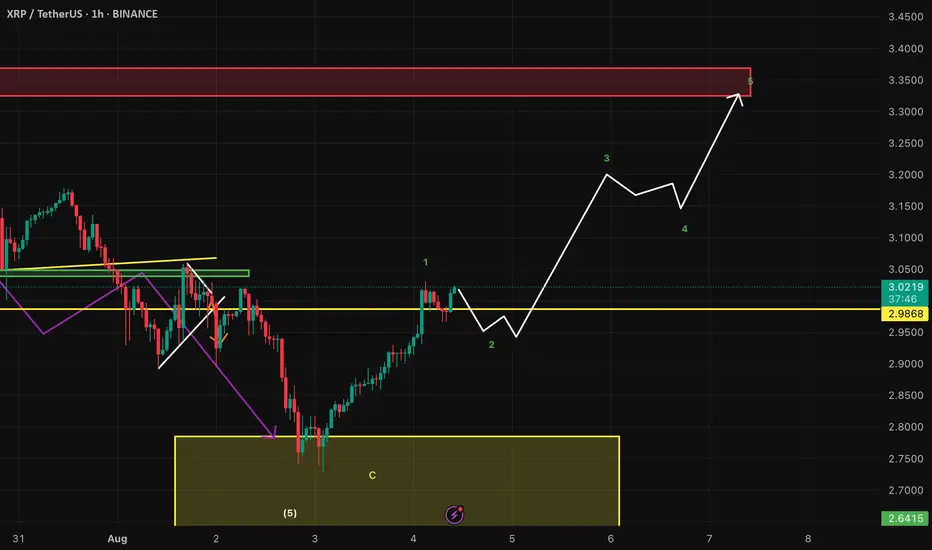
XRPUSD LongWe just finished the 5th wave as exspected and allready started the 1st wave of the next bullish move. I will wait for a correction and enter a long position.
Ripening SellXrp had formed an M formation above, has retest current happen with a huge bullish candle upwards but, if you look to your immediate left-hand side you will see that the level 2.9635 is a point of reversal both with your immediate left-hand and further left.
Time will only tell with the way the candle will close. And if the setup is not invalidated, we project price movi g all the way to 2.2348

XRP ANALYSIS🔮 #XRP Analysis - Update 🚀🚀
💲 We can see that there is a formation of Falling Wedge Wedge Pattern in #XRP and we can see a bullish movement after a good breakout. Before that we would see a little retest and and then a bullish movement.
💸Current Price -- $2.9130
📈Target Price -- $3.1290
⁉️ What to do?
- We have marked crucial levels in the chart . We can trade according to the chart and make some profits. 🚀💸
#XRP #Cryptocurrency #Breakout #DYOR
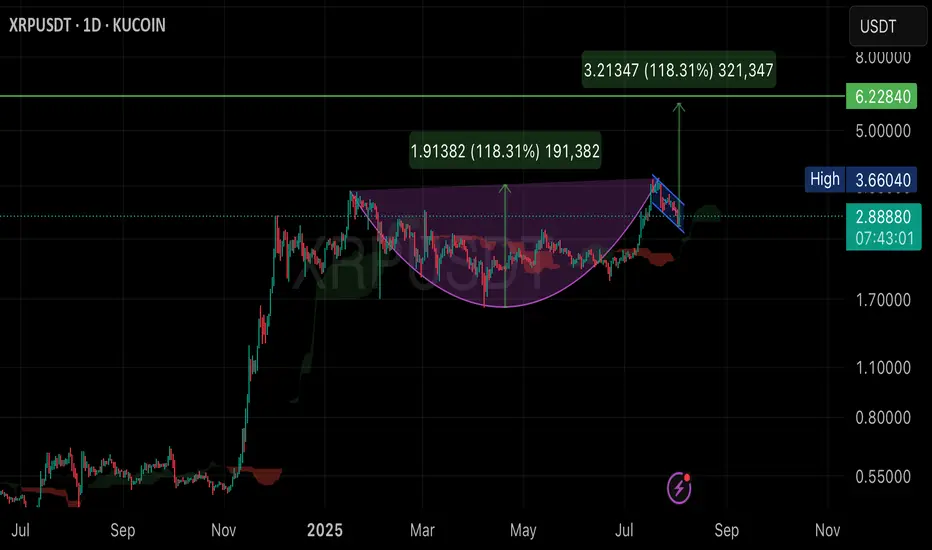
XRP doing Cup with handle pattern?technical analysis chart of the XRP/USDT using daily data (1D). Here are the main details:
• Cup and Handle Pattern: The chart displays a “cup and handle” formation, which is a bullish continuation pattern suggesting further upward movement. The rounded shape below represents the “cup” (running from roughly February to July 2025), and the small channel to the right is the “handle.”
• Target Price:
• The chart shows a projected breakout target from the handle region—from about 2.88 USDT to 6.22 USDT.
• The value 1.91382 (118.31%) is the measured move—calculated from the bottom of the cup to the neckline, then projected upwards from the breakout point.
• Another label, 3.21347 (118.31%), shows a similar projected percent gain (about 118.31%) from the breakout point.
• Support and Resistance Lines:
• Horizontal lines mark key levels, such as 3.66 (recent high) and 6.22 (target).
• Other Indicators:
• The chart uses a red moving average and Ichimoku cloud to highlight trend support and resistance zones.
• Current Status:
• The current price is 2.88881 USDT (up 4.30% on the day).
• A blue channel represents the consolidation phase before an anticipated breakout.
Summary:
This chart suggests that, if there’s a breakout from the “cup and handle” pattern as shown, the next target price for XRP is around 6.22 USDT, representing an estimated 118% gain from the breakout point. The analysis uses technical patterns and indicators to project possible future price movements.
XRP 4H – Double Bottom… or Just Another Lower High?
XRP bounced cleanly from major support — the same zone that sparked its last leg up.
This could mark the early stages of a double bottom or just another bear market rally before continuation.
🔹 Previous top = strong supply rejection
🔹 Current support = high-volume bounce zone
🔹 Stoch RSI turning up from oversold
Key confirmation would be:
– Break of $3.15
– Retest + continuation
Otherwise? Another fakeout lower high could trap longs.

Scalp Setup at Key Support – Reversal or Breakdown?Description:
Price is currently testing a strong intraday support zone, where previous wicks have shown reactive buyers stepping in. However, momentum is weakening, and volume shows signs of exhaustion. This could lead to either a quick reversal bounce or a clean breakdown, depending on how the next few candles close.
I'm watching this zone closely for confirmation:
Long bias if bullish engulfing confirms above the key line with momentum
Short bias if price breaks down, retests, and fails to reclaim support
This is a high-probability sniper zone where liquidity pools often trigger traps. I’ll enter only on confirmation — not anticipation. SL and TP are tight due to high leverage; discipline is key.
Expecting movement within the next 5–15 minutes on lower timeframes.
Comment if you're watching the same setup — let's see how it plays out.
#XRP/USDT – Breakout from Downward Channel | Bullish OutlookXRP has finally broken out of the long-standing downward parallel channel on the 4H chart — a strong bullish signal supported by volume and structure shift.
Falling Channel Structure:
XRP had been consolidating within a well-defined descending channel since late 2024. This structure capped price advances and formed a strong resistance ceiling.
Breakout Confirmation:
Recent price action cleanly broke above the upper trendline with volume expansion, followed by a classic retest of the breakout zone near 2.53, confirming the breakout is valid and not a fakeout.
Volume Analysis:
Breakout was supported by a noticeable increase in buying volume. The retest phase is happening on reduced volume, which is typical for a healthy bullish structure.
Support Zones:
2.53 – Key breakout level and current support
1.87 – Mid-channel level, strong previous base
0.638 – Long-term demand zone (unlikely to revisit unless severe macro breakdown)
Resistance Levels / Targets:
3.64 – Local resistance, recent swing high
4.29 – Major horizontal resistance
Further upside open if macro trend remains bullish
Setup Summary:
Structure: Falling Channel → Breakout → Retest
Entry Zone: Between 2.53 and CMP (~2.83) using DCA
Stop Loss: Below 2.38 to protect against fakeouts
Targets:
TP1: 3.64
TP2: 4.29
Long-Term Open
Why This Matters:
XRP breaking out of a 9-month downtrend indicates a major sentiment shift.
Similar breakouts in the past have led to 600%+ moves, and current structure resembles that setup.
Macro trend shows buyers stepping in with conviction.
DYOR | Not Financial Advice
XRP LongFollowing a significant decline, the asset will take support and bounce back from this point.
Disclaimer: This is not financial advice.
This algorithm provides highly precise buy and sell signals with alerts:

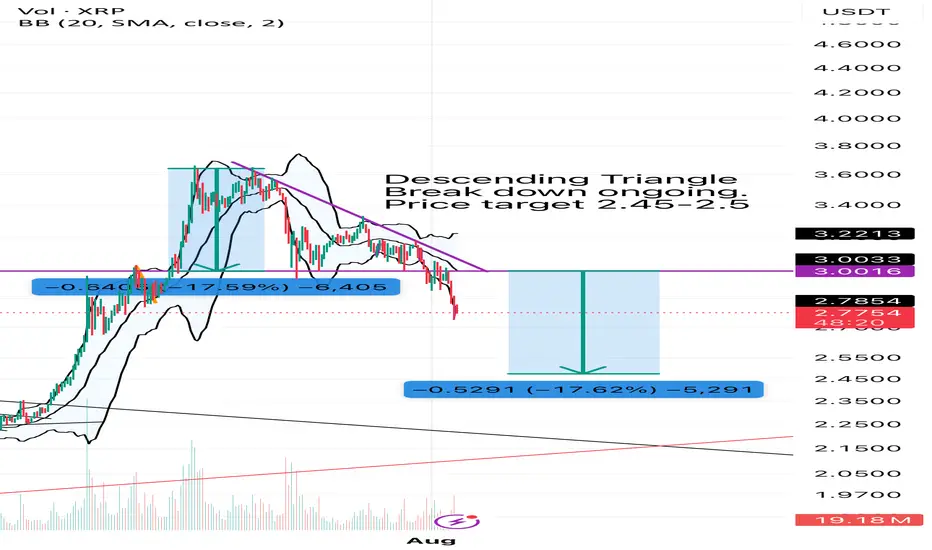
XRP dumping continuesXRP has formed a bearish descending triangle and currently broken down the neck line and continues to dump. This dump will end near $2.45-$2.5 range. Good Luck!
XRPUSDT ShortWe´ve just finished the 5th wave of the bullish structure and started a 5 wave corrective structure for a bigger ABC correction. Right now we´re in the 4th wave and exspecting one more bearish move into the yellow area

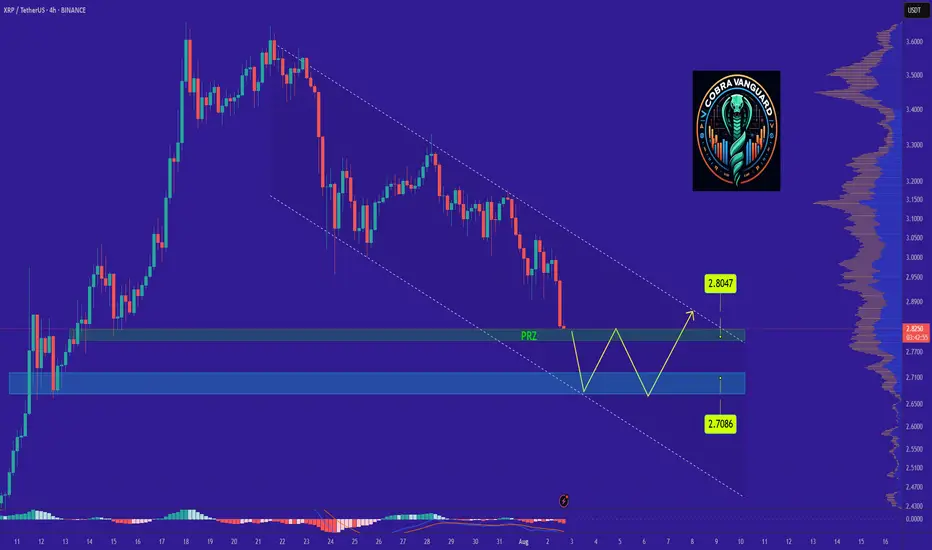
XRPs Situation (Daily) !!!If the price loses the PRZ range, it will drop to the bottom of the channel and then rise to the top of the ascending channel, which will take some time.
Best regards CobraVanguard.💚
XRPUSDT 4H – Pullback Into Support, But Will This Bounce Stick?XRP has retraced nearly 25% off its local highs after a powerful +90% move in July. Price is now pulling back into a well-defined demand zone around 2.85–2.88, which previously triggered the breakout impulse.
📌 What’s notable:
Clean retest of demand + price hovering above the final bullish structure
EMAs are overhead, but not yet fully bearish — a reclaim could flip short-term bias
The lower demand zone (~2.15–2.25) still stands as a last line of defense from the original rally base
This bounce attempt is key — a strong push from here could send price back toward the $3.30–3.50 region. But if bulls fail to hold, there’s room for a deeper retracement.
Trade Planning Notes:
Aggressive Long: Entry on wick into support with tight invalidation
Conservative Long: Wait for EMA reclaim confirmation
Bearish Case: Breakdown = target $2.25 zone
The path from here decides whether this is a healthy pullback — or the start of a reversal. What’s your play? 👇

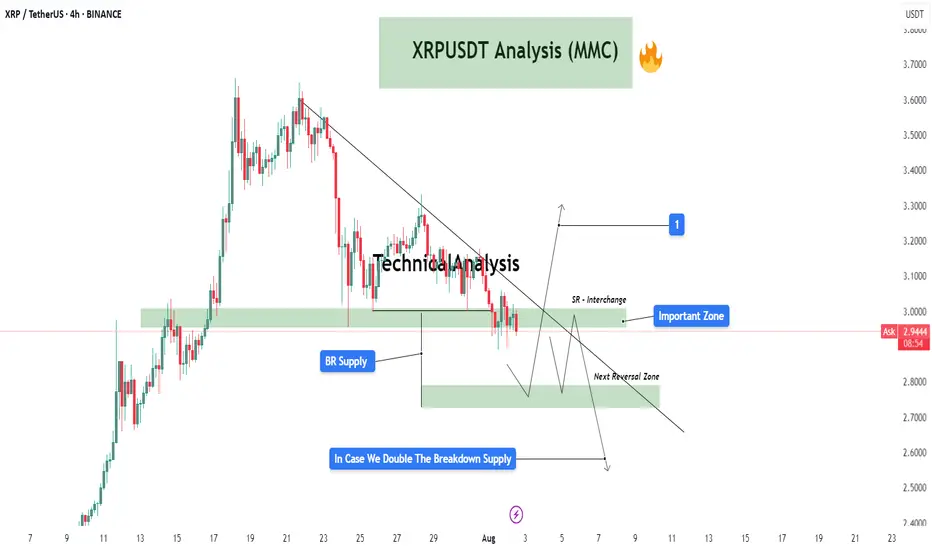
XRPUSDT Analysis (MMC) : Decision Point + Next Move Loading In this 4-hour chart of XRP/USDT, we're observing a critical structure forming under the Mirror Market Concepts (MMC) framework. Price action is compressing near an important descending trendline, suggesting that a breakout or breakdown is imminent. Let’s break it down zone by zone:
🔍 Key Zones & Price Structure:
Important Zone (SR Interchange Zone – $2.95 - $3.05)
This is a major supply-to-demand flip zone. It has served as both resistance and support in the past and is now acting as a potential interchange level. The price is hovering just below this area, retesting it after a significant bearish structure.
BR Supply Zone (Breakdown Retest Supply – $2.93 - $2.98)
After price broke down from this zone, it created a base for a retest. This level has since acted as a cap to further upside movement. It also coincides with the descending trendline, adding confluence to its strength as resistance.
Next Reversal Zone ($2.75 - $2.85)
In case the price fails to reclaim the Important Zone, we could see a bearish continuation move into the next zone of interest. This is a likely reversal or reaction area based on previous demand imprints and price imbalance.
SR Flip Watch
If price breaks above the trendline and sustains above the SR Interchange Zone, this could trigger a potential bullish breakout toward the $3.20+ region (labeled as target “1”). This move would be backed by trapped sellers and liquidity above the descending structure.
📈 Potential Scenarios:
✅ Bullish Case:
Break and close above the descending trendline.
Successful retest of the Important Zone as demand.
Push toward $3.20 - $3.30 where the next supply awaits (target 1).
❌ Bearish Case:
Rejection at the Important Zone and trendline resistance.
Breakdown below $2.90 confirms bearish pressure.
Possible liquidity sweep and reaction from the Next Reversal Zone ($2.75-$2.85).
If this zone fails to hold, continuation toward lower zones becomes likely.
🧠 MMC Perspective:
From a Mirror Market Concepts (MMC) standpoint, the market is currently at a reflection point where a decision between bulls and bears is about to play out. The clean diagonal structure plus clear horizontal liquidity pockets makes this setup ideal for anticipating manipulation traps and smart money moves.
XRP - FUTURES SIGNALFUTURES SIGNAL
Coin: XRP
Direction: LONG
🟢Input range: 2,9358-2,9219
✔️ТР: 3,0116/3,0606/3,1223
❌SL: 2,8893
We try to carefully open a long position from the order block after the structure is broken on the 15-minute time frame. We enter at a reduced risk
