700% XRP Trade — The Exact Strategy I UsedThe XRP Trade That Made 700% — Full ICT Breakdown!
In this video, I break down my 700% XRP trade that I called out on the channel — exactly how I entered, why I entered, and how I managed the position.
I also explain why you don’t need to overcomplicate trading by drilling down to the 15-minute or 5-minute charts — sometimes, the cleanest ICT setups are right on the higher timeframes.
If you’ve been struggling to find consistency, this video will show you how powerful HTF liquidity plays can be when combined with patience and clear structure.
📈 Covered in the video:
Full breakdown of my XRP 700% trade
The exact HTF setup I used
How I manage risk and secure profits
Why ICT trading doesn’t need to be complicated
Trade ideas

XRP still RANGING.Waiting patiently for confirmation as XRP still consolidating. Knowledge, Risk Management and Psychology are keys to being a consistent profitable trader.

Winter Is ComingCan you feel the chill in the market?
Charts look silent, but deep down, something massive is moving.
Winter is coming and only the prepared will survive.
Hello✌️
Spend 2 minutes ⏰ reading this educational material.
🎯 Analytical Insight on Ripple:
XRP is testing a strong support while moving on the descending channel. A confirmed breakout with solid volume could drive a 20% rally, targeting 2.90$. 📊🚀
Now , let's dive into the educational section,
🌐 Signs of the Coming Winter
Every crypto cycle has its cold season the phase when volumes dry up, fear rises, and confidence slowly fades. Experienced traders spot the signs before the crowd. One of the best ways to detect this shift on TradingView is through the Volume Profile. It reveals where most trading activity has occurred and how liquidity is shifting.
When the market starts losing momentum, volume drops near resistance zones. Combine this with RSI, and the picture gets clearer: if RSI floats between 40 and 60 for too long without breaking higher, buyers are losing strength. That’s usually when the air turns cold.
🧭 TradingView Tools for Surviving the Winter
When markets freeze, precision becomes survival. The combination of the 200-Day Moving Average and the Ichimoku Cloud works like a compass in the storm. If price stays below the MA200 and inside the Ichimoku Cloud, the trend is still in the bearish zone.
Use TradingView’s Alert System to set notifications at major support and resistance levels. This way, you won’t miss key moments and more importantly, your decisions won’t be emotional. Winter rewards discipline, not luck.
💭 The Trader’s Mind in Cold Markets
The real winter starts in the trader’s mind. When fear dominates, many fall into Paralysis by Analysis endless studying, no action.
Keep a Trading Journal, plan your scenarios before they happen, and define your stop-loss tolerance. Having pre-written plans transforms hesitation into confidence. Winter isn’t the time to doubt yourself it’s the time to stay systematic.
🧊 The Role of Whales in Shifting Seasons
Whales always sense the change of season first. When large on-chain transactions increase, something big is brewing.
By monitoring On-Chain Indicators in TradingView, you can see if capital is flowing into or out of wallets.
But remember: this data isn’t an instant buy or sell signal it’s a quiet warning. Whales move in silence, and only those listening closely catch the shift before it’s visible on the charts.
🕯️ After Every Winter, a Dawn Arrives
No bear market lasts forever. After every decline, there’s a point where sellers get exhausted that’s when smart money starts accumulating.
Using Dollar Cost Averaging (DCA) during the cold phase builds powerful long-term positions. Winter is not the time to run; it’s the time to build.
🧩“Winter Is Coming”
defines the psychology of every bear market. It’s the reminder that downturns are natural, that every bullish phase ends with exhaustion, and that the real professionals are those who prepare when others celebrate.
The “winter” of the crypto market symbolizes declining liquidity, fading momentum, and emotional fatigue. Surviving it requires discipline, patience, and smart use of tools like TradingView’s Volume Profile, RSI, and Alerts.
In both markets and life, winter always comes but for those who plan ahead, it’s not the end. It’s the beginning of the next opportunity cycle.
Always analyze indicators before entering a trade – never let emotions dictate your actions.
Set stop-losses and manage risk – protecting capital is more important than short-term gains.
✨ Need a little love!
We pour love into every post your support keeps us inspired! 💛 Don’t be shy, we’d love to hear from you on comments. Big thanks, Mad Whale 🐋
📜Please make sure to do your own research before investing, and review the disclaimer provided at the end of each post

XRP Recovery Continues — Key Zone 2.32–2.36Over the past 4 days, XRP has shown a steady recovery. At the moment, the price is sitting at the weekly pivot point. We may still see a breakout and a bounce from the 2.32–2.36 range.
If, after breaking the pivot point, the price fails to quickly recover above it, there’s a high probability of continued downward movement toward 1.9. For now, the main scenario remains bullish — aiming to update the A high and approach the 2.86 level.

[SeoVereign] RIPPLE BEARISH Outlook – October 21, 2025Hello everyone,
This idea is connected to the one shared on the 19th.
I am still holding the short position that was entered based on the October 19 idea, and since some of the underlying reasons have been slightly revised, I’m sharing this as an additional update.
Today, as of October 21, I would like to present my bearish (short) outlook on XRP.
Basis — BEARISH BAT PATTERN / BEARISH 1.13 SHARK
XRP is currently positioned in a zone where both the Bearish Bat Pattern and the Bearish 1.13 Shark Pattern have been completed.
Both of these are classic bearish reversal structures that typically appear in upper regions,
and after the price reached the PRZ (Potential Reversal Zone), it began to lose upward momentum and is now attempting a downward reversal.
In particular, the endpoint (D point) of the 1.13 Shark Pattern almost perfectly aligns with the PRZ of the Bat Pattern,
and this structural confluence between patterns generally acts as a strong indication of a potential bearish reversal.
Therefore, the current zone is interpreted as a sell-dominant region where a reversal from the overbought upper area is highly likely.
Accordingly, I set the average target price around 2.2209 USDT.
Depending on future chart movements,
I will provide further updates and position management details.
Thank you.

xrp 1hr long setup xrp currently looks good on higher timeframe ,
we have currently taken out some IRL , making us , look for longs now ,
entry : 2.4598
stop : 2.4242
tp: 2.5
r:r looks good too

xrp 20 oct 2025 analysisif today 20 oct 2025 daily close we can stand the price above 2.45 , possibly we can continue rally up

XRP Short to $2.25 - $2.05Currently shorting 50,000 XRP targeting $2.25, then $2.05 based on rejection of a key level and validation of golden fibs on higher and lower time frame pivots.
Note: I NEVER trade XRP I hold. I just trade short term volatility via derivatives and w/ leverage to increase my XRP position.

[SeoVereign] RIPPLE BEARISH Outlook – October 18, 2025Today, as of October 18, I would like to share my bearish outlook on Ripple.
This analysis is based on two main factors.
First — Bearish Bat Pattern
Currently, Ripple has entered the PRZ (Potential Reversal Zone) of the BAT pattern.
This zone is typically interpreted as a classic reversal point
where selling pressure begins to emerge after an excessively extended upward trend.
In particular, a clear slowdown in buying momentum is visible on short-term charts,
indicating a high likelihood of a short-term bearish reversal.
Second — Bearish 1.13 Shark Pattern
The 1.13 extension zone of this pattern is generally regarded
as the completion phase of an upward wave and a region with a high risk of reversal.
Currently, Ripple is approaching this area,
forming a structure that technically suggests an entry into an overextended zone
followed by a potential correction.
Accordingly, the average target price is set around 2.2240 USDT.
Depending on the future movement of the chart,
I will continue to provide detailed updates regarding
position management and any changes to this outlook.
Thank you.

Ripple (XRP): Looking For Market Structure BreakBuyers are starting to show small dominance after the breakdown, which could easily turn into a decent market structure break if momentum continues. For now, this looks like a clean recovery phase — if buyers manage to secure this zone, we’ll be looking for continuation toward the upper targets.
Swallow Academy

XRP – Going Long Against the CrowdJust discovered that 96% of traders are short on XRP, which instantly caught my attention. When sentiment is this lopsided, I start thinking like a contrarian. Price is sitting in a key zone, and I’m using my Fibonacci Extension Tool to project upside targets.

Head & Shoulders XRP Potential early-stage Head and Shoulders pattern forming on XRP. Here’s the breakdown:
Structure
Left Shoulder: Formed around October 12–13, where price peaked near 2.55 before pulling back.
Head: Formed around October 14 with a higher peak near 2.62, followed by a sharp drop.
Right Shoulder: Currently developing around October 15, topping near 2.47 before showing signs of exhaustion.

XRP. SHORT TARGET 1$XRP sell target 🎯 1$ if you believe or Not. According to my technically Analysis of 7+ yea experience.

$XRP Gearing for $5 Move The price of CRYPTOCAP:XRP is down 0.21% today however, should the asset break the ceiling of the symmetrical triangle, the $5 resistant seems feasible with investors and VC's migrating to utility tokens positioning for the so-called "Uptober".
Albeit all the bullish thesis, the Open Interest of CRYPTOCAP:XRP on all exchanges is down 2.15% losing roughly $1.3B.

The Comeback Urge - When a Loss Feels PersonalNOTE – This is a post on mindset and emotion. It is not a trade idea or strategy designed to make you money. My intention is to help you preserve your capital, focus, and composure so you can trade your own system with clarity and confidence.
We saw some very deep sell offs towards the end of last week.
Imagine this if you will.
You’ve just taken a loss.
This one is not catastrophic, but it stings.
You replay it in your head.
What you could’ve done differently.
Where you should’ve cut.
What you should’ve seen.
And before the dust even settles, there’s an urge .
To get back in.
To “come back strong.”
To show the market and yourself that you’ve still got it.
At first, it feels like determination.
But look closer.
That energy coursing through your body isn’t calm focus.
It’s agitation.
Your jaw tightens.
Your breath shortens.
Your shoulders inch forward toward the screen.
Your system has just taken a hit not just financially, but emotionally.
Your identity as a capable, disciplined trader feels threatened.
And the impulse to trade again isn’t about opportunity.
It’s about redemption.
You’re not trying to win the market back.
You’re trying to win yourself back.
What’s really happening:
After a loss, your mind scrambles to restore equilibrium.
It wants to prove you’re still competent, still in control.
But trading from that place rarely ends well
Because the next trade becomes about repairing ego, not executing process.
It’s subtle, but powerful:
You’re no longer trading the chart.
You’re trading your self-image .
How to shift it:
Pause.
Acknowledge the emotional hit - not with judgment, but awareness.
Let the nervous energy move through your system without acting on it.
Remind yourself: “This is biology, not skill decay.”
You haven’t lost your edge, you’ve just been knocked off-center.
When you can sit in that discomfort without needing to erase it
That’s when emotional maturity starts replacing emotional reactivity.
And that’s not just psychology - it’s edge .
Because trading well doesn’t just depend on your system. It depends on your state .
Ask yourself:
When I rush to make it back,
What part of me am I really trying to fix?
The moment you can see that the need to prove, to redeem, to make it right is coming from ‘make back’
You stop trading from the wound and start trading from awareness.
And that’s where consistent performance begins
If this resonated, please check out my post on FOMO. H'ere's the link:

XRP Accumulation Signals Potential Breakout AheadXRP has been consolidating within a tight range on the daily chart, showing little directional movement over the past few sessions. Despite this flat price action, the Chaikin Money Flow (CMF) indicator has been trending higher, suggesting that underlying demand is quietly building.
Typically, a CMF reading above the zero line indicates stronger buying pressure and capital inflows, while readings below it point to selling and distribution. In XRP’s case, the indicator’s steady rise amid stagnant price action hints at accumulation among traders.
This divergence between volume-based momentum and price movement could foreshadow an impending breakout. If the current accumulation continues, XRP may soon attempt to push above its resistance zone and shift into a new bullish phase.

XRPUSDT — consolidation before the next impulseOn the 1H chart, XRPUSDT is consolidating after a short pullback, forming a flag pattern above the 2.45 support area. Despite a few false breaks, buyers continue to defend the trendline, signaling demand absorption.
The 2.45–2.52 range remains pivotal. A breakout with confirmation could open the way toward 2.63 (Target 1) and 2.82 (Target 2) — the next supply zones. As long as the higher-low structure holds, the bullish scenario remains intact.
Fundamentally, XRP still shows resilience amid the broader altcoin weakness. Ripple’s ongoing expansion in cross-border payments and hopes for a clearer regulatory framework in the U.S. support investor confidence.
This is a classic accumulation phase — expectations may diverge from reality, but that’s where strong trends are born. Keep emotions aside and wait for a clean breakout signal.

DeGRAM | XRPUSD protected the support line📊 Technical Analysis
● XRP/USD defended the 2.35 support zone after a false breakdown, forming a base along dynamic support. The price structure suggests consolidation within a minor channel, preparing for a potential rebound.
● A break above 2.65 would confirm bullish continuation toward 2.85–3.00, aligning with the dynamic resistance zone.
💡 Fundamental Analysis
● Ripple sentiment improves as market optimism returns following SEC-related clarity and rising transaction volumes.
✨ Summary
● Long bias above 2.35; targets 2.85–3.00. Technical base formation and renewed market confidence support medium-term recovery.
-------------------
Share your opinion in the comments and support the idea with a like. Thanks for your support!

XRPUSDT (1H) chart, here’s a full technical read:XRPUSDT (1H) chart, here’s a full technical read:
---
🔍 Chart Observations
Current price: around $2.50
The price is trading above an ascending trendline, showing bullish structure.
It’s sitting on top of the Ichimoku Cloud, suggesting ongoing bullish momentum.
Two target zones are already drawn on my chart:
The first target around $2.65
The second (main) target near $2.85
The support zone (red box below) is around $2.42–2.45
---
🎯 Target Levels
Based on my chart and price action:
1. Target 1: $2.65 → previous resistance area (first TP / partial take-profit zone)
2. Target 2: $2.83–2.85 → main target, aligns with strong resistance from earlier breakdown level
---
🛑 Stop-Loss Suggestion
Below the rising trendline or the Ichimoku cloud: around $2.42
(A clean break below that invalidates the bullish setup.)
---
⚖ Trade Plan Summary
Type Entry Stop Target 1 Target 2 Risk:Reward
Long $2.50–2.52 $2.42 $2.65 $2.85 ~1:2.5–1:3
---
📈 Summary:
Trend = Bullish (supported by Kumo + trendline)
Entry = $2.50–2.52
Target 1 = $2.65
Target 2 = $2.85
Stop = $2.42

XRPUSDT the crazy and that far 1.5$ support touch gain coming Wooow the news was for sure crazy and soon i think we can expect come back because what just happen was not simple dump news and i think this was that dump and fuel for future crazy bull candles which soon will cook on most of the chart now i am expecting also at least 4$.
Notice: my personal view about that red reject candle in market the news did dump price but now one expect dump like that and i think this was market manipulation before something big which is coming and was cooking and this liquidation was needed to hunt and kick all traders with leverage even those smart one with low leverage on alts.
DISCLAIMER: ((trade based on your own decision))
<<press like👍 if you enjoy💚

XRP Selling Hits 3 Year High As Whales Dump $5 Billion In 4 DaysAt the time of writing, XRP trades at $2.44, hovering just below the $2.45 support level. If bearish momentum persists and investor confidence weakens further, the altcoin could slide to $2.35 or even $2.27 in the coming days.
This would make recovery increasingly challenging for XRP, which needs to climb back toward $2.85 to reclaim its recent losses. Sustained selling activity, particularly from large holders, could delay this process and push prices lower.
However, if selling pressure eases and investors begin accumulating once again, XRP could rebound. A push above $2.54 and $2.64 could pave the way toward $2.75, signaling renewed market optimism and invalidating the bearish outlook.

Xrp buy 14Oct25I marked the midnight opening price of Monday October 13th and 1800 of the same day then i marked the opening price of Tuesday the 14th of October and looked where prices was in relevance to these opens, it was lower than all three opening prices and i sought after the nearest demand factor price could've been reaching into and there is what seems to be a 1h fvg that London session manipulated into and is expected to reject and go for at least 2.634

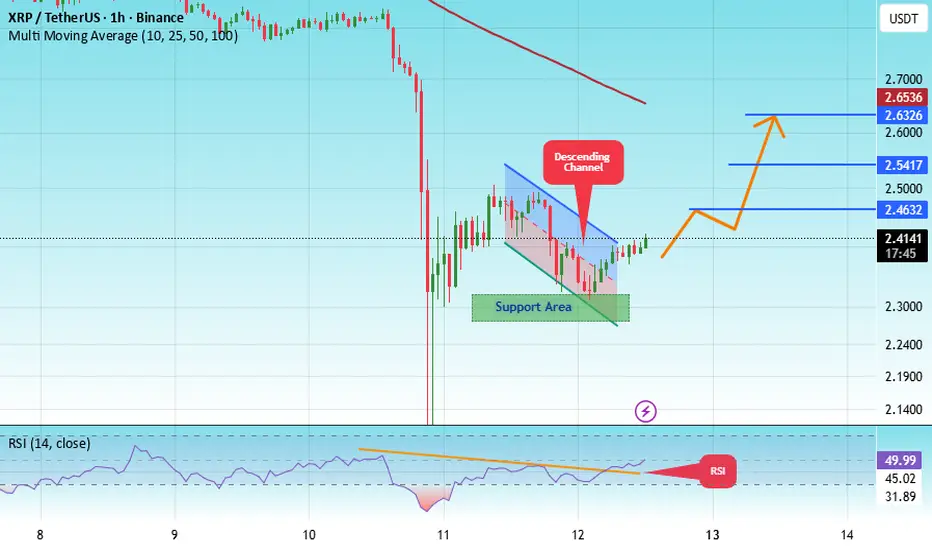
#XRP/USDT long idea/classic pattern#XRP
The price is moving within a descending channel on the 1-hour frame, adhering well to it, and is heading for a strong breakout and retest.
We have a bearish trend on the RSI indicator that is about to be broken and retested, which supports the upward breakout.
There is a major support area in green at 2.30, representing a strong support point.
We are heading for consolidation above the 100 moving average.
Entry price: 2.41
First target: 2.46
Second target: 2.54
Third target: 2.63
Don't forget a simple matter: capital management.
When you reach the first target, save some money and then change your stop-loss order to an entry order.
For inquiries, please leave a comment.
Thank you.