Did BTC Just Confirm the Move I’ve Been Warning AboutIn the last few videos, we called it perfectly — Bitcoin took out its all-time high, swept the previous week’s high, and now things are getting very interesting.
This move was expected, but what happens next could change everything…
In this video, I break down:
BTC structure and why this next phase is critical
Total Market Cap and what it’s telling us about overall sentiment
ETH showing signs of weakness
My XRP short still running strong (now +180%)
How this setup could lead to the next major move across the crypto market
We might still see one more push higher, but the bigger picture hasn’t changed — patience, risk management, and understanding structure are everything right now.
As always, this isn’t financial advice — it’s about learning to see the market for what it really is, not what we want it to be.
Trade ideas

XRP Holds Strong Support – Possible Rebound AheadXRP Holds Strong Support – Possible Rebound Ahead
XRP is currently testing a major support zone around 2.70, which has already held strong several times in the past (as shown by the previous reactions in early September and late September).
As long as the price stays above this support, there’s a good chance for a bullish rebound.
If buyers step in, XRP could start moving higher toward the next resistance levels.
Key Targets:
2.97
3.13
3.30
For now, the support zone remains key, and the market needs to confirm a rebound before a stronger move begins. Considering that BTC can rise further, the chances of the next upward move may increase further.
You may find more details in the chart!
Thank you and Good Luck!
❤️PS: Please support with a like or comment if you find this analysis useful for your trading day❤️

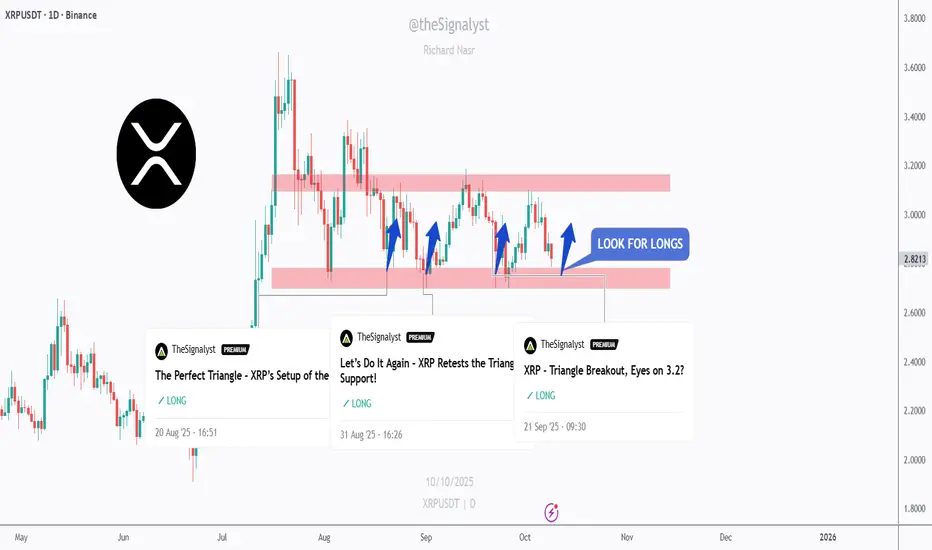
$XRP – Let’s Do It Again!!XRP is once again retesting its daily support zone around $2.60–$2.80, the same level that triggered multiple bullish impulses in recent months.
As long as this red support zone holds, I’ll keep looking for long setups targeting the $3.10–$3.20 supply area.
A daily close below $2.60 would invalidate the setup and shift focus toward the $2.30 support before any potential rebound.
It’s the same play, same level, and the same structure. Let’s see if XRP delivers again! 💪
⚠️ Disclaimer: This is not financial advice. Always do your own research and manage risk properly.
📚 Stick to your trading plan regarding entries, risk, and management.
Good luck! 🍀
All Strategies Are Good; If Managed Properly!
~Richard Nasr
XRP Analysis🚨 CRYPTOCAP:XRP Analysis 🚨
There are equal lows (DOL) sitting near the previous week’s low — liquidity waiting to be swept 👀
📉 I’m expecting a sweep there, with two bullish Order Blocks resting below.
Will wait for confirmation to long once price taps into those OBs✅

XRP Update📊 CRYPTOCAP:XRP Update
CRYPTOCAP:XRP is testing the red resistance zone 🔴
If it breaks out, the first target will be the green line level 🟢

A Massive Altcoin Explosion Is ComingAltcoins are on the verge of a huge surge, and market moves will be fast.
If you want to catch this opportunity before everyone else, this guide is for you.
The tools and strategies below will help you make smarter trading decisions.
Hello✌️
Spend 2 minutes ⏰ reading this educational material.
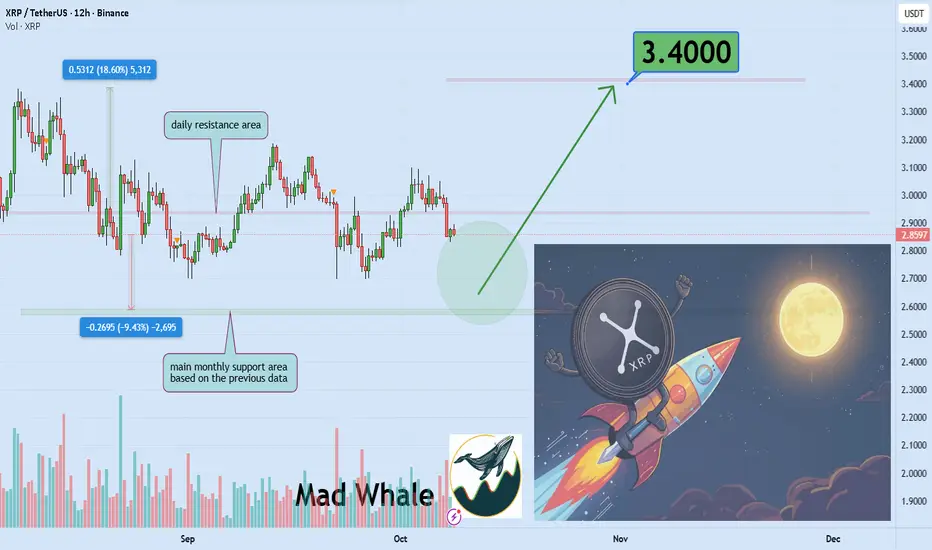
🎯 Analytical Insight on Ripple:
BINANCE:XRPUSDT is approaching a critical monthly support zone, backed by strong market volume. If this level holds, XRP could potentially rally 18% toward the $3.40 target, signaling renewed bullish momentum. 📈🚀
Now , let's dive into the educational section,
🔥 Explosive Altcoin Trends
Altcoin trading volumes have spiked unusually high.
High volumes often signal upcoming explosive moves.
Fear and greed play a central role in rapid price changes.
FOMO drives impulsive buying and fast market waves.
Whale movements can steer the market in their favor.
Short squeezes are ready to trigger in some altcoins.
💹 Market Psychology
Collective trader behavior moves prices unexpectedly.
Spotting areas where most traders are emotionally influenced is key.
Fear leads to panic selling, greed to impulsive buying.
Professional traders use market psychology to anticipate moves.
Understanding this psychology helps prevent major mistakes.
📈 Profitable Opportunities
Strong support zones highlight safe entry points.
Combining technical analysis with indicators improves decision accuracy.
Staggered entries and risk management reduce psychological pressure.
Short-term profit targets increase the chance to capitalize quickly.
Smaller altcoins can also create explosive waves.
Checking potential breakout zones before entry is essential.
🛠 TradingView Tools & Indicators
Volume Profile
Shows where liquidity is concentrated.
Helps identify strong support and resistance areas.
RSI
Highlights overbought and oversold conditions.
Signals the right time to enter or exit trades.
MACD
Indicates main trends and potential reversals.
Combining these three tools makes your analysis professional and reliable.
Even beginners can make better decisions by following these indicators.
Advanced traders can improve precision using multiple timeframes.
📝 Summary
Altcoins are ready to surge, and market psychology is the key.
Using TradingView tools and managing emotions is the best strategy.
Smart entry and risk management prepare you to seize explosive opportunities.
💡Key Trading Recommendations
Check trading volumes and potential breakout zones before entering.
Control your emotions and avoid impulsive decisions.
Use multiple indicators together to anticipate market moves.
🌟 Golden Opportunity to Level Up
Continuous practice with indicators and market psychology prepares you for explosive altcoin waves.
✨ Need a little love!
We pour love into every post your support keeps us inspired! 💛 Don’t be shy, we’d love to hear from you on comments. Big thanks, Mad Whale 🐋
📜Please make sure to do your own research before investing, and review the disclaimer provided at the end of each post
Beyond the Chart - XRP AltCoin Market Analysis 🚀 BINANCE:XRPUSDT XRP/USD AltCoin Market 🚀
XRP stuck between ⚙️ Accumulation ($2.80–$2.85) and 💰 Distribution ($3.00–$3.10) zones.
Descending triangle 🔻 hinting possible breakdown if $2.80 fails — eyes on $2.65 next.
But a clean breakout + hold above $3.05 could flip bias bullish → $3.20–$3.40 🟢
🌐 Macro View:
ETF delays 🏦 + U.S. shutdown ⚠️ keep pressure on alts.
Still, crypto inflows 💸 remain strong — extreme negativity could fuel a contrarian bounce.
🎯 Setups
📈 Long: Breakout + retest above $3.05 → 🎯 $3.20 / $3.40
📉 Short: Breakdown below $2.80 or rejection from $3.05 → 🎯 $2.70 / $2.55
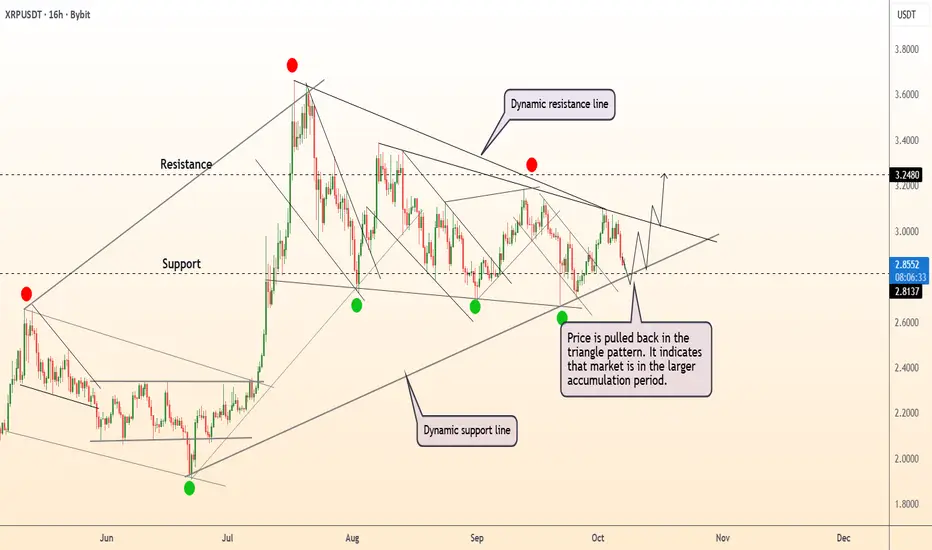
DeGRAM | XRPUSD is testing the support level📊 Technical Analysis
● XRP/USD is consolidating within a symmetrical triangle, showing a sequence of higher lows near the dynamic support line — a sign of steady accumulation. A breakout above $2.85–$2.90 would confirm bullish continuation toward the $3.25 resistance.
● The overall structure indicates a contracting phase within a larger bullish setup, with price respecting the long-term rising trendline since May.
💡 Fundamental Analysis
● Ripple’s ongoing expansion into cross-border settlements and improving market sentiment for altcoins support accumulation before potential breakout.
✨ Summary
● Accumulation inside triangle; breakout above $2.90 could target $3.25. Structure and fundamentals favor mid-term bullish momentum.
-------------------
Share your opinion in the comments and support the idea with a like. Thanks for your support!
Is BTC going to nuke?!Once again, the analysis played out perfectly — Bitcoin took out its all-time high, swept the previous week’s high, and now we could be setting up for a major drop.
In this video, I break down:
- Why I believe BTC could nuke from here
- The possibility of one last push up toward 128K before the drop
- ETH structure showing clear signs of weakness
- Total Market Cap forecast
- What this means for ALTs
- My XRP short still running — currently +140%
We could get one more fake move to the upside, but overall, I’m preparing for what could be a major correction. Stay patient and don’t get trapped chasing green candles.
#Crypto #Bitcoin #BTC #ETH #XRP #CryptoMarketUpdate #ICTTrading #Altcoins #CryptoAnalysis #BitcoinCrash

Buy XRPUSDT NowThe pair XRPUSDT has moved to a key zone and it is aligned with my buy idea. I am sure XRP will rise to $3.1500 soon.

XRPUSDT Flow Map| Price In Bearish SentimentHi there,
XRPUSDT is bearish on the H1 timeframe. The current price is reacting bearishly against the resistance line at 2.9929, with strong bearish pressure at the 3.0102 resistance line. The price has reached the H4 trendline and is breaking it.
The trendline is supported by the H4 support line, but it will not hold due to the bearish high on September 24. The break of the trendline will trigger a move down to the 2.9029 target area and extend to the open area at 2.8500, driven by the dominant bearish pressure from the H4 bearish trendline.
Additionally, the RSI is in a bearish zone at 39.47, below its EMA, which is also decisively bearish at 48.13.
Happy Trading,
K.
_
Not trading advice

XRP - 20% move is COMING!! BIG OI rise!!XRP - 20% move is COMING!! BIG OI rise!!
open interest increased by 154m Xrp coins
many times fater such thing price did significant move
in a case of break donw it could reach 2.4

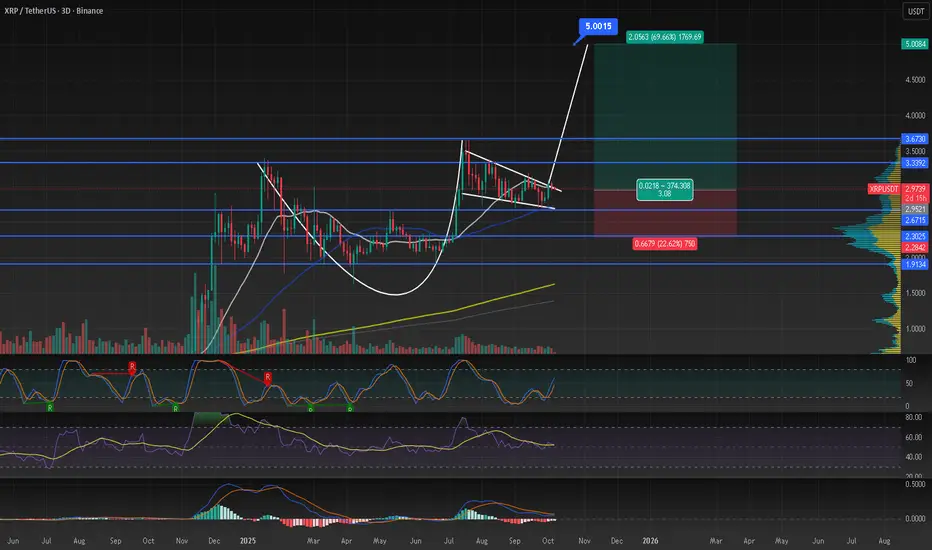
xrp cup and handle to $5cup and handle on the 3d tf
trying to break out the falling wedge
rsi is curving up
as long we dont lose 2.6 we could continue to the upside
lets see, time will tell
I am long and you?
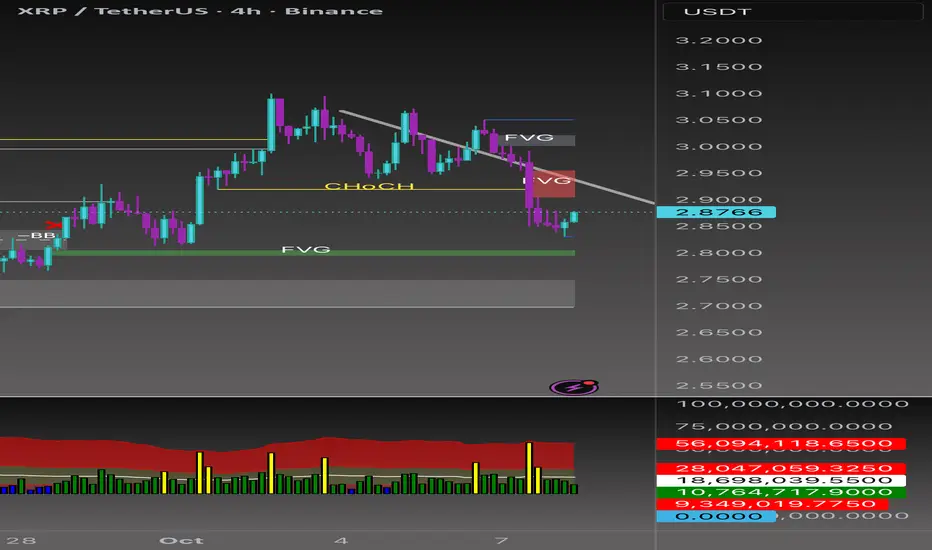
Xrp/Usdt - Bullish Reversal From Support ZoneXRP is currently trading within a well-defined support zone, showing potential signs of a bullish reversal after multiple structure shifts (CHoCH) indicating seller exhaustion. Price tapped into the support area with a rejection wick, suggesting strong buyer interest.
The entry zone is highlighted near the support, aligning with liquidity sweep and a possible accumulation phase. A clean break of internal structure toward the upside would confirm bullish momentum.
As buyers gain control, the market is expected to form a higher-low structure before pushing toward the target zone, potentially reclaiming previous highs. The overall setup favors a buy scenario, with confirmation upon sustained bullish candles above minor resistance.
Key Points:
• Timeframe: 15M
• Zone: Support Rejection / Liquidity Sweep
• Entry: Near support confirmation
• Bias: Bullish Reversal
• Target: Previous strong high level

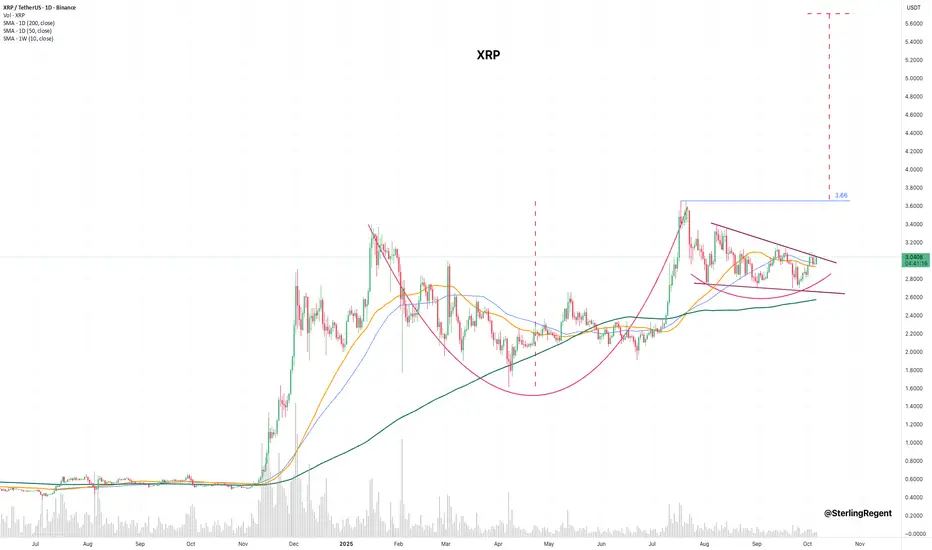
Ripple. Strong pattern at the end of its formation.This is likely a solid Cup and Handle pattern in XRP.
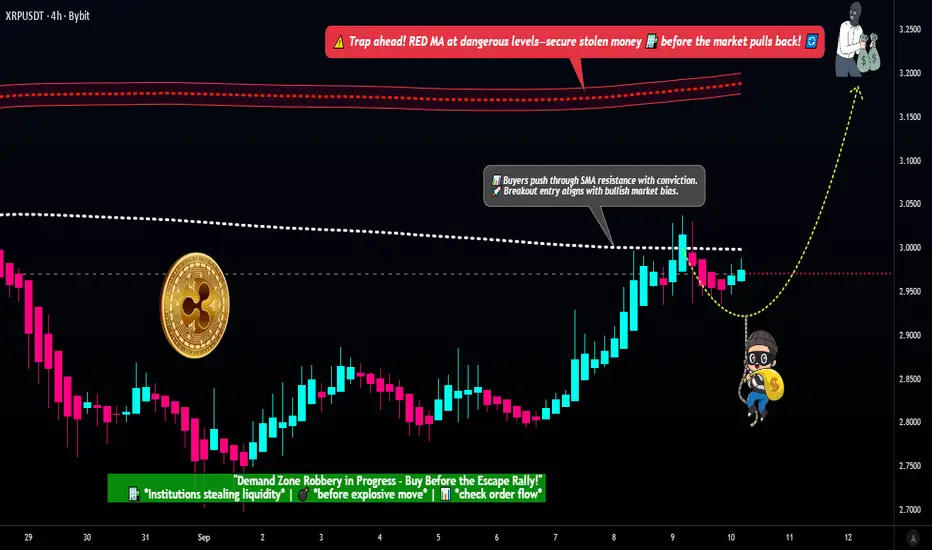
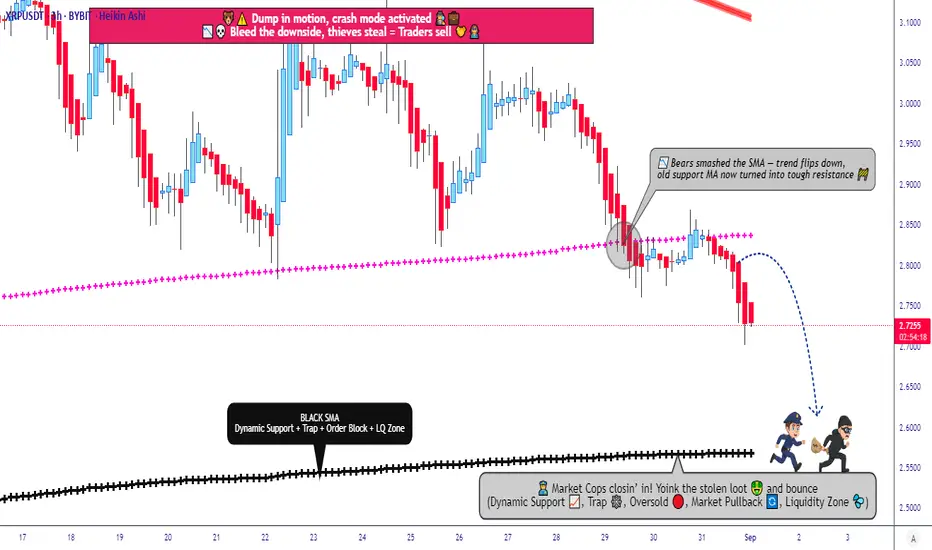
XRP/USDT — Breakout Pending! Will Thief Layers Unlock Profits?🔥 XRP/USDT "RIPPLE VS TETHER" Thief Plan (Swing/Day Trade)
🎯 Trade Setup
Plan: Bullish (Pending Order Plan)
Entry: Breakout at 328 SMA ➝ $3.0000 ⚡
🛎 Set alarm in TradingView to catch the breakout easily.
Thief Strategy = Layered Entries:
$2.9300
$2.9500
$2.9800
$3.0000
(You can increase layers based on your own strategy).
Stop Loss: Thief SL ➝ $2.8800 (after breakout). Adjust SL to your risk preference.
Target (TP): Escape before trap ➝ $3.2000.
Note: Targets & stops are flexible. Risk management is your responsibility.
📊 XRP/USDT Real-Time Data (10 Sept 2025)
Current Price: $2.97
24h Change: -1.11%
Trading Volume: High (4.4B+ XRP traded)
📈 Retail & Institutional Sentiment
Retail Sentiment (Greed 60/100)
Optimism on ETF speculation & rebound momentum.
High social/media buzz fueling greed.
Institutional Sentiment (Neutral–Cautious)
Whales accumulated 340M XRP near $3.20–$3.30 = long-term confidence.
But $1.9B liquidations since July = short-term caution.
😨 Fear & Greed Index
XRP-Specific Score: 60/100 🟢
Volatility: Greed
Volume: Greed
Whale Activity: Extreme Fear (selling pressure)
Order Book: Extreme Greed (buying demand)
Overall Crypto Market: 51/100 (Neutral)
📉 Fundamental & Macro Analysis
Fundamental Score: 7/10
✅ ETF approval speculation (Grayscale/Franklin Templeton).
✅ Ripple expanding RLUSD stablecoin into Africa.
⚠️ Risks: SEC lawsuit uncertainty + Ripple’s centralization issue.
Macro Score: 6/10
Global crypto cap $3.85T (+2.5% weekly), but under 50D avg.
U.S. inflation release = key volatility trigger this week.
🐂 Why This Thief Plan?
Bullish Case (60%)
ETF approval hype (90%+ probability).
Whale accumulation + strong institutional positioning.
Historical September strength (+87% avg. gains).
Bearish Case (40%)
Resistance failure at $3.20.
Whale sell-offs + profit taking.
Crypto-wide sentiment still neutral.
💎 Key Takeaways
High volatility expected around ETF & macro news.
Short-term breakout = fast profit chance with thief layering.
Long-term = bullish bias if ETF approvals confirmed.
👀 Related Pairs to Watch
$BTC/USD (Overall market direction)
$ETH/USD (Altcoin leader)
$SOL/USD (Key altcoin sentiment)
✨ “If you find value in my analysis, a 👍 and 🚀 boost is much appreciated — it helps me share more setups with the community!”
#XRP #Ripple #Crypto #CryptoTrading #USDT #Bitcoin #Ethereum #ThiefTrading #SwingTrade #DayTrading #Breakout #TradingView
XRP/USDT Market Report + Strategic Entry Levels🚀 XRP/USDT Market Report & Layered Trading Plan (Day/Scalping Trade) 📊
Current Price Snapshot 💰
XRP/USDT is trading at $2.81, down slightly 0.04% over the last 24 hours amid broader market consolidation. Daily volume is strong at over $3B, showing steady interest. Market cap sits around $167B, ranking XRP in the top 4 cryptocurrencies. Support has held near $2.80 over the past week, with potential for a rebound if key levels break.
📈 Trading Plan: Bearish (Layered Strategy)
Entry : Any price level; use multiple limit orders (layering strategy) for controlled exposure. Example layers: 2.7500 | 2.7700 | 2.8000 | 2.8200. Adjust layers based on your own risk/reward preference.
Stop Loss 🛑: Suggested 2.8800. Adjust according to your personal strategy.
Target 🎯: 2.5700. Use smart exits and scale out of positions based on market momentum.
✅ Layered entries help reduce risk while maximizing opportunity. Ideal for scalping/day trades.
😊 Investor Mood & Sentiment
Overall Bullishness: 65%
Retail Traders: 70% bullish – excitement over payments utility, ETF expectations, partnerships.
Institutional Traders: 55% bullish – whale accumulation + cautious optimism, with some profit-taking.
Fear & Greed Index ⚖️: 48 (Neutral) – market steady, volatility at 4.27%. Consolidation phase ideal for strategic positioning.
🏗️ Fundamental Score: 85/100
Strengths: High adoption (300+ partners, $1.3T yearly transactions), fast XRPL settlements (3-5s), low fees, escrowed supply cap, burned fees reduce circulating supply.
Weaknesses: Competition from stablecoins like USDC could cap growth if banks shift focus.
🌍 Macro Score: 75/100
Bullish Drivers: Fed rate cuts, crypto-friendly policies, ETF approvals likely.
Challenges: Trade tensions, inflation, emerging market pressures.
Net positive: adoption in Asia/Africa outweighs headwinds for now.
🔮 Overall Market Outlook
Bullish (60% probability) 🟢 – potential to test $3.35 resistance, with $4 possible if ETF news hits.
Key Watch: Break above $3.00 confirms strength. Buy dips near $2.72 support for upside.
🗂 Related Pairs to Monitor
ETH/USDT | BTC/USDT | LTC/USDT | ADA/USDT
#XRPUSDT #Ripple #CryptoTrading #Scalping #DayTrade #LayeredStrategy #CryptoAnalysis #MarketReport #CryptoSentiment
XRP Price Fails Breakout Following $950 Million SellingAt the time of writing, XRP is trading at $2.96, maintaining its position just above the $2.94 support level. The altcoin was poised to break out of its descending wedge pattern, but that attempt has failed for now, suggesting further weakness.
If the selling trend persists, XRP could extend its decline. The token risks dropping to $2.85 or lower toward $2.75, testing the lower boundary of the wedge pattern. Such a fall would confirm bearish dominance.
However, if investors regain confidence and halt the ongoing sell-off, XRP could stage a recovery. A successful rebound past $3.02 may open the path to $3.12 or higher, potentially invalidating the bearish outlook.


#XRP/USDT looking extremely bullish#XRP
The price is moving within a descending channel on the 1-hour frame, adhering well to it, and is heading for a strong breakout and retest.
We have a bearish trend on the RSI indicator that is about to be broken and retested, which supports the upward breakout.
There is a major support area in green at 2.93, representing a strong support point.
We are heading for consolidation above the 100 moving average.
Entry price: 2.96
First target: 3.02
Second target: 3.06
Third target: 3.10
Don't forget a simple matter: capital management.
When you reach the first target, save some money and then change your stop-loss order to an entry order.
For inquiries, please leave a comment.
Thank you.

XRP 1H Analysis - Key Triggers Ahead☃️ Welcome to the cryptos winter , I hope you’ve started your day well.
⏰ We’re analyzing XRP on the 1-Hour timeframe .
👀 On the 1-hour timeframe, XRP recently completed a solid bullish rally, reaching resistance around $3.06, before retracing toward its local support zone near $2.94. The coin has tested its top level about three times, getting rejected each time under selling pressure. After the latest rejection and rebound from the $2.94 zone, a short-term trigger has formed around $2.98 — a breakout above this level could significantly increase the likelihood of a resistance breakout.
🧮 The RSI oscillator shows that after ranging below the 50 zone, it has now crossed above it and is heading upward. A 1-hour candle close above the trigger zone would confirm bullish momentum; otherwise, the move risks failing.
🕯 The recent candle structure on the 1-hour chart has been relatively range-bound, partly due to low market activity during holidays. However, with increasing volume and the larger size of recent bullish candles, there’s potential for stronger upward continuation.
🧠 For XRP positions, traders can consider low-risk entries once a candle closes above the marked trigger zone in this analysis. Rising volume and strong candle closures may fuel volatility and expand long opportunities.
❤️ Disclaimer : This analysis is purely based on my personal opinion and I only trade if the stated triggers are activated .

BTC Hits New ATH… But What Happens Next? (History Says This)Bitcoin has finally taken out its all-time high — exactly as predicted in my previous analysis.
Now the real question is… what happens next?
In this video, I break down what this breakout means for BTC, TOTAL, and ALTs, and why the weekly close will be critical.
Historically, every time Bitcoin takes out all-time highs, we see strong bearish pressure shortly after — and this time might be no different.
Here’s what I cover:
- Bitcoin hits a new all-time high: what’s next?
- Historical patterns after ATHs
- What to expect from the weekly close
- XRP short update (still running)
- My BTC targets and what I’m watching next
- Altcoin rally incoming?
Stay patient, stay disciplined, and remember — the market rewards those who can manage risk and read structure.
⚠️ Disclaimer: This video is for educational purposes only and does not constitute financial advice. Always do your own research before trading or investing in cryptocurrency.
#Crypto #Bitcoin #BTC #XRP #CryptoAnalysis #ICTTrading #Altcoins #CryptoMarketUpdate #BitcoinATH

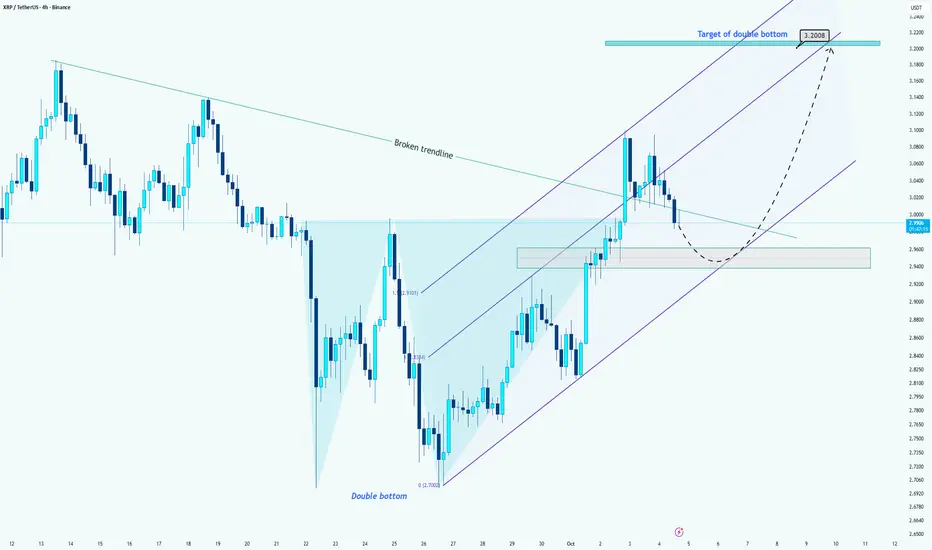
XRP/USDT –> Double Bottom Formation Confirmed!Hi guys!
After breaking above the descending trendline, XRP has confirmed a double bottom pattern around the 2.70 area.
Currently, the price is moving inside an ascending channel, but after facing resistance near 3.10, it has entered a correction phase. The 2.94–2.96 area now acts as a key support zone, aligning with both the previous neckline and the channel’s midline.
If this support holds, we can expect the price to bounce upward and resume its bullish momentum toward the 3.20 area, which represents the target of the double bottom.
However, if the 2.94 support breaks down, we might see a deeper correction toward the lower channel boundary before any continuation move.
🎯 Targets:
First target: 3.20 USDT (double bottom projection)
Extended target: 3.30 USDT (upper channel resistance)