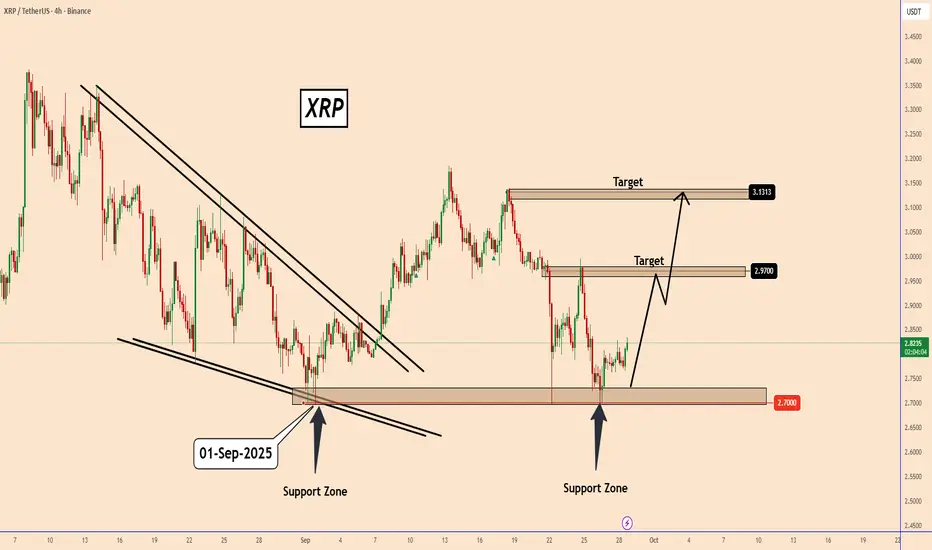
XRP: Bounce From Support Targets 3.13
XRP: Bounce From Support Targets 3.13
Price tested the support zone around 2.70 and bounced higher.
This shows buyers are stepping in to protect the level.
First target is at 2.97, where price may face resistance.
If momentum continues, the next target is around 3.13 that corresponds also to a strong structure zone again where XRP was rejected during the previous days.
As long as the price stays above the support zone, the short-term outlook remains bullish.
It is a bit risky overall considering BTC is not taking any direction yet, but as long as we can monitor the price, we should hold this zone.
You may find more details in the chart!
Thank you and Good Luck!
❤️PS: Please support with a like or comment if you find this analysis useful for your trading day❤️
Trade ideas
WHAT EVERY A HAPPY PERSON SHOULD KNOW #XRP technical analysis for **XRP/USDT** (4-hour chart)
---
## **1. General Overview**
* **Timeframe:** 4-hour (mid-term outlook)
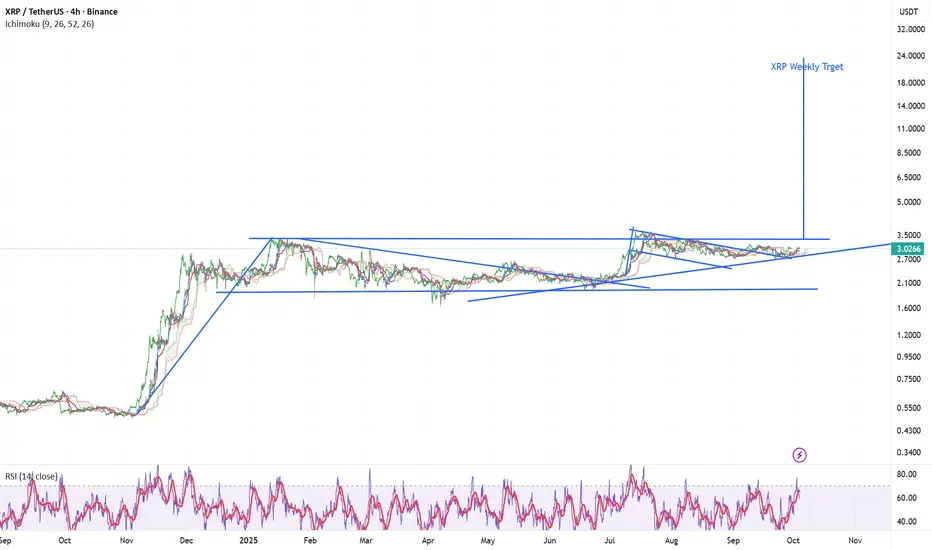
* **Current Price:** Approximately **$3.02**
* **Market Structure:** Symmetrical Triangle within a broader bullish trend (*Bullish Continuation Pattern*)
* **Projected Weekly Target:** **$18 – $24**
---
## **2. Geometric and Pattern Analysis**
### **Main Pattern:**
The recent market structure reveals a **symmetrical triangle** forming after a strong upward movement (from $0.50 to $3.50).
This consolidation represents a healthy corrective phase before potential continuation.
📏 **Measured Move Calculation (Short-Term Target):**
📈 **Medium-Term Flagpole Projection:**
Thus, short-term targets lie around **$4.3**, while the mid-term projection reaches **$6.0**.
---
## **3. Ichimoku Cloud Analysis**
| Ichimoku Component | Current Status | Interpretation |
| ----------------------- | ---------------------------- | ---------------------------- |
| **Kumo (Cloud)** | Price trades above the cloud | Strong bullish trend |
| **Tenkan-sen (blue)** | Above Kijun-sen (red) | Positive short-term momentum |
| **Kijun-sen (red)** | Gradually rising | Mid-term trend strengthening |
| **Chikou Span (green)** | Above both price and cloud | Confirms bullish structure |
| **Future Cloud** | Turning green and expanding | Continued uptrend expected |
✅ **Ichimoku Summary:**
The structure remains **bullishly aligned** across both the 4-hour and weekly timeframes, supporting trend continuation.
---
## **4. RSI (Momentum) Analysis**
* **RSI (14):** Approximately **60**
* RSI recently crossed above 60, indicating the onset of bullish momentum.
* A positive divergence is observed between price and RSI lows.
📊 **Interpretation:**
When RSI stabilizes above 60 in the 4-hour timeframe—particularly during a breakout from a symmetrical triangle—it typically precedes **30–40% medium-term rallies** in XRP’s historical data.
---
## **5. Support and Resistance Levels**
| Type | Level (USDT) | Analysis |
| ----------------------------- | ------------ | ----------------------------------- |
| **Key Support 1** | 2.70 | Triangle base + Kijun level |
| **Key Support 2** | 2.35 | Channel bottom |
| **Immediate Resistance** | 3.50 | Upper boundary of triangle |
| **Next Resistance** | 4.30 | Short-term target |
| **Medium-Term Target** | 6.00 – 6.50 | Completion of the flag pattern |
| **Long-Term (Weekly) Target** | 17 – 24 | Extension of the macro bullish wave |
---
## **6. Possible Scenarios**
| Scenario | Activation Condition | Probability | Target |
| ----------------------------- | ----------------------------------- | ----------- | --------------------- |
| **Bullish (Primary)** | Sustained close above $3.20 | 75% | $4.3 → $6.0 |
| **Neutral (Range)** | Consolidation between $2.70 – $3.20 | 20% | No clear trend |
| **Bearish (Low Probability)** | Breakdown below $2.70 | 5% | Pullback toward $2.30 |
---
## **7. Confluence Analysis**
| Indicator | Status | Implication |
| ------------ | ----------------------- | ----------------- |
| Price Action | Breakout confirmed | Bullish |
| Ichimoku | Price above cloud | Bullish |
| RSI | Above 60 | Bullish |
| Trendline | Upward slope maintained | Bullish |
| Volume | Gradually increasing | Confirms momentum |
✅ **Scientific Conclusion:**
All technical indicators and structural elements across multiple timeframes are **mutually supportive of a bullish continuation**.
---
## **8. Final Assessment**
XRP currently exhibits a **valid breakout** from a symmetrical triangle within a strong uptrend.
The scientific multi-layer analysis suggests the following:
* **Strong Support:** $2.70
* **Breakout Zone:** $3.20 – $3.50
* **Next Targets:** $4.3 → $6.0 → $8.5
* **Long-Term Projection:** $18 – $24 (consistent with weekly pattern targets)
---
WHAT EVERY HAPPY PERSON SHOULD KNOW #XRP
## 🧩 1. Chart Structure Overview
* **Timeframe:** Weekly (macro perspective)
* **Current Price:** ≈ $3.03
* **Structure Type:** Symmetrical triangle / bull pennant continuation pattern.
* **Major Breakout Zone:** Around **$3.30 – $3.50**
* **Previous Impulse:** From $0.45 → $3.50 (≈ +670%)
* **Current Phase:** Consolidation before potential breakout.
## 🧠 2. Chart Pattern Analysis (Geometric + Measured Move)
### Pattern Type:
* A **bullish pennant** formed after a large upward impulse.
* The flagpole height (approx. $3.00) gives a **measured target**:
➡️ **Scientific projection (using measured move):**
**Target Zone = $11.5 – $13.0**
## ☁️ 3. Ichimoku Cloud Analysis
| Ichimoku Component | Observation | Interpretation |
| ------------------------------------ | ----------------------------- | ------------------------------------- |
| **Kumo (Cloud)** | Price well above future cloud | Strong bullish bias |
| **Tenkan-sen (blue)** | Above Kijun-sen (red) | Short-term bullish alignment |
| **Kijun-sen (red)** | Rising gradually | Mid-term momentum improving |
| **Chikou Span (green lagging line)** | Above price and cloud | Confirms bullish structure |
| **Future Cloud** | Turning green and thickening | Long-term bullish continuation likely |
✅ **Ichimoku Summary:**
XRP remains in a **confirmed bullish environment**, with **trend continuation probable** over the next 3–6 months.
## 📈 4. RSI Analysis (Momentum Oscillator)
* **RSI (14)** ≈ 57 → Neutral-to-bullish range.
* RSI is **forming a higher low** while price consolidates → **bullish divergence**.
* Historically, XRP’s weekly RSI crossing **60–65** has signaled large impulsive waves.
📊 **Momentum interpretation:** The RSI is coiling and may soon break above 60, which typically precedes **multi-week rallies** in XRP.
---
## 🧮 5. Trendline and Support/Resistance Levels
| Type | Level (USDT) | Observation |
| ------------------------ | ------------ | ----------------------------------- |
| **Major Support** | 2.35 – 2.50 | Horizontal + Cloud base |
| **Intermediate Support** | 2.85 | Bullish trendline support |
| **Breakout Resistance** | 3.35 – 3.50 | Pennant resistance |
| **Next Resistance** | 5.20 | Historical weekly close (2021 high) |
| **Macro Target** | 11.5 – 13.0 | Based on measured flagpole |
## 🧭 6. Volume and Wave Context
* The prior uptrend shows **high volume impulse**, followed by **volume contraction** — typical of wave 2 or 4 consolidation.
* The current pennant fits the structure of **Wave 4** in Elliott Wave theory, implying the next move is **Wave 5 extension**, often equal to Wave 1 × 1.618.
🔭 7. Projection Scenarios
| Scenario | Condition | Probability | Target |
| --------------------- | ------------------------ | ----------- | ------------------- |
| **Bullish Breakout** | Weekly close above $3.50 | 70% | $5.0 → $8.0 → $12.0 |
| **Neutral Range** | Stays between $2.6–$3.3 | 20% | Accumulation phase |
| **Bearish Breakdown** | Weekly close below $2.35 | 10% | Drop to $1.80–$1.50 |
## 🧠 8. Summary (Scientific Synthesis)
* **Dominant Pattern:** Bullish pennant on weekly frame
* **Trend Strength:** Positive (confirmed by Ichimoku + RSI)
* **Key Confirmation:** Weekly candle close above **$3.50**
* **Next Resistance Targets:** $5.20 → $8.00 → $12.00
* **Stop Loss for Swing Setup:** Below $2.35
* **Risk/Reward Ratio:** ≈ 1 : 4 (excellent for mid-term)
## 📊 9. Verdict
XRP is **technically preparing for a major continuation wave**, supported by multi-layer evidence:
* Structural pennant pattern
* Ichimoku cloud breakout confirmation
* RSI momentum rebuild
* Wave geometry extension targets between **$8 – $12**
If confirmed by a **weekly close above $3.50**, it would signal the start of XRP’s **next macro impulsive wave** toward its long-term projection zone.

Price Poised for Bullish Flag Surge!$XRP/USDT chart shows an accumulation phase from April to June, followed by a breakout in July. Price is now testing a key zone, acting as support. If it holds, we could see more bullish momentum, especially with the triangle breakout. A break above 3.20 signals further upside.
If not, a retest of lower levels like the accumulation zone is possible. Watch for confirmation at this level.
DYOR, NFA

XRP BUYXRP has being moving within a bullish structure and also has a trend in trends of a inverse head & Shoulders within it.
There is also a clear retest above the diagonal resistance trend-line, so if the candle closes above the trend-line above the retest point(3.0136) then, we expect a huge move upwards all the way to that take profit which is 4.4636.
If you are an aggressive trader, you can enter now.If you are a conservative trader and need an extra confirmation, you can wait until the current candle closes and then enter then.

XRP Price Action – Accumulation Before GrowthXRP is currently navigating a phase defined by liquidity-driven swings and rapid sentiment shifts. After the market endured a heavy decline, buyers have re-emerged, showing resilience through aggressive rebounds. This behavior reflects a deeper pattern: sellers are losing efficiency in driving the market lower, while buyers are treating each dip as an opportunity to accumulate.
In the short term, the market appears to be balancing between two forces — the need for a corrective retracement to secure liquidity, and the desire of participants to push price into higher zones. This tug-of-war often results in shallow pullbacks, where temporary declines are quickly absorbed. Such behavior highlights that speculative capital is rotating back into XRP, aligning with broader risk-on sentiment across digital assets.
If this pattern holds, the near-term trajectory favors gradual expansion, with the asset likely aiming for higher valuations. However, investors should remain aware that short-term corrections are less about trend reversals and more about the mechanics of liquidity collection.

Xrp Update XRP
On Bitget, XRP’s technical summary shows a mix: Buy is slightly favored via moving averages, but oscillators are more neutral to cautious.
Barchart’s technicals indicate XRP is trading below its 20-day MA, with the 50-day MA also above price — a sign that current trend pressure is to the downside.
Investing’s XRP technicals (OKX data) provide detailed buy/sell lineups, suggesting mixed momentum depending on which indicator you lean on.
Insight: XRP is at a crossroads. It faces resistance from the MAs above, and support zones below are now more important. If XRP can muster strength and break past these averages, a push upward is possible, but a failure here may lead to more correction.

XRP OUTLOOK XRP Breaks 1hr resistance , that is a good Bullish signal to go long targeting daily order block

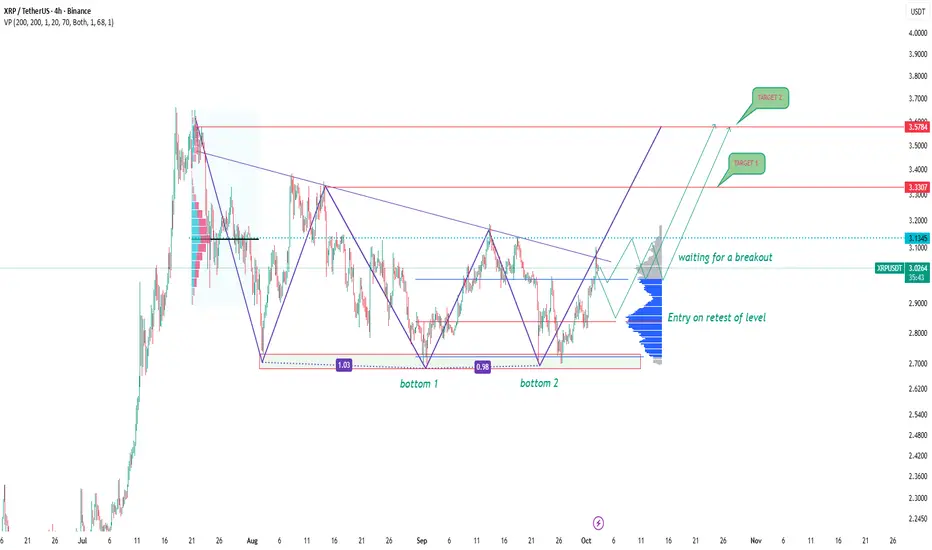
XRPUSDT: double bottom and waiting for a breakoutOn the 4H chart, XRPUSDT is shaping a double bottom around the 1.00 level, and the price is now approaching the key resistance area at 3.14–3.32. A breakout above this zone would be a strong confirmation that the bearish phase is losing momentum.
Technically, the scenario suggests a breakout above 3.14, followed by a retest, and then continuation toward 3.32 and 3.57. This fits the classic pattern where accumulation turns into momentum-driven buying.
From a fundamental perspective, XRP still draws attention thanks to Ripple’s legal battle with the SEC and the use of the token in cross-border transactions. Positive headlines can accelerate the rally, though broader crypto market corrections or regulatory pressure could put the brakes on growth.
This is exactly the kind of setup where expectations and reality may diverge. The structure looks bullish, but without a confirmed breakout, the market can easily roll back. Better to wait for confirmation and trade with discipline.
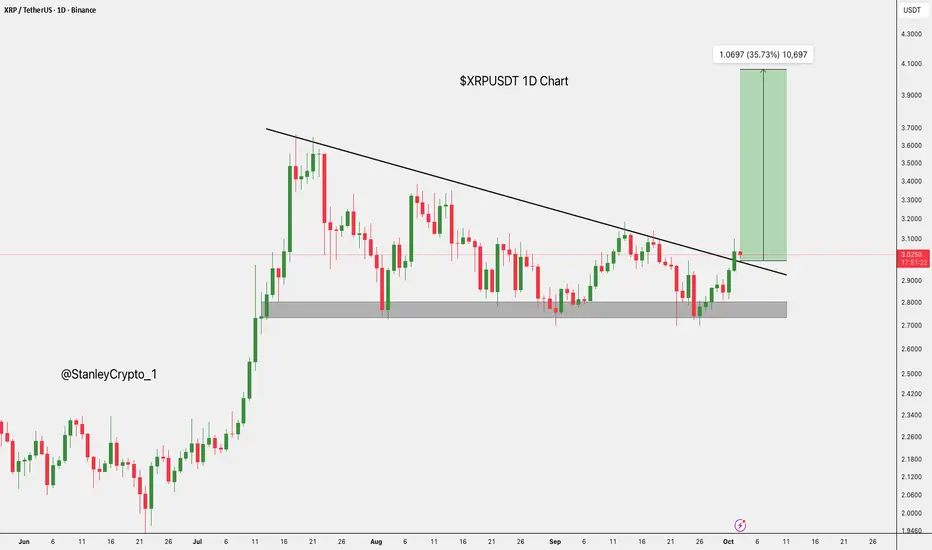
$XRP Breaks Out: 35% Upside Potential Ahead.CRYPTOCAP:XRP has broken above the downtrend, with strong support between $2.70 and $2.85.
If the breakout holds, it could target $4.10, a 35% upside.
Watch for a retest of the breakout zone to confirm further gains.
DYOR, NFA
XRP on the moon!As you can see, the chart's trendline has been broken, as indicated by the shown take profits (TPs).

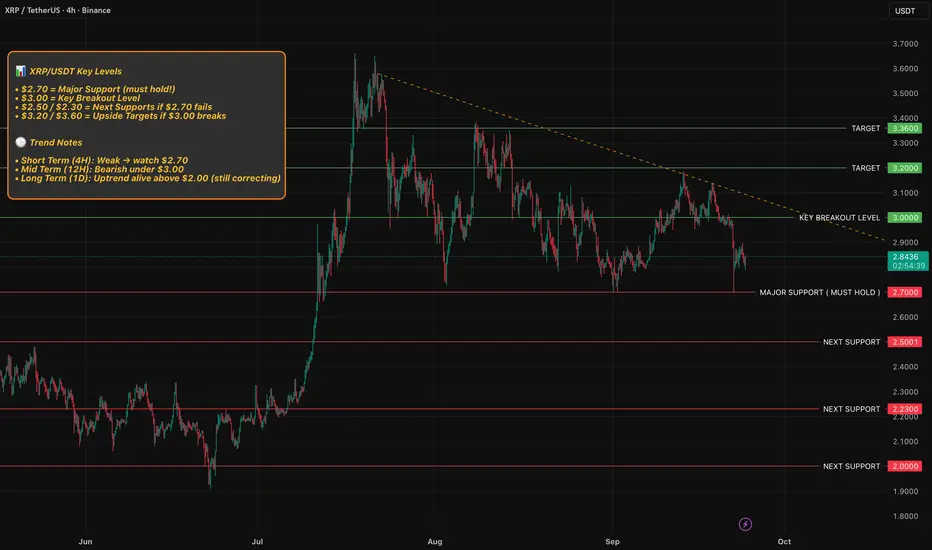
XRP is at a MAJOR decision point !
📊 XRP/USDT Key Levels
• $2.70 = Major Support (must hold!)
• $3.00 = Key Breakout Level
• $2.50 / $2.30 = Next Supports if $2.70 fails
• $3.20 / $3.60 = Upside Targets if $3.00 breaks
🕒 Trend Notes
• Short Term (4H): Weak → watch $2.70
• Mid Term (12H): Bearish under $3.00
• Long Term (1D): Uptrend alive above $2.00 (still correcting)
Thank you for reading my idea, let me know your thoughts and please support by leaving a simple comment as this helps me stay motivated and keep going.
xrp/USDT Technical Outlook📈 XRP / USDT Technical Outlook
Live & Technical Signals:
TipRanks shows XRP’s 20-day EMA and 50-day EMA above current price, giving “Sell” signals on these averages.
Barchart reports that the 5-day MA is ~ 2.891, 20-day ~ 2.945, and 50-day ~ 2.991—price is trading under those, indicating resistance overhead.
Many indicators (RSI, MACD, etc.) on Investing.com are mixed, with a neutral bias overall.
Support & Resistance Zones:
Resistance: ~$3.00 – $3.15
Support: ~$2.70 – $2.80
Below that, a drop toward ~$2.40–$2.50 is possible if support fails
Scenarios to Watch:
🔻 Bearish: A close below $2.70–$2.80 could open the path toward $2.40–$2.50
🔺 Bullish: A decisive break above $3.00–$3.15, especially with volume, could target $3.30+

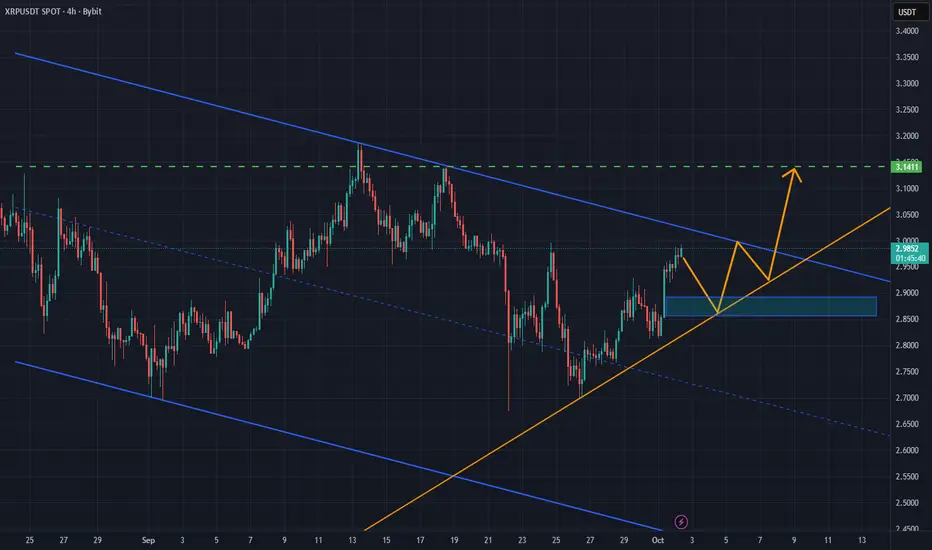
XRP/USDT: Bullish Momentum Builds After Breakout from CompressioXRP/USDT has rebounded off the 2.8765 zone, aligning with the upward trendline and breaking out of its compression structure, signaling renewed bullish momentum. The price is now pushing toward resistance near 3.15, a zone where previous tops have formed.
A sustained hold above 2.90 would reinforce the bullish outlook and support a continuation toward the resistance zone. While momentum remains constructive, the structure indicates that buyers still need confirmation through strength at higher levels.
XRP About to start a new bullish rally 👉 Today, the price broke through the key $2.93 resistance level and consolidated above it. From the current zone, I expect a new bullish trend and a breakout from the bull flag toward a 3.3$, 3.66$, 3.92$ targets

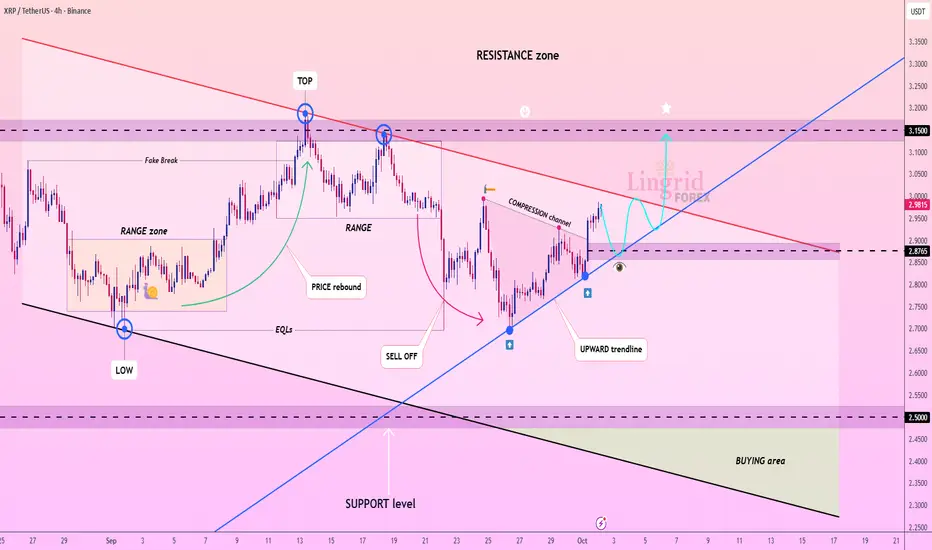
Lingrid | XRPUSDT Channel Break - Upside Momentum PotentialBINANCE:XRPUSDT has rebounded from the 2.8765 zone, aligning with the upward trendline and breaking free from compression structure. Price action now presses toward resistance with the potential to retest the 3.15 area, where prior tops have formed. A sustained hold above 2.90 would strengthen the bullish case for continuation into the resistance zone. Momentum remains constructive, but the structure shows buyers need confirmation at higher levels.
⚠️ Risks:
Rejection below 2.90 could trap longs and lead to a pullback toward 2.50.
Compression breakdown may trigger renewed bearish momentum.
Broader market weakness could cap upside despite local bullish structure.
If this idea resonates with you or you have your own opinion, traders, hit the comments. I’m excited to read your thoughts!
The Number 3 Crypto + The New Low Buying StrategyThis crypto BINANCE:XRPUSDT
is the number 3 crypto
based on the market cap.
Something happened, you see
am trying to raise capital
for my business and its not
easy because
the person helping me
has given up on me.This person
is very close to me and
has helped me with
my business education
we had a huge disagreement
some few years ago.Because
you see this friend of mine
only believes in
get rich quick schemes
honestly i was so desperate for
help back then that any online business
education program would have convinced me.
But i knew from the very start that
the chances of making it in business
especially within the next 3 months
where not possible.
Even though i kept going
same with trading when i first saw
my trading knowledge serious
it was when after i broke up with my
girlfriend.
I studied Rocket Stocks by Matthew Kratter.
Everyday for 21 days then another
14 days apart.This strategy is
the one that helped me form
the Rocket booster strategy.
So whats the point of me
telling you these stories?
Nothing..these are stories
about nothing.
Now look at this chart BINANCE:XRPUSD
You will see something
called the Bullish engulfing.
This candlestick pattern
is the perfert entry signal..
This strategy is called the
New low buying strategy.
Because its done on a reversal after
a market crash.
Rocket boost this content to learn more.
Disclaimer: Trading is risky please learn risk
management and profit taking strategies.
Also feel free to use
a simulation trading account before
you trade with real money.
[SeoVereign] RIPPLE BEARISH Outlook – October, 03 2025The basis for presenting a bearish perspective in this idea is grounded in Elliott Wave Theory.
In Elliott Wave analysis, the following representative length ratios are applied:
WAVE5 = WAVE1~3 * 0.382
WAVE.C = WAVEA * 0.618
To help you confirm these ratios more intuitively, I have plotted all the relevant sections on the chart.
Accordingly, the average target price is set around 2.855 USDT.
Additional briefings will continue to be updated in this idea as the chart develops.

Market Update: BTC, ETH, SOL & XRP OutlookIn this video, I shared an update on Bitcoin, Ethereum, Solana, and Ripple.
Bitcoin has completed all 5 upward waves, but there’s still a chance to see one more push higher. If the correction starts right now, we could see a reaction above 113K , with support expected in the 112,700–111,700 zone.
The rest of the market will mostly follow Bitcoin.
BINANCE:ETHUSDT
Ethereum has already bounced 4 times from the ascending trendline and is aiming to break the descending trendline.
BINANCE:SOLUSDT
Solana is approaching our target zone.
BINANCE:XRPUSDT
XRP has climbed back above the important 200 MA.

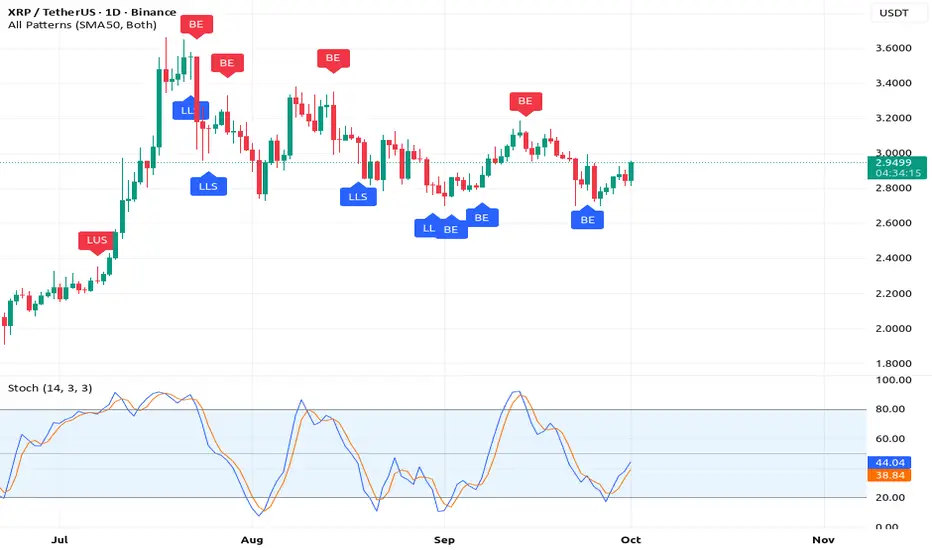
XRP Bears Dominate as Elder-Ray Index Stays NegativeOn the daily chart, XRP’s Elder-Ray Index continues to flash persistent negative readings, with the momentum indicator sitting at -0.0099. This highlights weakening bullish momentum as sellers maintain control over price action.
The Elder-Ray Index tracks the balance between buying and selling pressure by measuring Bull Power against Bear Power.
Positive values indicate bulls driving the market upward, while negative values reflect stronger bearish control.
With XRP holding below zero, current market conditions point to sustained distribution and bear dominance.

TradeCity Pro | XRP: Key Support and Resistance Zones Testing👋 Welcome to TradeCity Pro!
In this analysis, I will review the XRP coin. One of the oldest crypto projects, XRP aims to align crypto transactions with the SWIFT system. The coin has a market cap of $173 billion and is ranked 4th on CoinMarketCap.
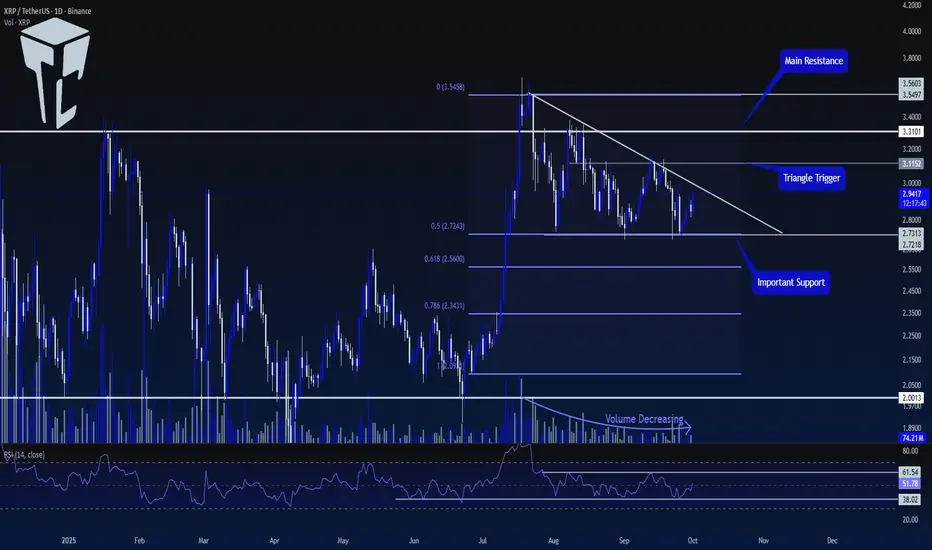
📅 Daily Timeframe
After getting support at the 2.0013 level, XRP made a bullish move up to the 3.5603 resistance. Now, it has formed a descending triangle, and the volume has been decreasing as the price moves down.
⚡️ Currently, a crucial support zone has formed at 2.7218, which overlaps with the 0.5 Fibonacci level, forming a PRZ for us.
🧩 A descending trendline has also been created, and the price has touched it several times, making lower highs.
📊 To confirm the next bullish move for this coin, the first confirmation we need is the breakout of the trendline. The trendline breakout trigger is at 3.1152.
✨ Once this level is broken, we can open a long position. This trigger is the first long position trigger and is considered risky since we haven't yet received the main confirmation for a bullish trend.
🔍 The main trigger for the start of a new bullish trend is the breakout of the 3.3101 level. Breaking this level could start a new upward move for XRP.
💥 A very important confirmation for both long and short positions on the RSI is the breakout of the range between 38.02 and 61.54.
🎲 As long as the RSI remains between these two levels, the probability of hitting stop losses is high. Therefore, for a long position, we can wait for the 61.54 level on the RSI to be broken.
🔽 For a short position, the 38.02 level on the RSI is a good momentum trigger. We can also use the 2.7218 level as a trigger, but keep in mind that the main market momentum is bullish, so this short trigger is considered risky.
📝 Final Thoughts
Stay calm, trade wisely, and let's capture the market's best opportunities!
This analysis reflects our opinions and is not financial advice.
Share your thoughts in the comments, and don’t forget to share this analysis with your friends! ❤️
XRP Swing Long Opportunity - LRKZ MODELXRP Swing Long Opportunity
📊 Market Sentiment
FED has resumed its rate-cutting cycle, starting with a 0.25% cut in September, with two more 0.25% cuts expected in the coming months. Additionally, institutional liquidity inflows have accelerated as the U.S. officially adopts crypto as part of its reserves. While inflation remains elevated, the weakening labor market is forcing the FED to ease, driving more capital into risk-on assets.
📈 Technical Analysis
Price made a new all-time high and is currently retracing before pushing higher again.
Price ran the weekly swing liquidity at $2.70 and closed above with a wick, confirming manipulation before expansion.
Price also retested the broken HTF Demand zone at $2.69, which was strong resistance previously and now acts as strong support.
These confluences strongly suggest rejection and continuation higher.
📘 Model to be used – HTF Liquidity Run into HTF Key Zone (LRKZ Model)
In this model, I first define the HTF trend. Then, I look for the most significant liquidity that lies opposite to the HTF trend (swing highs or lows). These zones often contain enough liquidity to trigger reversals or strong bounces. When price sweeps this liquidity and retests an HTF Key Zone (where strong limit orders sit), it creates a high-probability setup. Confirmation on LTF then provides the entry trigger.
📌 Game Plan
Price already closed above the $2.70 level, confirming entry. Looking for continuation higher with structured targets.
🎯 Setup Trigger
Setup is active long position valid after the daily close above $2.70.
📋 Trade Management
Stoploss: Daily close below $2.70 or hard stop at $2.50.
Targets:
TP1: $3.18
TP2: $3.37
TP3: $3.66 (ATH)
After TP1 is secured, I will move stoploss to breakeven and scale profits as price moves toward higher targets.
💬 Like, follow, and comment if this breakdown supports your trading! More setups and market insights coming soon — stay connected!
⚠️ Disclaimer: This content is for informational and educational purposes only and does not constitute financial, investment, or trading advice. Always DYOR before making any financial decisions.

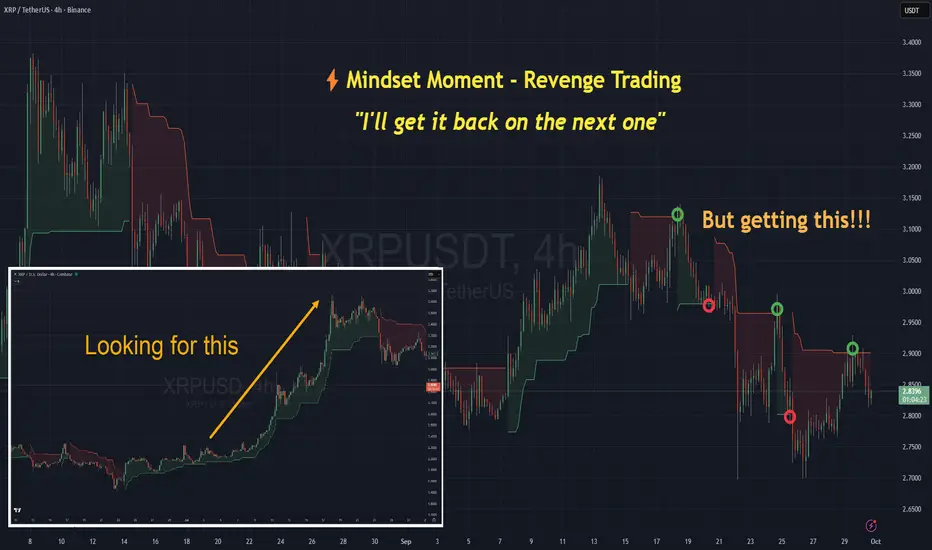
Revenge Trading – The Loop That Drains YouNOTE: This is a post on Mindset and emotion. It is NOT a Trade idea or strategy designed to make you money. If anything, I’m posting this to help you preserve your capital, energy and will so you can execute your own trading system with calm, patience and confidence.
Momentum and trend are in play and you’re lining up for the next opportunity to join the trend up.
Diligently - you follow your rules and get in when the ‘stars align’ and when the indicators you’ve chosen give you the confirmation you’re looking for to get in.
And then you’re stopped out.
“I’ll get it back on the next one.” It starts as a whisper in your head right after a loss.
"Is it a false breakout? Is it noise? "
You don’t even consider ‘chop’ right now.
You re-enter
Stopped again and again.
This is starting to feel personal.
What’s really happening inside you:
Thoughts: “The market took from me.” “I’ll show it.”
Feelings: Anger, injustice, shame.
Behaviours: Increasing size, doubling down, moving stops.
Body cues: Racing heart, clenched jaw, tunnel vision.
Trigger: A loss that feels unfair or personal.
This is anger disguised as trading. You have been triggered.
How to take control of this:
Name it: Say out loud “I’m acting out here.” Ask yourself - ‘Do I really want to do this, is this part of the plan or am I honestly revenge trading?’. Asking these questions at least stops the automatic reaction of just jumping in and brings awareness to the situation. It’s a breaker switch that interrupts the loop.
Ground yourself: notice your breath, your heart, your body. It’s likely that your biology is reacting to the loss which means hormones such as [adrenaline and cortisol are racing through you. Step away until the adrenaline settles.
Reframe the loss: remind yourself: The win I’m chasing won’t undo the loss. Only discipline will. Losses in this game are a cost of doing business. I accept that there are costs and I am in control of my spend as any successful business owner does.
Losing isn’t the problem. How you react to the loss defines your career.
If you found this useful, also have a look at a previous post I’ve put up on revenge trading. Here’s the link.
I also offered some reflections on a trade post sent to me by another TradingView user. The topic wasn’t revenge, but the challenge presented by the market wasn't too dissimilar.
p.s. Apols if anything is odd in this post, I have had to repost it.