XRPUSD Bullish till canceledI am long in XRP, and accumulate my longs, at 2.827 onlöy if the level holds.
Below 2.664 bearish bias starts,and can lead to 1,63
Bullish targets are 3,5327, 3.6796, 4.0248
Risk and stop based on risk tolerance and account risk
XRPUSDT.5L trade ideas

XRP 4H – Golden Pocket Retest at Trendline, Decision AheadXRP has bounced into the Fib Golden Pocket and is now testing downtrend resistance at a decision point.
Bullish path: A clean breakout through the trendline could trigger continuation, with further upside if momentum carries through.
Bearish path: A rejection here could send price back into the golden pocket range, with deeper liquidity resting around 2.82.
With Stoch RSI elevated, the next move should confirm whether buyers have strength or if sellers defend the trendline.

Consolidation → Breakout → Pump → Repeat!Consolidation → Breakout → Pump → Repeat! 🔄
That’s how it will continue in the coming months. 📈
All the fun is still ahead. 🤫

XRPUSDT📊 The BINANCE:XRPUSDT is correction-trend. I think the short-term downtrend has come to an end.
🟢 Best support: 2.8640$
🔴 Targets: 3.2060$ - 3.6020$
⚠️ Please control risk management.

Long XRP to All time highThis morning, I entered a long position on the retest of the weekly Volume Area High, which aligned with the significant imbalance left after Powell’s speech yesterday. I’m considering increasing my position if price breaks above the high at $3.10, and may adjust the stop loss to manage risk accordingly.
T1 is intentionally conservative. Upon reaching this level, I plan to move my stop loss to break-even without taking any partial profits, allowing the entire position to run while minimizing risk.
GL

XRP will break the resistance lineBINANCE:XRPUSDT on the 1D chart shows extended consolidation after a breakout from a larger triangle. The current sideways action near $3.48 indicates buyers are absorbing supply before the next move. A breakout above $3.48 could extend gains toward $3.80 and $4.00, with $3.20 acting as the key support level.

XRP Above Support · 5X Lev Trade-Numbers · Mid-Range (PP: 388%)XRP is trading above support. We can see EMA34 (green) being safe on the chart and not yet tested, a signal of strength. Our "support" range is also unmolested on the second drop. So far, support holds.
You know what we always say: "Sell at resistance, buy at support."
This looks like a good chart setup now but it can go wrong. You can have a good trade do bad, just like a bad decision can end up yielding good results. Our goal is to make the right decision all of the time and produce positive results more often than not.
At support, we have lower risk for a drop and higher chance for reversal. If we go deeper and look for other signals, we can wait for a stronger chart setup. Not all chart setups are the same.
Some trades have higher risk, others lower. Some trades move fast others slow. Some trades are a win; certainly, some other trades are a loss.
Our focus is not necessarily on winning once but on producing a positive outcome consistently. Can we achieve or goals? Can we reach success?
This chart setup is bullish but also a mix, prices have been dropping but again, we are looking at support.
Prices have been dropping since 18-July, more than a month. Why would a retrace go for longer? Is it necessary?
I don't know. XRP has been rising since November 2024 and is likely to resume going up. It will do so within hours or days. It will do so within weeks. You can decide to jump now or maybe later, there is no reward without risk.
Go ahead and take the plunge. We are ready for the bullish jump.
______
LONG XRPUSDT 5X (PP: 388%)
ENTRY: 2.73 - 2.95 (STOP: 2.65)
TARGETS: 3.08, 3.30, 3.46, 3.66, 4.02, 4.28, 4.59, 4.85, 5.17
______
You can notice some difference in the trade-numbers compared to previous posts. This is because we have different methods for extracting targets and it all depends on the goals and the timeframe. A daily chart setup will not give you the same targets as a weekly or monthly one.
Normally, I using the long-term targets for all ranges. These targets have been extracted with the mid-term range. But the move can cover a long space.
I am wishing you health, wealth, good luck, profits and success.
Namaste.

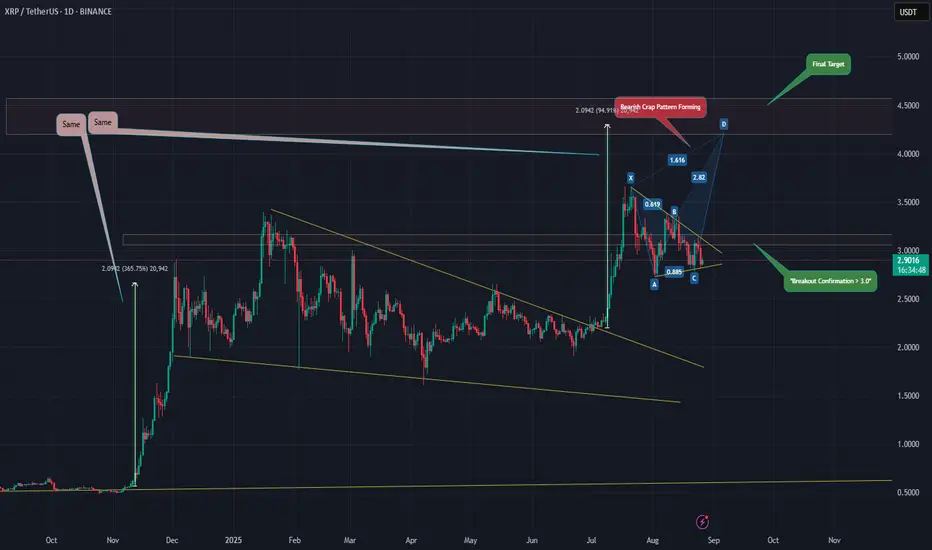
XRP– Bearish Crab Pattern Forming | Breakout Confirmation NeededDescription:
XRP is forming a Bearish Crab harmonic pattern, with price currently consolidating inside a triangle structure. A breakout above the $3.0 level would confirm the move toward the completion of point D.
Key Points:
Harmonic structure: Bearish Crab (XABCD).
Breakout confirmation: > $3.0
Final target zone: $4.5 – $4.6 (potential completion of pattern).
Invalidation: Breakdown below point C (~$2.85).
If price reaches the D zone, it would align with a strong resistance cluster — a possible reversal zone. Until then, breakout confirmation is essential.
📌 This is an educational idea, not financial advice.
XRPUSDT:Trade 15 min FractalConsidering the Ripple chart and the fact that the majority of the movement is bearish, we can have this view, so we can expect the decline to continue even to $2.5.

AltcoinPioneers | XRP Daily Analysis Day1BINANCE:XRPUSDT
AltcoinPioneers | XRP Daily Analysis Day1
👋 Welcome to Altcoin Pioneers Group TRADING ™!
Let’s analyze XRP. Let’s explore the reason behind it and what Bitcoin’s next move might be.
It features a falling wedge pattern 🔻, marked with red lines ❌, indicating a potential reversal ⬆️.
The price rose initially 📈, then declined 📉 within the wedge, forming lower highs and lower lows.
A target price 🎯 is indicated around 3,0881 USDT 💰, suggesting a possible upward breakout 🚀.
The current price is near 2,829 USDT 📍.

XRPUSDT Targets $4.17 After Neckline BreakXRPUSDT is forming a potential inverse head and shoulders structure, with price currently building the right shoulder above the key demand zone. A confirmed breakout above the neckline would validate the bullish reversal pattern, targeting the projected levels at $3.7094 and $4.1769. The plan is to focus on accumulation near the right shoulder zone while maintaining bullish bias towards the outlined objectives.

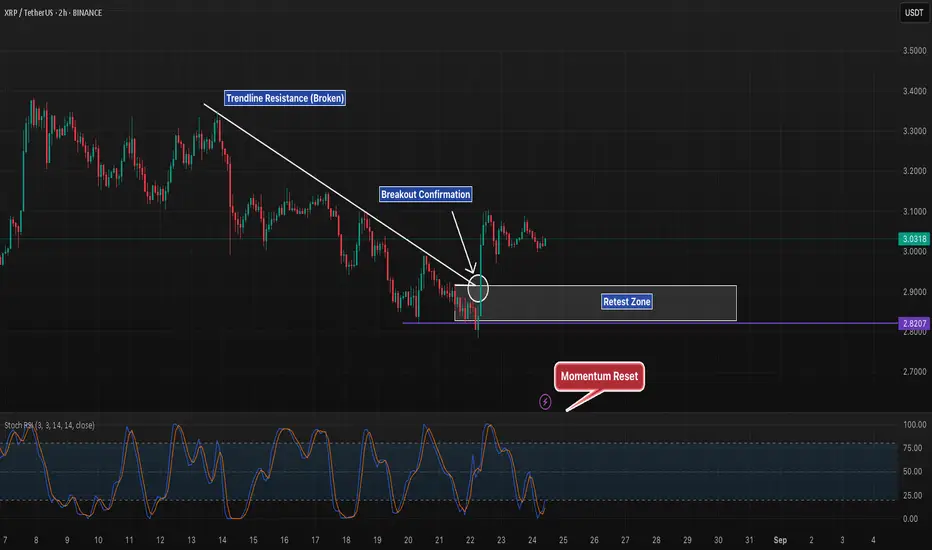
XRP 2H – Breakout Retest in Play, Can $3.20 Hold Next?XRP has broken out of its short-term descending trendline, with a strong impulse candle confirming the move. Price is now consolidating just above the 2.82–2.90 retest zone, making this a critical level for continuation.
Bullish case: If buyers defend the retest zone, XRP could extend toward $3.20–3.30, aligning with prior local highs.
Bearish case: A failure to hold above $2.82 support risks invalidating the breakout, sending price back into the range.
The Stoch RSI has cooled after the breakout spike, suggesting momentum is resetting and could fuel another push if support holds.
Key levels:
Support: $2.82–2.90 retest zone
Resistance: $3.20–3.30 (local highs)
Breakout point: Trendline resistance flipped to support
XRP has shifted structure with this breakout — now the retest will decide whether momentum continues higher.
XRP needs to correctWith falling volume, and weakening momentum on the RSI weekly, Im looking for $2 something

XRP/USD Correction Phase Before New HighThis analysis, utilizing the SB Model, examines a correction phase for XRP/USD on the 1-hour Binance perpetual contract chart, anticipating a pullback before a potential new high. The current price, based on SB Model projections, shows consolidation within a symmetrical triangle pattern. A corrective dip is expected before a breakout above resistance, targeting adjusted take-profit levels (TP1, TP2, TP3, and FINAL) as per the model. The trade is supported by volume trends and a bullish momentum shift. Set a stop-loss to manage downside risk, adjusting based on SB Model signals. Exit or adjust targets if momentum fades post-correction.

XRP NEW VOLUME INCREASE AFTER CASEXRP can show in the coming time new trend volume, since it has shown the first signal.
For this reason there will be a follow at XRP
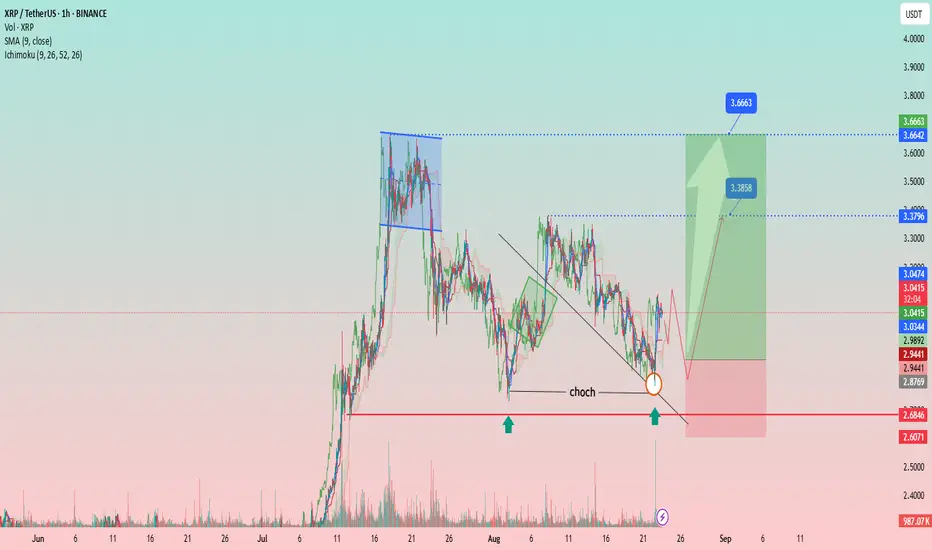
XRP/USDT – Bullish Reversal Setup After CHoCH BreakoutAnalysis:
The chart shows XRP/USDT (1H timeframe) developing a bullish structure after a Change of Character (CHoCH) confirmation near the $2.94 support zone. Price respected the key demand area (highlighted by green arrows) and broke above the descending trendline, signaling potential reversal momentum.
Support Zone: $2.94 – $2.87 (strong demand zone, price reacted twice).
Resistance Levels:
First target: $3.38
Second target: $3.66
Indicators:
SMA (9) at $3.04 – price hovering around it, suggesting early bullish strength.
Ichimoku showing potential cloud breakout aligning with bullish momentum.
Volume: Increasing at demand, indicating strong buyer interest.
Trade Plan:
Entry Zone: Around $3.00 – $3.05 (after retest confirmation).
Stop-Loss: Below $2.86 (invalidates setup if broken).
Targets:
TP1: $3.38
TP2: $3.66
Risk/Reward: Favorable, with potential 2:1 or higher depending on entry execution.
👉 This setup suggests that XRP may attempt a bullish continuation if support holds and volume sustains the breakout momentum.
Xrp chartXrp chat - key levels.
If price drops under support it invalidates the setup, it needs to stay on top for a valid move.
Price can get back even in a few month and use this as support to go higher if it does not do it now.

Jackson Hole Signals & My XRP LongPowell’s Jackson Hole speech opened the door for just one rate cut – likely in September. Markets rallied as equities hit new highs and bond yields fell, while the Fed stays cautious, balancing inflation risks with a cooling labor market. As shared with my community, I’m holding a long position on XRP.

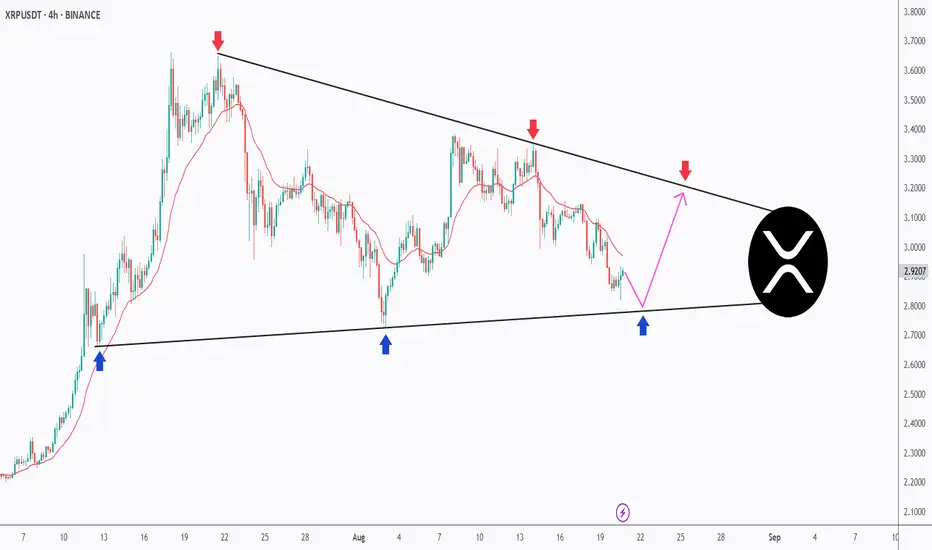
The Perfect Triangle – XRP’s Setup of the Month!XRP has been coiling up inside a textbook symmetrical triangle on the 4H timeframe.
🔻 Sellers are defending the descending trendline (red arrows).
🔹 Buyers keep stepping in at the rising support (blue arrows).
📉 Price is now retesting the lower bound, and as long as this zone holds, we can anticipate a potential bounce back toward the upper boundary.
🚀 A breakout from this formation will likely define XRP’s next major move — either continuation higher or a bearish breakdown.
This clean structure makes XRP one of the most exciting charts to watch this month!
⚠️ Disclaimer: This is not financial advice. Always do your own research and manage risk properly.
📚 Always follow your trading plan regarding entry, risk management, and trade management.
Good luck!
All Strategies Are Good; If Managed Properly!
~Richard Nasr
XRPUSDT: Trade 15 minHello, I opened a trade on Ripple, the points where the price is likely to reverse are marked, so in the lower timeframe there is a short-term trend towards gain. Be profitable.

XRP 2H – Supply Rejection, Can Supports Catch Price?XRP tapped into the 3.097–3.065 supply zone and rejected sharply. Price is now pulling back.
Levels to watch:
First support sits near 2.8739.
If that breaks, deeper liquidity sits at 2.8191.
Only a reclaim above the 3.097 supply zone would shift bias back to bullish.
For now, rejection from supply keeps risk of further downside open unless buyers step in at lower support.

XRP Confirms Support · Good NewsWill XRP resume growing right away? Yes!
Continue reading below for the full details... I shall explain.
My fellow reader and long-term supporter, it is my pleasure to write again for you today. We have good news here, we have strong signals to support our highly profitable and successful LONG trades. You can go all-in right now, timing is great.
XRP confirms support in two different ways. The main low happened the 28-July week and this week we have a shy higher low. The action stopped right at EMA13 and all selling was bought. All the losses this week have been recovered within a few hours, this is a major development.
If the market can recover this fast in just a few hours, what happens in a matter of days? What happens in 10 days or 21 days? Amazing possibilities; expect something great.
With support confirmed we know prices can move higher but it can happen that resistance is also confirmed and we continue—get—sideways forever more... And it becomes boring and we turn off the computer and find something to do at home.
Well, the last peak happened 14-July. Counting this week, we have a total of five weeks and that's a standard retrace for you. Prices move lower only a little, briefly and then the market continues with its main trend.
With five weeks of retrace and the retrace being over, we can expect higher prices right away.
Our targets continue to be the same. We will be aiming first at $4.4444 but just to move higher. Main target short- to mid-term is $6.28. Depending on how the market is doing at this point, we adapt and continue to trade.
Thank you for reading.
Namaste.

Ripple (XRP): Powell Gave Us Break of Structure!Ripple is showing good signs of potential 20% movement after today's economic news, which broke the chart of XRP with a good break of structure.
More in-depth info is in the video—enjoy!
Swallow Academy
