XRPUSDT Flow Map| Price In Bearish SentimentHi there,
XRPUSDT is bearish on the H1 timeframe. The current price is reacting bearishly against the resistance line at 2.9929, with strong bearish pressure at the 3.0102 resistance line. The price has reached the H4 trendline and is breaking it.
The trendline is supported by the H4 support line, but it will not hold due to the bearish high on September 24. The break of the trendline will trigger a move down to the 2.9029 target area and extend to the open area at 2.8500, driven by the dominant bearish pressure from the H4 bearish trendline.
Additionally, the RSI is in a bearish zone at 39.47, below its EMA, which is also decisively bearish at 48.13.
Happy Trading,
K.
_
Not trading advice
XRPUSDT.5L trade ideas

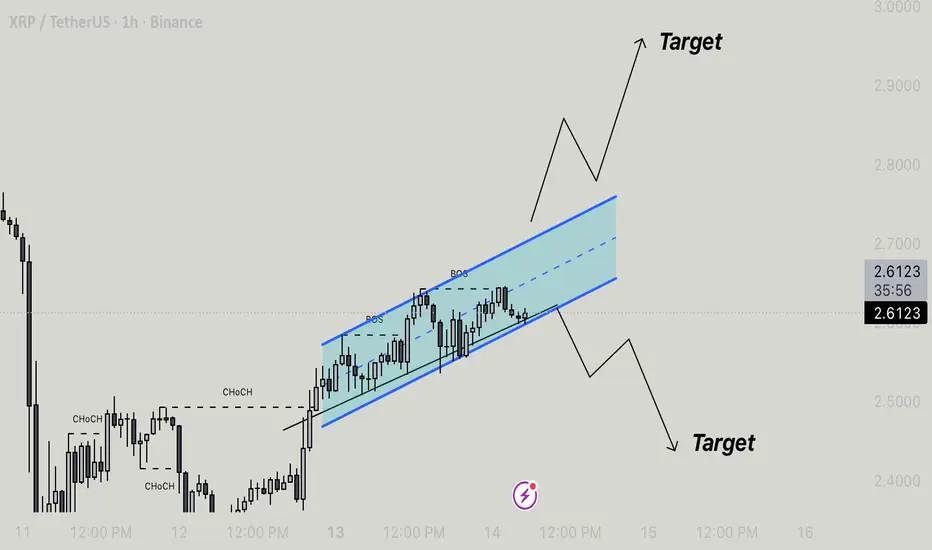
Assending Channel Formation And Potential Breakout OutlookXRP/USDT is currently trading within a well-defined ascending channel, indicating a short-term bullish structure following a previous period of consolidation. The market has shown a clear change of character (CHoCH) and multiple breaks of structure (BOS) to the upside, confirming the shift from bearish to bullish momentum.
Price action is currently respecting both the upper and lower boundaries of the channel, moving in a controlled upward pattern. The midline of the channel is acting as a short-term equilibrium level, where price frequently reacts before continuing in its prevailing direction.
As the price approaches the upper boundary, a breakout above this level would suggest bullish continuation, targeting the next resistance zone around 2.80–2.90. Conversely, if the price fails to hold above the lower boundary and breaks below it, a corrective move toward 2.40–2.30 could be expected.
Overall, XRP is in a bullish corrective phase within a rising channel. Traders are watching for a decisive breakout in either direction to determine the next major move.
XRPUSDTRipple has settled around the 2.5 zone after a correction.
If demand continues, it could easily reach the 2.8 and 3.0 levels.
With a confirmed breakout above 3.0, we might expect further growth toward 3.6 or even higher.
However, if stronger selling pressure appears before 2.7, Ripple’s price could drop to around 2.0 or even lower.
For now, we’ll wait until the data and market direction become clearer.
If you have any questions, feel free to ask.
Respectfully.

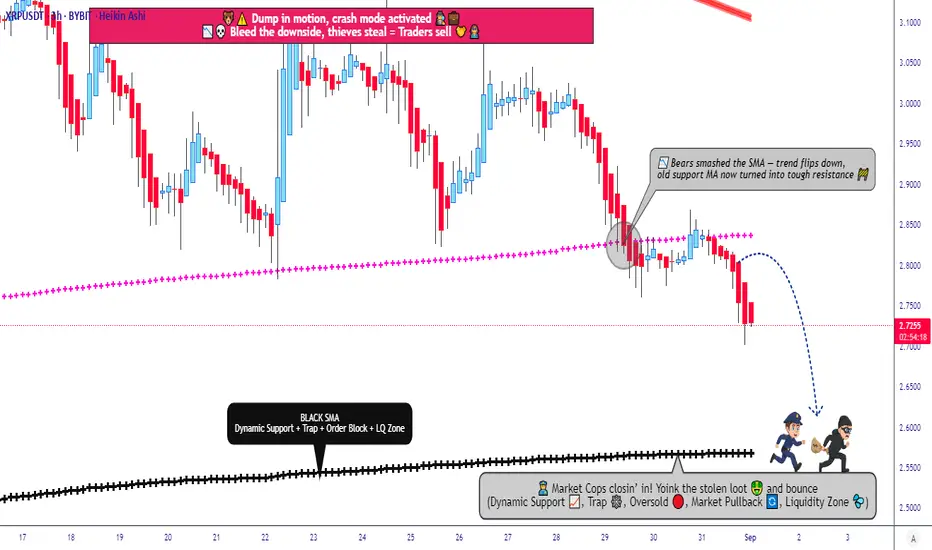
XRP 1D Analysis - Key Triggers Ahead☃️ Welcome to the cryptos winter , I hope you’ve started your day well.
⏰ We’re analyzing XRP on the 1-Day timeframe .
👀 On the daily timeframe of Ripple (XRP), we can see that — for this analysis — I decided to share my perspective from left to right across the chart.
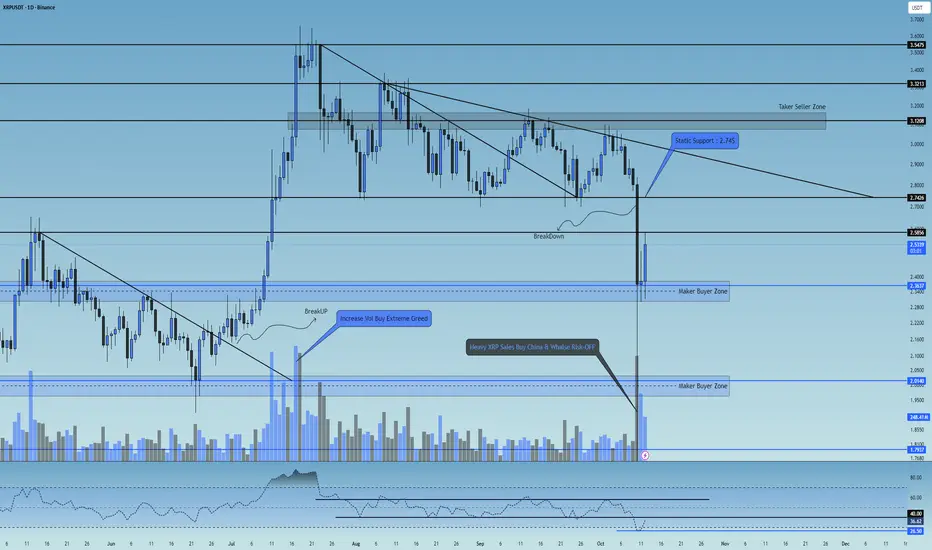
From mid-May to late June, Ripple was trading below a descending dynamic resistance trendline, which it successfully broke to the upside, rallying from $2 to $3.5. In that area, heavy profit-taking occurred, pushing the price downward. The first major support after that sharp rally was at $2.74.
Later, Ripple formed a lower high at $3.23 and a double bottom (equal low) around $2.74, which created a strong static support and positioned the price within the final third of its triangle pattern. It then broke its dynamic trendline resistance again and managed to make a higher high, but this time it failed to show the same sharp bullish momentum. It was quickly rejected from $3.1, which was a taker-seller zone, and pulled back toward its static support.
Buyers didn’t allow the key floor to break — they defended the level aggressively, pouring in additional liquidity to keep XRP above support. However, since no major new capital inflow entered the market and Ripple remained compressed within multiple overlapping triangle formations, a new dynamic resistance was formed. Even with intense effort from buyers, that resistance couldn’t be broken, and eventually, Ripple lost its key static support at $2.74 and dropped further.
Although this move was technically predictable, the speed and depth of the fall were hard to manage in real time. Now, Ripple is sitting above a strong buyer-maker support zone, and much of the selling volume is being absorbed by buybacks. Retail traders are also accumulating again.
The interesting point: Ripple has a critical resistance at $2.58 — if it breaks and holds above this level, it can reignite a bullish move upward. The main resistance zone remains the same old static support area that buyers previously tried hard to protect. Once the $2.74 level is broken back to the upside, Ripple could experience a strong pump.
🧮 On the daily RSI oscillator, Ripple had a very strong static resistance zone around 62, and on its last touch it got heavily rejected, dropping below 50 and 30 without much resistance. Currently, RSI has a support around 26.5 and a key resistance around 40 — these are the main RSI pivot levels. If Ripple’s RSI breaks out of this range, it can trigger higher volatility and momentum aligned with the market direction.
🕯 The recent candle structures — especially the large bearish candle with a long lower wick — caused panic and FOMO among Ripple holders. This led many institutions and big wallets to switch into risk-off mode, dumping their XRP positions and causing a 50% crash within hours.
However, Ripple has recovered well, and the last two bullish candles came with solid buying volume, likely supported by the RSI exiting its oversold zone. With continued buying volume and a break above the key taker-seller resistance at $2.58, Ripple could resume its upward movement.
🧠 If we held Ripple — what would we do?
Personally, if I owned XRP right now, I’d strictly follow capital and risk management, avoiding emotional decisions driven by fear or greed. Ripple is currently forming a new trading range with tight highs and lows, meaning that breaking either boundary will likely start the next major leg of movement.
The upcoming week, especially with the meeting between Trump and the Chinese President, could significantly impact risk markets.
So for now, I’d do nothing major — and if I decided to open a position, I’d do it with minimal risk (and yes, I call that “a bad habit” on purpose 🙂).
This scenario will be updated with more precision and detail in future analyses.
❤️ Disclaimer : This analysis is purely based on my personal opinion and I only trade if the stated triggers are activated .
Beyond the Chart - XRP AltCoin Market Analysis 🚀 BINANCE:XRPUSDT XRP/USD AltCoin Market 🚀
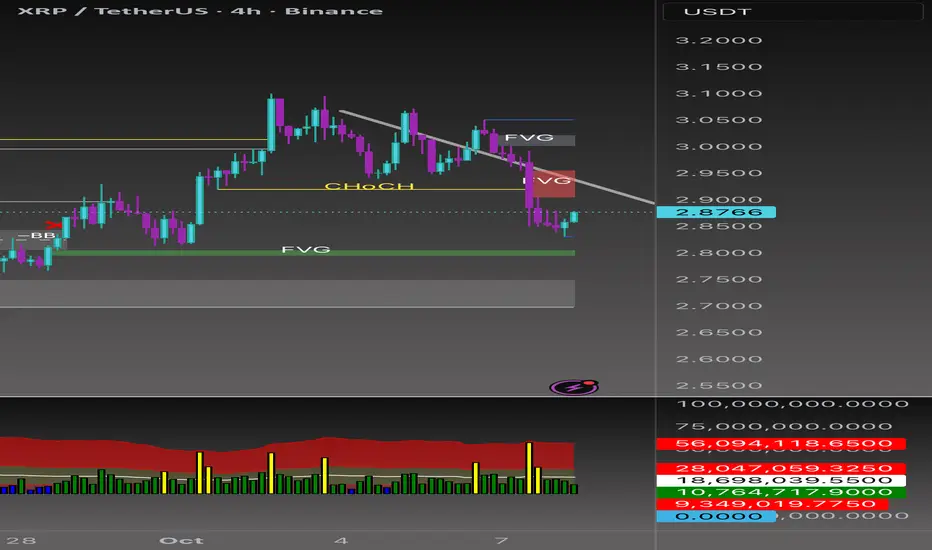
XRP stuck between ⚙️ Accumulation ($2.80–$2.85) and 💰 Distribution ($3.00–$3.10) zones.
Descending triangle 🔻 hinting possible breakdown if $2.80 fails — eyes on $2.65 next.
But a clean breakout + hold above $3.05 could flip bias bullish → $3.20–$3.40 🟢
🌐 Macro View:
ETF delays 🏦 + U.S. shutdown ⚠️ keep pressure on alts.
Still, crypto inflows 💸 remain strong — extreme negativity could fuel a contrarian bounce.
🎯 Setups
📈 Long: Breakout + retest above $3.05 → 🎯 $3.20 / $3.40
📉 Short: Breakdown below $2.80 or rejection from $3.05 → 🎯 $2.70 / $2.55
Xrp/Usdt - Bullish Reversal From Support ZoneXRP is currently trading within a well-defined support zone, showing potential signs of a bullish reversal after multiple structure shifts (CHoCH) indicating seller exhaustion. Price tapped into the support area with a rejection wick, suggesting strong buyer interest.
The entry zone is highlighted near the support, aligning with liquidity sweep and a possible accumulation phase. A clean break of internal structure toward the upside would confirm bullish momentum.
As buyers gain control, the market is expected to form a higher-low structure before pushing toward the target zone, potentially reclaiming previous highs. The overall setup favors a buy scenario, with confirmation upon sustained bullish candles above minor resistance.
Key Points:
• Timeframe: 15M
• Zone: Support Rejection / Liquidity Sweep
• Entry: Near support confirmation
• Bias: Bullish Reversal
• Target: Previous strong high level

xrp long idea/classic patternI have been trading this pattern for a long time now, and I am waiting for a 3 top to form, the highest in the 3.55 zone from where a strong decline could occur. We have been preparing for a strong uptrend on the hrp at 40% for quite some time now

XRP Daily – Can the 0.236 Fib Hold Again?XRP Daily – Testing Support at the 0.236 Fib Level
XRP is once again trading in the green support area that has held since the beginning of August.
This zone aligns with the 0.236 Fibonacci level and forms the base of a descending triangle, with the series of lower highs creating its upper boundary.
Price has also lost the 50MA, and from a system perspective, the structure confirms a short-term downtrend, with Price < MLR < SMA < BBcenter.
If this triangle breaks to the downside, the next significant support sits at the 200MA at $2.60.
Momentum indicators remain weak:
RSI is below its moving average and trending downward, while MACD has already turned red, showing fading strength.
With the broader market showing signs of consolidation after BTC ATH,
XRP reaction here could reveal how altcoins handle pressure at key supports.
For now, this support zone remains key; losing it would confirm a bearish breakout from the triangle pattern.
Bias: Short-term bearish, watching the 0.236 Fib and 200MA as critical levels for reaction.
Always take profits and manage risk.
Interaction is welcome.

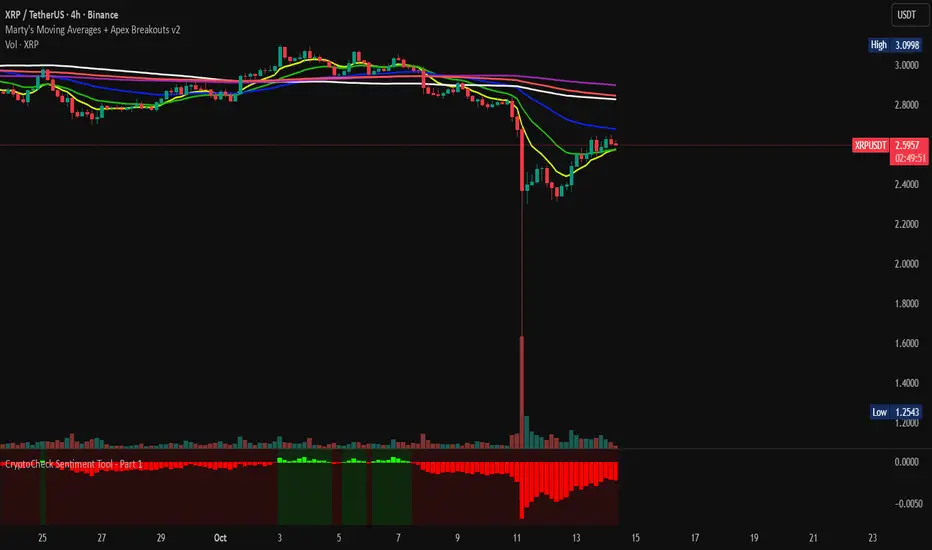
Beyond the Chart - XRP AltCoin Market AnalysisBINANCE:XRPUSDT
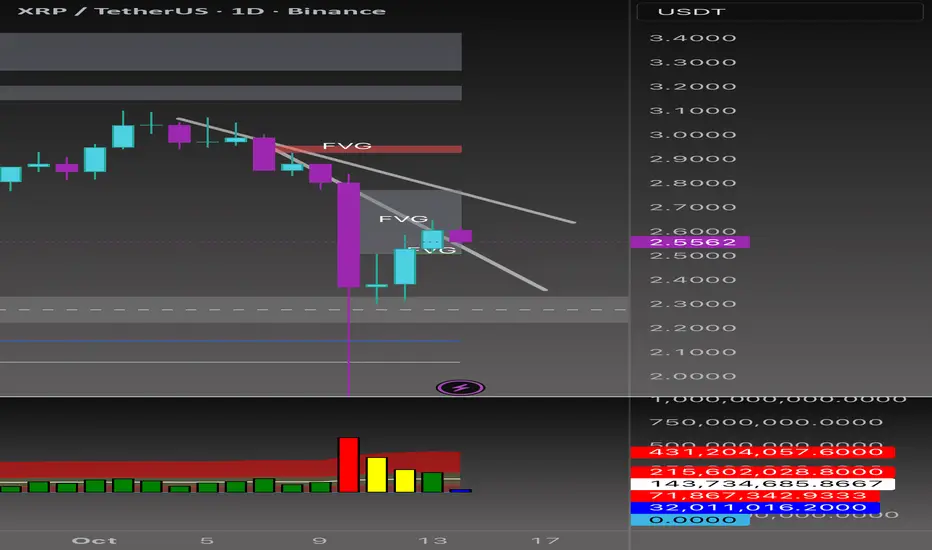
Perfect reaction to my Oct 11 plan price bounced from the 2.290 Breaker Block and rallied into the FVG + trendline confluence. 🎯
Volume shows heavy sell-side liquidation but strong absorption after bulls now need a daily close above 2.72–2.73 to aim for the 3.0–3.2 zone.
If price closes below 2.29, expect a deeper drop toward 2.10–1.90.
High volatility today trade light or wait for daily confirmation. ⚡📈
XRP bullish mean reversion, macro level discountOn the weekly we can see that XRP is at the bottom of it's range touching on support.
On the daily chart a bullish mean reversion condition is active.
XRP XRPUSDTXRP Use Case and Market Direction
XRP Use Case
Cross-Border Payments: XRP is primarily used as a bridge currency in Ripple’s payment network (RippleNet) to facilitate fast, low-cost cross-border remittances and liquidity management between financial institutions globally.
Liquidity On-Demand: XRP provides liquidity on demand, allowing banks and payment providers to avoid holding large pre-funded accounts in foreign currencies.
Speed and Cost Efficiency: XRP transactions settle in 3-5 seconds with very low transaction fees, significantly faster and cheaper than traditional correspondent banking systems.
Interoperability: XRP supports interoperability between different fiat currencies and payment rails, improving global payment network efficiency.
Use in Emerging Markets: Particularly valuable in regions with underdeveloped banking infrastructure, enabling greater financial inclusion.
ETF Approval Prospects: Pending or potential approval of a spot XRP ETF could unlock substantial institutional investment, providing positive price momentum.
Partnership Expansion: Ripple continually expanding partnerships with financial institutions worldwide strengthens XRP’s fundamental utility and demand.
Market Volatility: XRP is subject to volatility tied to broader crypto market swings, regulatory news, and geopolitical developments.
Price Outlook: With favorable regulatory outcomes and ETF approvals, XRP could see sustained growth and wider adoption, potentially reaching $4 or higher by the end of 2025, while adverse rulings could weigh on price.
The SEC has historically delayed approvals for XRP ETFs due to ongoing legal and regulatory scrutiny surrounding XRP and Ripple Labs.
XRP remains under a cloud of regulatory uncertainty in the U.S., which has slowed ETF approvals. However, there has been ongoing pressure for the SEC to provide clearer guidance or approve spot XRP ETFs.
Market anticipation remains high as recent developments in Ripple’s legal cases and broader SEC crypto ETF transparency could pave the way for eventual approval.
KEY SUPPORT ZONE WITH WICK REJECTION.
3MONTHS SUPPORT @0.9735$-0.9614 $
6MONTH SUPPORT ZONE @0.8647$-0.8282
ANOTHER KEY SUPPORT @0.5783$
NOTE IF THE SEC APPROVES THE ETF ...ITS GOING TO THE MOON.
#XRP #XRPUSDT

Xrp Long/Buys I bought Xrp in spot first at 2.3000 at Trendline break. Than at 2.7000 when it rejected support at daily timeframe. Now there’s a resistance Trendline if it breaks on daily you can buy on spot.
Targets are given on chart and I’m expecting Xrp to go and tap 5.000 in future , advising to buy on spot.

XRPUSDTBased on the XRP/USDT chart, the price is moving in a bearish direction. If the price breaks below the blue trendline, it could drop to around $2.60. However, if the support holds, the price may rebound toward $2.90.

XRP Analysis🚨 CRYPTOCAP:XRP Analysis 🚨
There are equal lows (DOL) sitting near the previous week’s low — liquidity waiting to be swept 👀
📉 I’m expecting a sweep there, with two bullish Order Blocks resting below.
Will wait for confirmation to long once price taps into those OBs✅

XRP - Will it hold?Technically the level i drew it shall go below, only if certain coins moves freely so will he do.

XRP XRPUSDTXRP Use Case and Market Direction
XRP Use Case
Cross-Border Payments: XRP is primarily used as a bridge currency in Ripple’s payment network (RippleNet) to facilitate fast, low-cost cross-border remittances and liquidity management between financial institutions globally.
Liquidity On-Demand: XRP provides liquidity on demand, allowing banks and payment providers to avoid holding large pre-funded accounts in foreign currencies.
Speed and Cost Efficiency: XRP transactions settle in 3-5 seconds with very low transaction fees, significantly faster and cheaper than traditional correspondent banking systems.
Interoperability: XRP supports interoperability between different fiat currencies and payment rails, improving global payment network efficiency.
Use in Emerging Markets: Particularly valuable in regions with underdeveloped banking infrastructure, enabling greater financial inclusion.
ETF Approval Prospects: Pending or potential approval of a spot XRP ETF could unlock substantial institutional investment, providing positive price momentum.
Partnership Expansion: Ripple continually expanding partnerships with financial institutions worldwide strengthens XRP’s fundamental utility and demand.
Market Volatility: XRP is subject to volatility tied to broader crypto market swings, regulatory news, and geopolitical developments.
Price Outlook: With favorable regulatory outcomes and ETF approvals, XRP could see sustained growth and wider adoption, potentially reaching $4 or higher by the end of 2025, while adverse rulings could weigh on price.
The SEC has historically delayed approvals for XRP ETFs due to ongoing legal and regulatory scrutiny surrounding XRP and Ripple Labs.
XRP remains under a cloud of regulatory uncertainty in the U.S., which has slowed ETF approvals. However, there has been ongoing pressure for the SEC to provide clearer guidance or approve spot XRP ETFs.
Market anticipation remains high as recent developments in Ripple’s legal cases and broader SEC crypto ETF transparency could pave the way for eventual approval.
KEY SUPPORT ZONE WITH WICK REJECTION.
3MONTHS SUPPORT @0.9735$-0.9614 $
6MONTH SUPPORT ZONE @0.8647$-0.8282
ANOTHER KEY SUPPORT @0.5783$
NOTE IF THE SEC APPROVES THE ETF ...ITS GOING TO THE MOON.
#XRP #XRPUSDT

XRP/USDT Market Report + Strategic Entry Levels🚀 XRP/USDT Market Report & Layered Trading Plan (Day/Scalping Trade) 📊
Current Price Snapshot 💰
XRP/USDT is trading at $2.81, down slightly 0.04% over the last 24 hours amid broader market consolidation. Daily volume is strong at over $3B, showing steady interest. Market cap sits around $167B, ranking XRP in the top 4 cryptocurrencies. Support has held near $2.80 over the past week, with potential for a rebound if key levels break.
📈 Trading Plan: Bearish (Layered Strategy)
Entry : Any price level; use multiple limit orders (layering strategy) for controlled exposure. Example layers: 2.7500 | 2.7700 | 2.8000 | 2.8200. Adjust layers based on your own risk/reward preference.
Stop Loss 🛑: Suggested 2.8800. Adjust according to your personal strategy.
Target 🎯: 2.5700. Use smart exits and scale out of positions based on market momentum.
✅ Layered entries help reduce risk while maximizing opportunity. Ideal for scalping/day trades.
😊 Investor Mood & Sentiment
Overall Bullishness: 65%
Retail Traders: 70% bullish – excitement over payments utility, ETF expectations, partnerships.
Institutional Traders: 55% bullish – whale accumulation + cautious optimism, with some profit-taking.
Fear & Greed Index ⚖️: 48 (Neutral) – market steady, volatility at 4.27%. Consolidation phase ideal for strategic positioning.
🏗️ Fundamental Score: 85/100
Strengths: High adoption (300+ partners, $1.3T yearly transactions), fast XRPL settlements (3-5s), low fees, escrowed supply cap, burned fees reduce circulating supply.
Weaknesses: Competition from stablecoins like USDC could cap growth if banks shift focus.
🌍 Macro Score: 75/100
Bullish Drivers: Fed rate cuts, crypto-friendly policies, ETF approvals likely.
Challenges: Trade tensions, inflation, emerging market pressures.
Net positive: adoption in Asia/Africa outweighs headwinds for now.
🔮 Overall Market Outlook
Bullish (60% probability) 🟢 – potential to test $3.35 resistance, with $4 possible if ETF news hits.
Key Watch: Break above $3.00 confirms strength. Buy dips near $2.72 support for upside.
🗂 Related Pairs to Monitor
ETH/USDT | BTC/USDT | LTC/USDT | ADA/USDT
#XRPUSDT #Ripple #CryptoTrading #Scalping #DayTrade #LayeredStrategy #CryptoAnalysis #MarketReport #CryptoSentiment
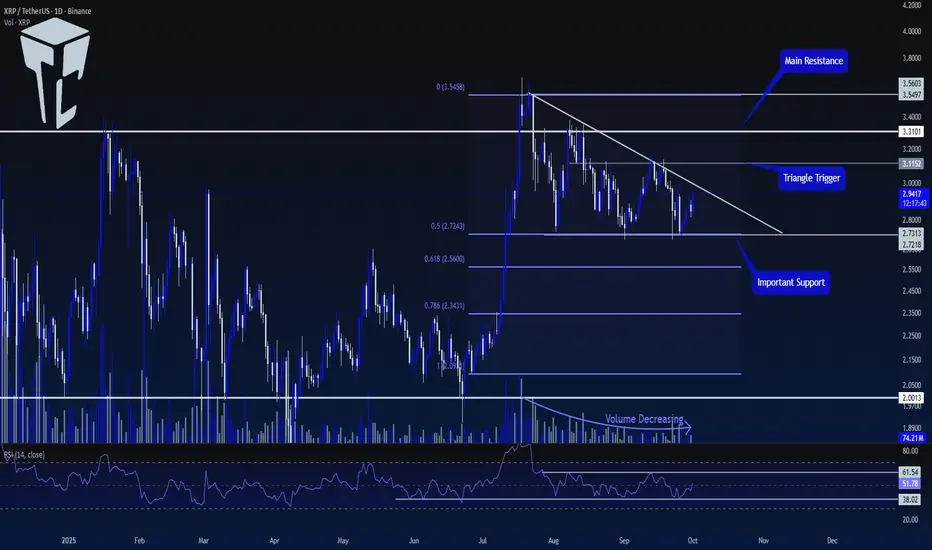
TradeCity Pro | XRP: Key Support and Resistance Zones Testing👋 Welcome to TradeCity Pro!
In this analysis, I will review the XRP coin. One of the oldest crypto projects, XRP aims to align crypto transactions with the SWIFT system. The coin has a market cap of $173 billion and is ranked 4th on CoinMarketCap.
📅 Daily Timeframe
After getting support at the 2.0013 level, XRP made a bullish move up to the 3.5603 resistance. Now, it has formed a descending triangle, and the volume has been decreasing as the price moves down.
⚡️ Currently, a crucial support zone has formed at 2.7218, which overlaps with the 0.5 Fibonacci level, forming a PRZ for us.
🧩 A descending trendline has also been created, and the price has touched it several times, making lower highs.
📊 To confirm the next bullish move for this coin, the first confirmation we need is the breakout of the trendline. The trendline breakout trigger is at 3.1152.
✨ Once this level is broken, we can open a long position. This trigger is the first long position trigger and is considered risky since we haven't yet received the main confirmation for a bullish trend.
🔍 The main trigger for the start of a new bullish trend is the breakout of the 3.3101 level. Breaking this level could start a new upward move for XRP.
💥 A very important confirmation for both long and short positions on the RSI is the breakout of the range between 38.02 and 61.54.
🎲 As long as the RSI remains between these two levels, the probability of hitting stop losses is high. Therefore, for a long position, we can wait for the 61.54 level on the RSI to be broken.
🔽 For a short position, the 38.02 level on the RSI is a good momentum trigger. We can also use the 2.7218 level as a trigger, but keep in mind that the main market momentum is bullish, so this short trigger is considered risky.
📝 Final Thoughts
Stay calm, trade wisely, and let's capture the market's best opportunities!
This analysis reflects our opinions and is not financial advice.
Share your thoughts in the comments, and don’t forget to share this analysis with your friends! ❤️
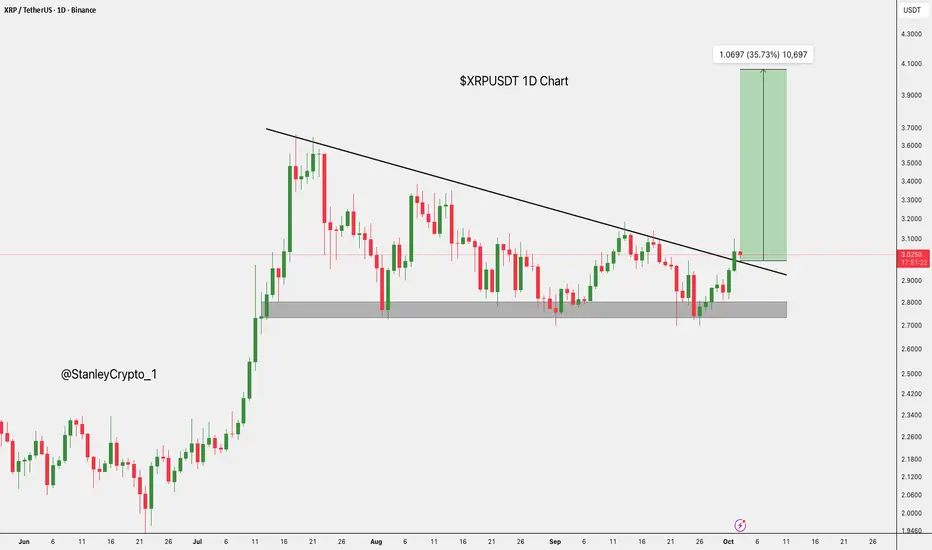
$XRP Breaks Out: 35% Upside Potential Ahead.CRYPTOCAP:XRP has broken above the downtrend, with strong support between $2.70 and $2.85.
If the breakout holds, it could target $4.10, a 35% upside.
Watch for a retest of the breakout zone to confirm further gains.
DYOR, NFA
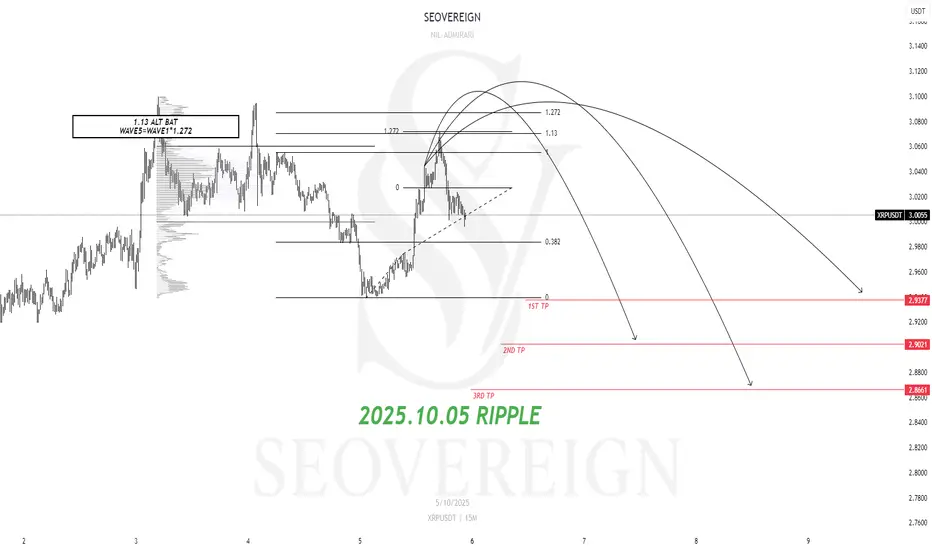
[SeoVereign] RIPPLE BEARISH Outlook – October 05, 2025Hello everyone,
I hope you are all having a peaceful day.
Today, I am writing to share my bearish (short) outlook on XRP as of October 5th.
The rationale is as follows.
The 1.13 Alternate Bat (ALT BAT) pattern is a harmonic variation that places the PRZ (Potential Reversal Zone) at the 1.13XA level—an extension beyond the conventional Bat pattern. This zone represents an area where price has likely become overextended, increasing the probability of a corrective reversal. It is generally recognized as a region where strong reversal signals tend to emerge.
In addition, WAVE5 = WAVE1 × 1.272 indicates an “extended fifth wave” in Elliott Wave Theory, suggesting that the final wave often terminates around the 1.272 extension level. This structure frequently appears near the end of an overheated market phase, just before the trend shifts direction.
When these two signals coincide or align closely in price, the area can be interpreted as a strong reversal confluence, where the harmonic PRZ and wave extension target overlap.
Accordingly, the average target is set at 2.90USDT.
As price action unfolds, I will provide updates on position management within this idea.
Thank you for reading.
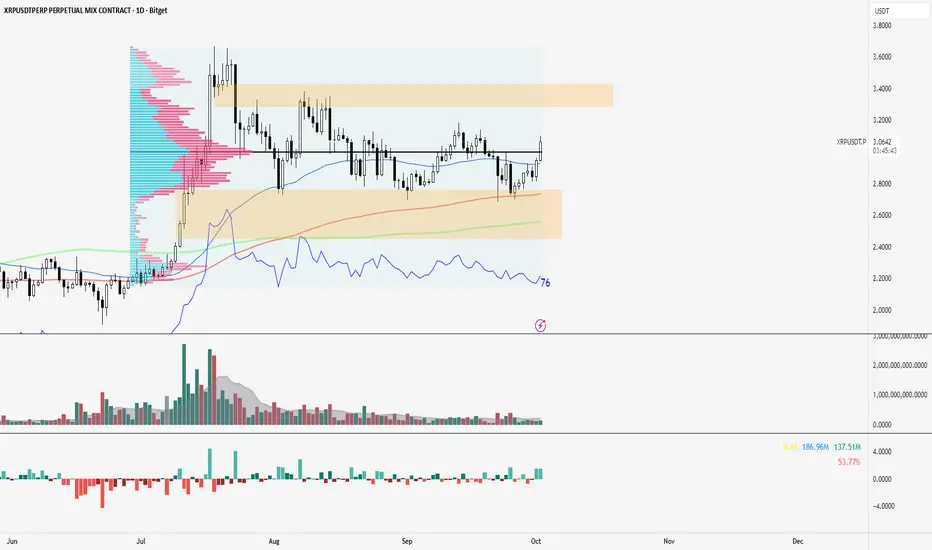
XRP Long to 3.40s I like the recapture on XRP relative to the POC on the volume profile. I like how it is congruent with emas. Looks pretty strong.
Want to see it recapture 3.02 or the POC successfully, and not fail a retest. Afterward im long to 3.40 where I'd trim and then add more on a pullback.
That area of the recent impulse is low in volume, more business to be done there IMO.
Could even add into the position on the retest of the existing POC.
This trade idea invalidates if it trades below 2.80 and cant reclaim paired with high volume. If that occurs I'd favor trading the lower thin profile and do business there. Not willing to get short, only willing to buy currently. This includes trading into 2.30s to 2.40s.
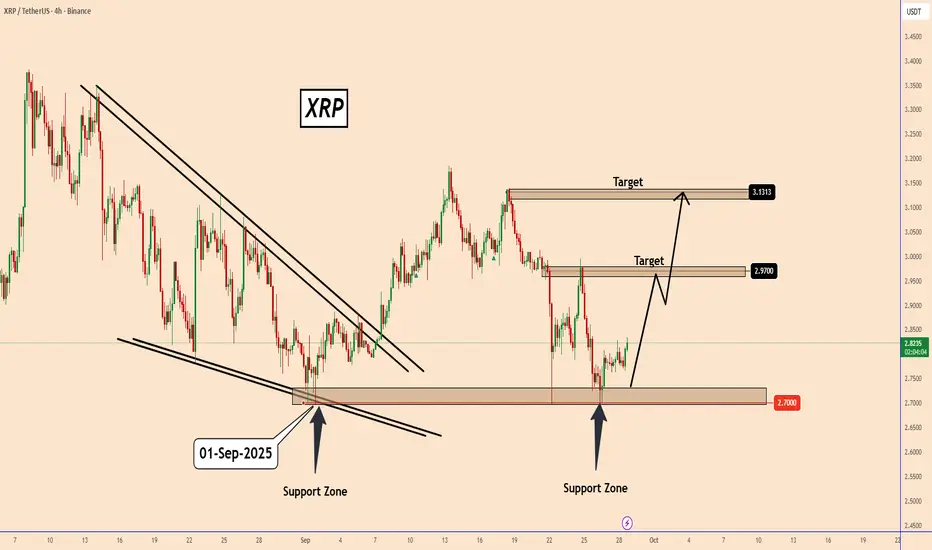
XRP: Bounce From Support Targets 3.13
XRP: Bounce From Support Targets 3.13
Price tested the support zone around 2.70 and bounced higher.
This shows buyers are stepping in to protect the level.
First target is at 2.97, where price may face resistance.
If momentum continues, the next target is around 3.13 that corresponds also to a strong structure zone again where XRP was rejected during the previous days.
As long as the price stays above the support zone, the short-term outlook remains bullish.
It is a bit risky overall considering BTC is not taking any direction yet, but as long as we can monitor the price, we should hold this zone.
You may find more details in the chart!
Thank you and Good Luck!
❤️PS: Please support with a like or comment if you find this analysis useful for your trading day❤️
BTC Hits New ATH… But What Happens Next? (History Says This)Bitcoin has finally taken out its all-time high — exactly as predicted in my previous analysis.
Now the real question is… what happens next?
In this video, I break down what this breakout means for BTC, TOTAL, and ALTs, and why the weekly close will be critical.
Historically, every time Bitcoin takes out all-time highs, we see strong bearish pressure shortly after — and this time might be no different.
Here’s what I cover:
- Bitcoin hits a new all-time high: what’s next?
- Historical patterns after ATHs
- What to expect from the weekly close
- XRP short update (still running)
- My BTC targets and what I’m watching next
- Altcoin rally incoming?
Stay patient, stay disciplined, and remember — the market rewards those who can manage risk and read structure.
⚠️ Disclaimer: This video is for educational purposes only and does not constitute financial advice. Always do your own research before trading or investing in cryptocurrency.
#Crypto #Bitcoin #BTC #XRP #CryptoAnalysis #ICTTrading #Altcoins #CryptoMarketUpdate #BitcoinATH
