XRP at Crossroads: Will $3.22 Break or $2.71 Collapse?XRP is trading just above the descending trendline that’s been active since mid-July, showing signs of compression and potential breakout.
Price is hovering between key resistance at $3.0166–$3.2164 and support at $2.7149–$2.7857, forming a tight consolidation range.
Bullish breakout above $3.17 could trigger a rally toward $3.37–$3.64, especially if ETF filings gain traction.
Bearish breakdown below $2.71 may lead to a drop toward $2.50–$2.26, as suggested by recent institutional liquidations and technical pressure.
XRPUSDT.5L trade ideas

XRP - Triangle Breakout, Eyes on 3.2?XRP broke out of its descending triangle on the daily and shifted the structure bullish. Price is now trading inside the 3.00–3.20 resistance band.
This zone is key 🔑. It’s prior supply and the top of the range. A clean daily close above 3.20 would open 3.40, then 3.60+ inside a fresh markup leg.
If buyers fail to clear it, I’ll watch for a healthy dip toward 2.80–2.90 (triangle base + demand) to reload. Bias stays bullish while the 2.70–2.80 floor holds.
What’s your plan - buy the break above 3.20 or wait for a retest into 2.80–2.90? 🤔
⚠️ Disclaimer: This is not financial advice. Always do your own research and manage risk properly.
📚 Stick to your trading plan regarding entries, risk, and management.
Good luck! 🍀
All Strategies Are Good; If Managed Properly!
~Richard Nasr

XRP; The double top pattern is fake!!!Hello friends
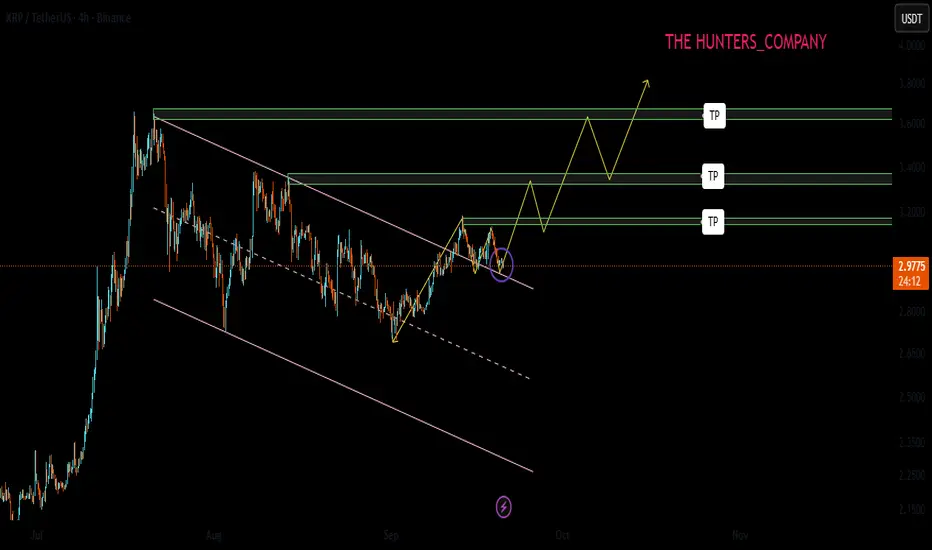
Regarding the price channel we had, after a long time this channel has been broken and now a double top pattern has formed which looks fake and wants to trap sellers.
If the price continues to move upwards, it can move to the specified areas.
If the formed pattern really wants to act and we have a price drop, the bottom of the channel and its midline are good supports.
*Trade safely with us*
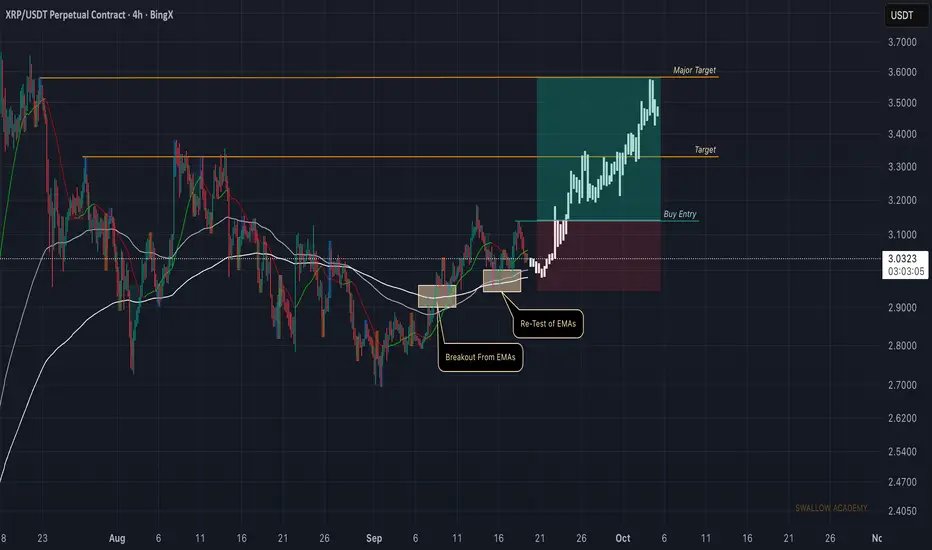
Ripple (XRP): Waiting For Proper Break of Structure | Bullish XRP has been holding well above the EMAs after the breakout, and candlesticks show steady buyer dominance with higher lows forming.
As long as sellers fail to close below EMAs, momentum should keep pushing toward the first target and eventually the $3.6 major target. Any close under EMAs would shift the structure, but for now, bulls are in control.
Swallow Academy
XRPUSDTAccording to the chart, there are no clear signs of a structural change in the overall price trend. In the upper timeframe, we do not have any lower lows than the previous major lows, and this will be a sign of a continuation of the upward trend until we see a lower low than the previous major low.
In the lower timeframe, the price is in a descending channel, where I do not see any scary selling pressure.
The 2.5 range is an important and valuable range.
If the price reaches this range, we need to see what reaction it will show.
Pay attention to the red box, which is similar to the current price behavior.

XRPUSDT Bullish Scenario Updated🔎 Technical Outlook
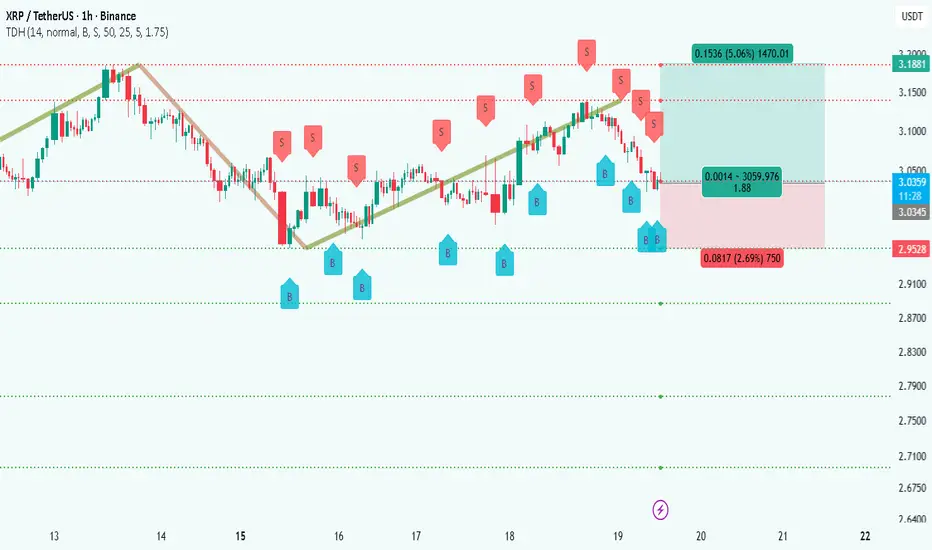
XRP is currently trading around 3.03 – 3.04 USDT, after bouncing from a key support zone near 2.95 USDT. The chart shows a sequence of higher lows with multiple buy signals clustering near the base, suggesting strong accumulation.
The resistance zone sits around 3.18 USDT, which is also marked as your target area. A clean breakout above minor intraday resistance at 3.05 USDT would open the way for bullish continuation. The structure favors buyers as long as price holds above 2.95 support.
________________________________________
📈 Trade Setup (Bullish Bias)
• Entry: 3.03 – 3.05 USDT (current market zone)
• Stop-Loss: 2.95 USDT (below recent support & invalidation level)
• Take Profit 1: 3.12 USDT (intermediate resistance)
• Take Profit 2: 3.18 USDT (major resistance target)
• Risk/Reward: ~1:2
________________________________________
🛡 Risk & Trade Management
• 🔒 Partial Profit Booking: Secure some profits at 3.12 USDT to reduce risk exposure.
• 📈 Trailing Stop: Once TP1 is hit, move stop-loss to breakeven (3.03) and trail along higher lows to ride momentum.
• 🚫 Invalidation: If XRP breaks below 2.95, the bullish setup is invalid, and exiting quickly protects capital.
________________________________________
✅ Summary
XRP is showing bullish intent after defending the 2.95 support zone and looks set to retest 3.12 – 3.18 USDT. A layered profit-taking approach with a trailing stop allows you to capture the move while managing downside risk effectively.
________________________________________
XRP - Small Dip Before a Big RipVery surprised at how obvious it is to read this price action on XRP, tells me there's a lot of attention/people and volatility involved with this.
Expecting to finish a small wave 4 before a decent breakout.
Overall Wave-Count Confidence: Average

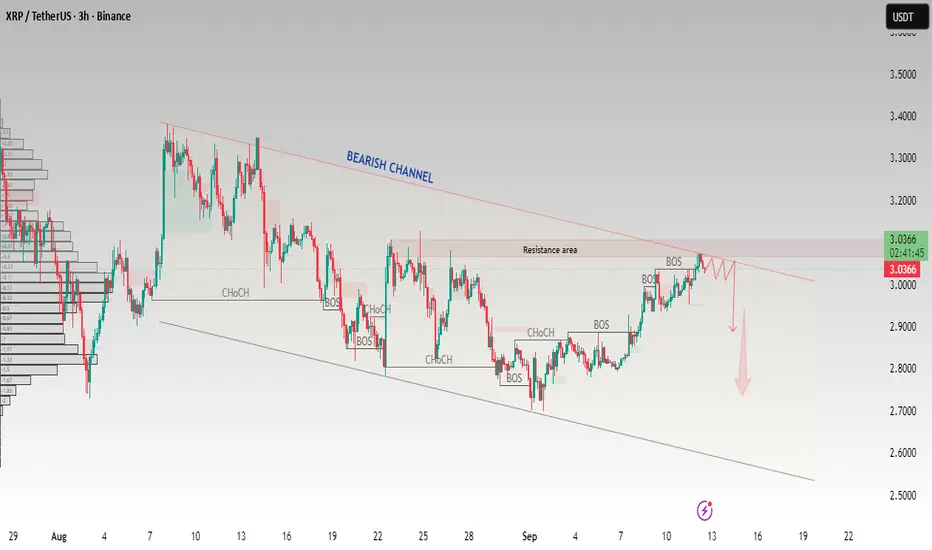
XRP/USDT – Testing Resistance Inside Bearish ChannelXRP is trading within a clear bearish channel and has reached the resistance area near 3.05 – 3.10. Price is showing rejection signs from the upper boundary of the channel, which may trigger a downside move if sellers hold control.
Key Points:
Bearish channel structure in play
Resistance zone: 3.05 – 3.10
Potential rejection at channel top
Downside target zones: 2.90 and below
This setup favors bears as long as XRP remains below the channel resistance. A confirmed breakout above resistance would invalidate the bearish view.
This analysis is for educational purposes only and does not constitute financial advice. Trading cryptocurrencies carries high risk; please trade responsibly and use proper risk management
XRP Price Eyes $3.75 on Bullish Chart BreakoutBINANCE:XRPUSDT price is trading close to $3.10, pressing against the neckline of an inverse head-and-shoulders pattern. This is one of the strongest reversal signals in technical analysis. The neckline sits around $3.21, and if BINANCE:XRPUSDT closes a daily candle above it, the breakout would confirm a bullish setup.
The height of the pattern, measured from the $2.69 head to the $3.21 neckline, projects a move of about $0.54. Adding that to the neckline gives a target near $3.75, which would be a fresh all-time high and about 21% above current levels.
Key support for BINANCE:XRPUSDT rests at $2.94, aligned with the right shoulder, while a fall back under $2.69 would cancel the bullish case. For now, momentum is building, and the chart shows buyers have the upper hand.
Supplementary data also backs the move: long-term holders have almost stopped selling, while short-term cohorts are adding supply. Together, technicals and sentiment give BINANCE:XRPUSDT price room to climb higher.

XRPUSDT: A Long Opportunity You Can’t MissXRPUSDT is looking pretty interesting right now. The price has broken through the nearest resistance level and has come back to retest it. Classic breakout and retest setup.
The price got rejected from that level, turning it into a new support zone. This is a solid long signal. My target is 3.3828.
What do you think?

#XRP is Approaching a Breakout | Will It Hold or Collapse? Yello, Paradisers! Is #XRP about to confirm a real breakout from months of sideways pain, or is this just another trap? Let’s dissect what’s happening with precision so you’re prepared either way:
💎After weeks of compression beneath a well-defined descending resistance, #XRPUSDT is about to break out. The breakout above this key trendline is now increasing the probability of a bullish continuation, especially with the 50EMA acting as dynamic support and reinforcing the bullish pressure.
💎Currently, the price is trading around $3.00, right above the breakout zone. If the market successfully retests this descending resistance as new support and holds, this would signal strong momentum building up for the next impulsive leg.
💎If that happens, the first upside target is the moderate resistance level at $3.66. A confirmed break above that could send #XRPUSD toward the strong resistance near $4.17, which aligns with the upper boundary of the visible volume profile.
💎On the flip side, the support zone between $2.69 and $2.48 now becomes critical. A retracement into this area could provide a high-probability bounce, but any breakdown and daily close below $2.4849 would invalidate the current bullish setup. In that case, price could unwind sharply, as the bullish structure would be broken, and sellers could regain control.
Stay patient, Paradisers. Let the breakout confirm, and only then do we strike with conviction.
MyCryptoParadise
iFeel the success🌴

XRPUSD → Will the rate meeting be a bullish driver for altcoins?BINANCE:XRPUSDT.P is consolidating above the previously broken boundary of the descending triangle formed within the bullish trend. Important news is ahead—the Fed's meeting on interest rates, which is highly likely to become a bullish driver for the cryptocurrency market.
The daily structure of the XRP market looks promising. The price is not updating global lows, is staying within the boundaries of the uptrend, and at the same time is breaking through the resistance of the downward correction, trying to consolidate above the fairly strong support level of 2.9535. But the market is waiting for a driver, namely fundamental background. If this background strengthens after Powell's speech, Bitcoin and altcoins may strengthen, including XRP. However, the fundamental background largely depends on the overall mood of the Fed and its comments. The market has already priced in an interest rate cut, as this is predictable given the economic data. But traders will be watching Powell's tone and how dovish or hawkish his view of the situation is.
Support levels: 2.9535, 2.8853
Resistance levels: 3.0577, 3.155, 3.359
Technically, at the moment, I am considering a scenario of a retest of support and the formation of a long squeeze at 2.9535 - 2.8853 against the backdrop of increased news volatility (manipulative nature). However, if this does not happen, the focus will be on 3.0577, and a close above this level could trigger further growth.
Best regards, R. Linda!

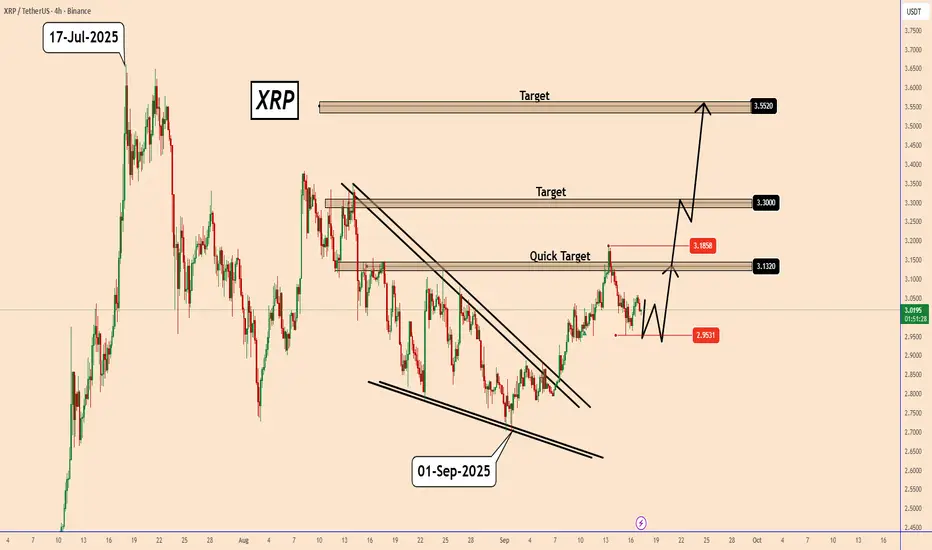
XRP Analysis – Watching Key Levels Ahead of FOMCXRP Analysis – Watching Key Levels Ahead of FOMC
As per our previous analysis, XRP broke through the first target and reached 3.18. The bullish move was followed by a sharp correction down to around 2.95.
Today, XRP confirmed another bullish pattern. If it holds ahead of the FOMC meeting, the price could rise again in line with our earlier forecast.
⚠️ Trading during major events is very risky, don’t forget that.
I’m watching the next key targets: $3.13, $3.30, and $3.55.
You may find more details in the chart!
Thank you and Good Luck!
❤️PS: Please support with a like or comment if you find this analysis useful for your trading day❤️
Should be a big moveXRP is attempting to breakout of a falling wedge on the daily TF
Could be a big move towards 4.00
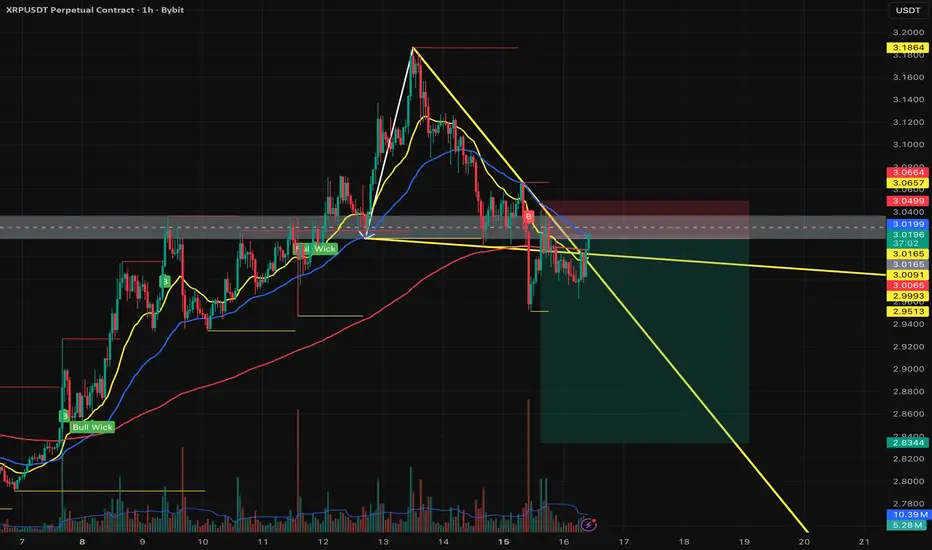
On the other side…
A head and shoulders is forming on the 4h and 1h
Could be a big move towards 2.65-2.70
Macro event this week could be the catalyst for either move.
Wednesday, 2:00pm EST FED 😬

XRPUSDTThis appears to be a favorable buying opportunity, as the asset has established a well-defined support level. The stability demonstrated at this zone reduces downside risk and provides a solid foundation for potential upward movement.

Another Triangle on the Radar - XRP - are we going down?Alright traders 👋, here’s another triangle setup I’m watching. Hopefully this one breaks the right way and gives us a nice move!
💤 The crypto market could really use a little cooldown period – and this trade might just fit into that scenario.
As always, let’s see how it plays out. Trade safe & good luck! 🍀
XRP Daily Chart – Bullish Breakout & Trade PlanTrend Structure: Price has broken above a long-term descending resistance line and is now retesting it as support.
Dynamic Support: Holding above the 50-day moving average, which is acting as a launchpad.
Pattern: Cup and handle formation visible — a bullish continuation setup, pending breakout confirmation.
Momentum:
RSI is holding above 50, indicating positive momentum.
MACD is above the signal line with a green histogram, suggesting bullish pressure.
Volume: Currently average — a breakout with higher volume would add conviction.
Catalyst: Potential ETF-related news could accelerate price action in either direction.
Support Strength: Strong base; would require significant selling pressure to break.
🎯 Trade Plan
Bias: Bullish, but awaiting breakout confirmation.
Entry Trigger
Aggressive: Enter on current support hold above 50 MA with tight stop.
Conservative: Wait for a daily close above the handle’s resistance (~$3.17–$3.18) with increased volume.
Targets
First Target: $3.17–$3.18 (handle breakout zone)
Second Target: $3.34 (measured move from cup and handle)
Stop-Loss
Below $2.79 (beneath retest zone and 50 MA) to protect against false breakouts.
Risk Management
Risk 1–2% of capital per trade.
Adjust stop to breakeven once first target is hit.
Notes
Watch for volume confirmation on breakout.
Be mindful of ETF news timing — could cause volatility spikes.
If price fails to hold the 50 MA, reassess bullish bias.

XRP/USDT – Technical & Fundamental AnalysisXRP/USDT – Technical & Fundamental Analysis
Fundamentals:
Ripple is gaining momentum as the SEC case eases, partnerships in Asia expand, and new XRPL upgrades support tokenization and smart contracts. Institutional interest is growing, which could strengthen XRP’s position further. However, regulatory changes and overall crypto market volatility remain key risks to monitor.
Technicals:
XRP previously formed a series of lower highs (LH) until reaching the major support zone at 2.6800, completing a descending triangle. After breaking the trendline, a change of character was observed around the 3.0000 level, signaling potential bullish reversal.
Price action suggests waiting for a liquidity hunt below the zone before anticipating another breakout to the upside.
Trade Setup (4H Chart):
Entry (Buy Stop): 3.0540
Stop Loss (SL): 2.8830 (below liquidity zone)
Take Profit 1 (TP1): 3.4000 → Risk:Reward ≈ 1:2
Take Profit 2 (TP2): 3.6530 → Risk:Reward ≈ 1:3
Outlook:
The setup favors a bullish continuation if price confirms the liquidity grab and reclaims higher levels. Traders should remain patient for confirmation before scaling positions.
📌 Disclaimer: This is not financial advice. Always wait for confirmation before entering trades. Manage your risk and trade with discipline.

XRP AGAIN!!!Hello friends
As you can see, the price had a price action gap that has now come and filled this gap and this area has become a strong support that if this area is maintained, we will go for higher targets and if the price falls further in the two support areas, we can buy in steps with capital and risk management.
*Trade safely with us*

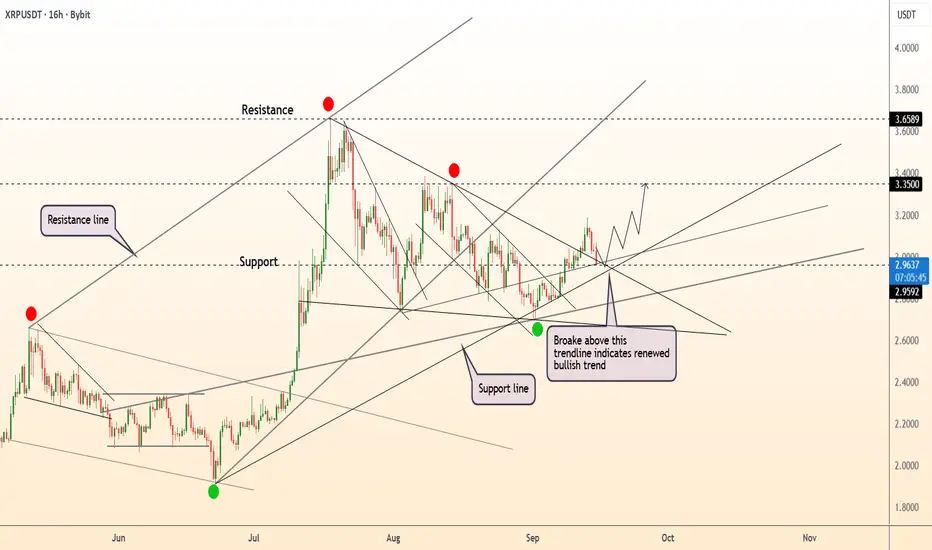
DeGRAM | XRPUSD is testing the support📊 Technical Analysis
● XRP/USD broke above the descending trendline, signaling renewed bullish structure and confirming support near 2.95.
● Price is coiling for continuation, with upside targets at 3.35 and potentially 3.65 if momentum extends.
💡 Fundamental Analysis
● Optimism for altcoins is supported by improved market liquidity and steady institutional inflows, while XRP’s active participation in cross-border payments continues to bolster adoption outlook.
✨ Summary
Bullish above 2.95; targets 3.35 → 3.65. Invalidation on a close below 2.95.
-------------------
Share your opinion in the comments and support the idea with a like. Thanks for your support!
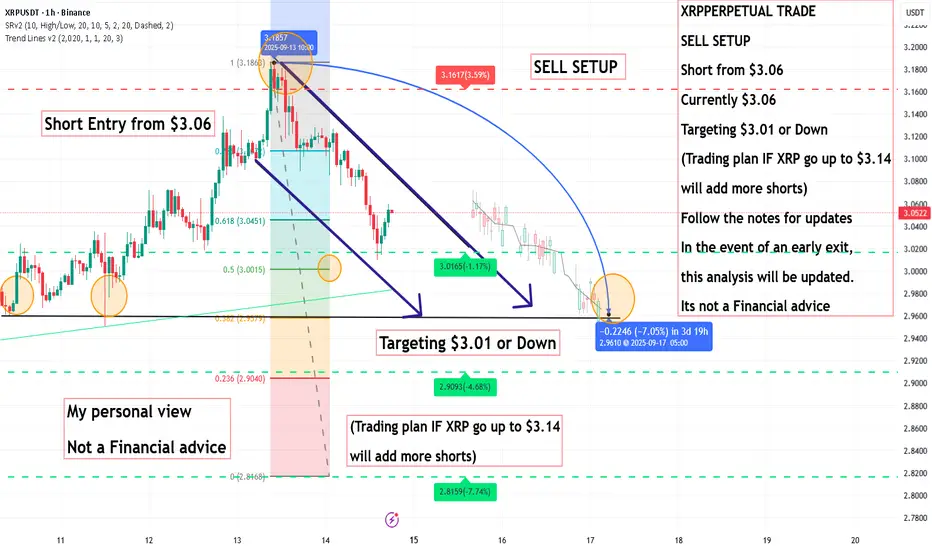
XRP PERPETUAL TRADE SELL SETUP Short from $3.06XRP PERPETUAL TRADE
SELL SETUP
Short from $3.06
Currently $3.06
Targeting $3.01 or Down
(Trading plan IF XRP go up to $3.14
will add more shorts)
Follow the notes for updates
In the event of an early exit,
this analysis will be updated.
Its not a Financial advice
DeGRAM | XRPUSD reached the support📊 Technical Analysis
● XRP/USD is stabilizing above 2.72 support, showing reversal signs with higher lows forming near the channel base.
● A breakout over 3.00–3.20 would confirm renewed bullish momentum, opening the way toward 3.53 resistance and potentially higher.
💡 Fundamental Analysis
● Positive sentiment is reinforced by growing institutional flows into altcoins, with XRP seeing increased derivatives activity and improved liquidity on major exchanges.
✨ Summary
Bullish above 2.72; targets 3.20 → 3.53. Invalidation on a close below 2.72.
-------------------
Share your opinion in the comments and support the idea with a like. Thanks for your support!

ANALYSIS FOR XRP/USDT Recently XRP have been in a pullback after an uptrend, the pullback happened so fast but now it seems to have slowed down. The price seems to have a small halt to the down trend, though to the lowest swing low of the whole uptrend move to the highest swing high drawing a Fibonacci retracement, the price is yet to hit the 50% or the 61% levels which are considered best levels of Fibonacci. We might see a reversal from here and by doing that the XRP will be on track to the moon. let's wait and see, still i remain bullish about the price of XRP. At the second lowest swing low of the uptrend if you draw a Fibonacci retracement the price is in a perfect golden zone of 61%
