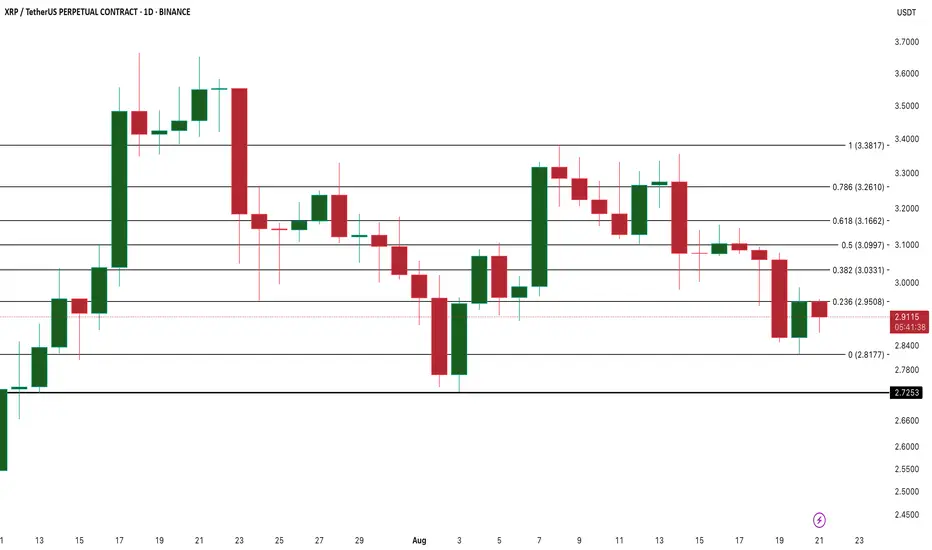
XRP Price Tests $2.81 as Whale Inflows and Chart Rejection BuildBINANCE:XRPUSDT XRP’s price remains stuck in a bearish structure despite a minor intraday bounce. The $2.95 level continues to act as a stubborn resistance on the daily BINANCE:XRPUSDT chart, while key support at $2.81 is now under pressure. If this support breaks, price could swiftly slide to $2.72—last seen during early August dips.
The latest whale inflow data confirms short-term distribution. Over the past 5 days, whale deposits to exchanges rose 7x—from 900 XRP to 6,293 XRP—signaling intent to offload. Historically, similar inflow spikes preceded sharp price drops, including the recent $3.09 to $2.76 slide.
On the technical side, a third 4H EMA death cross is forming, with the 50-EMA about to break below the 200-EMA. While crossover lag signals trend confirmation, the more critical clue is price action itself: lower highs, failure to reclaim $3.16, and weakening support.
Until $3.16 is reclaimed, the short-term trend remains down, and traders should watch $2.81 for immediate directional cues. Any bounce without volume or a whale retreat could be short-lived.
XRPUSDT.5L trade ideas
XRP: Calm before the storm!Keep an Eye on XRP
Now is the time to watch XRP. If the price breaks to the upside, we could see a significant move that might take it above $3.57!
Trading Setup
If you’re considering trading XRP, here’s a quick setup that may help you.
The idea is: Buy when the price breaks above $3.35 and take profits at the levels shown in the chart.
Targets:
1. $3.4
2. $3.48
3. $3.57
-------------------------------------------
About our trades:
Our success rate is notably high, with 10 out of 11 posted trade setups achieving at least their first target upon a breakout price breach (The most on TW!). Our TradingView page serves as a testament to this claim, and we invite you to verify it!

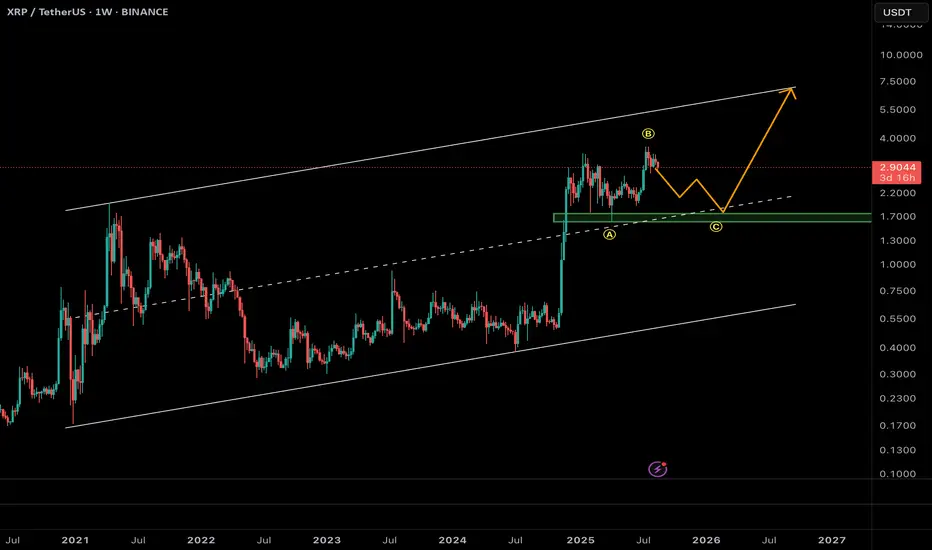
XRP – Corrective Move Before the Next Rally?XRP is currently showing signs of completing a corrective structure after its strong bullish rally earlier this year.
🔹 Technical Outlook:
• Price is trading inside a long-term ascending channel.
• After marking the swing high near $4.0, price seems to be unfolding a ABC corrective wave.
• Currently in wave C, with potential downside extension toward the midline of the channel (~$1.9 – $2.0).
• This zone also aligns with strong historical support and the 0.618 Fibonacci retracement of the last impulse (confluence area).
🔹 Possible Scenario:
1. Completion of wave C around $1.9 support.
2. Start of a major impulsive leg targeting the upper boundary of the channel around $6.5 – $7.0.
📊 Market Implication:
Short-term caution is needed as corrective pressure might continue, but long-term structure still supports a bullish outlook.
✅ Conclusion:
As long as XRP holds above $1.7 – $1.9 support zone, the bullish scenario remains valid. Mid/long-term traders may watch this level as a potential re-accumulation zone before the next impulsive rally.
Trade idea (long) on XRP/USDT (after validation)Here is a trade idea on XRP/USDT.
If the price gets over 2.5839 then pulls back on 2.5839 but keeps being over this price, then enter long with TP1 = 3 USDT.

#XRP How Long To Reach 3.31 ?#XRP
The price is moving within a descending channel on the 1-hour frame, adhering well to it, and is heading for a strong breakout and retest.
We have a bearish trend on the RSI indicator that is about to be broken and retested, supporting the upside.
There is a major support area (in green) at 2.80, which represents a strong basis for the upside.
For inquiries, please leave a comment.
We are in a consolidation trend above the 100 Moving Average.
Entry price: 2.90
First target: 3.30
Second target: 3.14
Third target: 3.31
Don't forget a simple matter: capital management.
When you reach the first target, save some money and then change your stop-loss order to an entry order.
For inquiries, please leave a comment.
Thank you.

XRP 4H – Sweep Then Breakout, or More Downside?XRP is consolidating near the 2.93 level, with price showing weakness after rejecting the 3.1–3.2 resistance block. The next move hinges on whether bulls can defend support or if sellers press lower.
Support: 2.74 remains the key downside level to watch.
Resistance: 3.1–3.2 must be reclaimed for upside continuation.
Upside Target: If reclaimed, next major resistance is 3.65.
Momentum: Stoch RSI is leaning overbought, suggesting short-term caution.
A liquidity sweep into 2.74 before reclaiming 3.1–3.2 would create a strong bullish case, but failure to hold risks continuation lower.

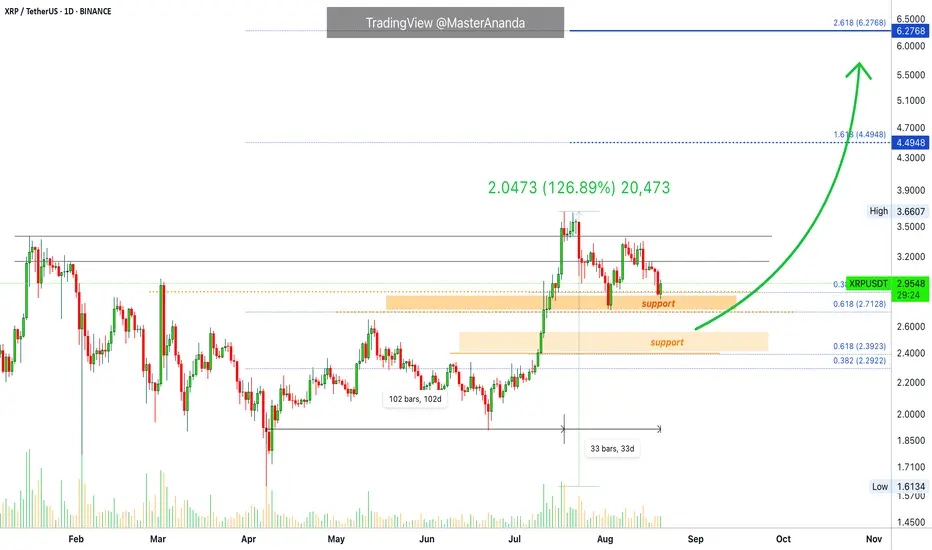
XRP · How Long To Reach $4.5 and $6.27?XRP grew as much as 127% since its 7-April low; current price action is happening above support.
Support was confirmed first on the 3rd of August, then again today a green candle appeared as soon as XRPUSDT touched the support range between $2.71 and $2.87. The low 3-August was $2.72 and the low today is $2.82.
It took a little over 3 months for XRP to grow 127%, 102 days. The current retrace has been active for 33 days, very likely reaching its end.
Based on how the chart is currently looking and overall market conditions, XRP can resume growing any day. The trick is that it can take months for a full bullish move to unravel. If growth starts today, it can still take months to see our next target reach, not $4.50 but $6.27. $4.5 should be reached short-term while $6.27 mid-term.
Thank you for reading.
Namaste.
XRP SELLXrp shows to have formed an to clear M formations with the third being the Main and the biggest on the Daily time frame.
The was a retest on the resistance zone and the bullish candle seems to be creating a a wick to form an inverted hammer candle stick. Once to closes then a sell downwards can be taken at 2.9635 and the take profit at 2.2348

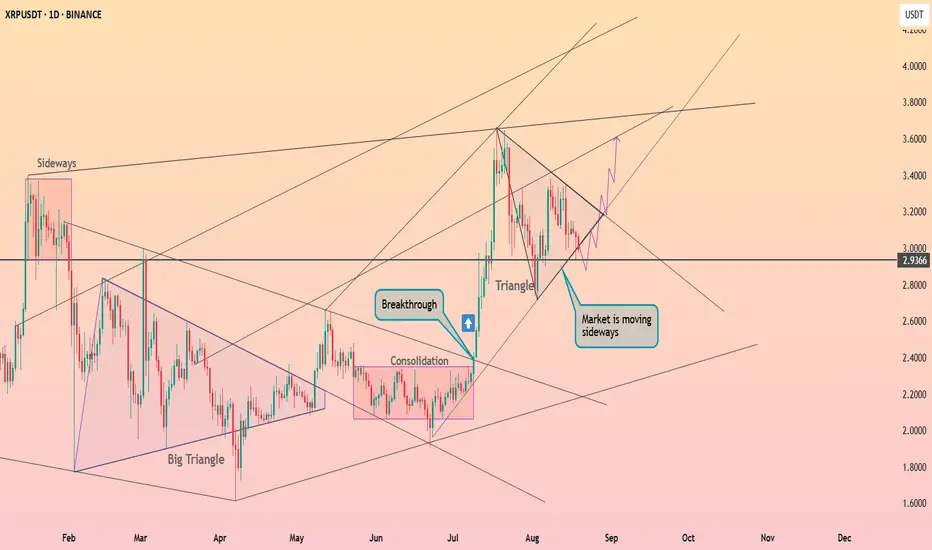
XRP is preparing to exit from the triangle ┆ HolderStatBINANCE:XRPUSDT is consolidating around $2.93 after strong breakouts from previous triangles. Sideways action dominates, with breakout levels to watch at $3.20 on the upside and $2.80 as key support. Market is coiling for next move.
Lingrid | XRPUSDT Long Potential In Range Bound MarketBINANCE:XRPUSDT is bouncing from major support near 2.80 after defending the structure and rejecting further downside. Price action shows a descending triangle interacting with the downward trendline, while still respecting the higher-low support base. If buyers maintain control and a breakout over the trendline occurs, XRP could extend toward 3.35 and potentially 3.65. Overall momentum suggests consolidation transitioning into a bullish rebound setup within the broader corrective channel.
📉 Key Levels:
Buy trigger: Rejection and hold above the descending trendline
Buy zone: 2.80–2.85 support area
Target: 3.35 first objective, 3.65 secondary objective
Invalidation: Close below 2.70
💡 Risks:
Failure of trendline breakout could keep price trapped under descending resistance.
Broader crypto sentiment weakening, dragging XRP lower despite support.
Upcoming macroeconomic data (e.g., USD strength) affecting overall risk sentiment.
If this idea resonates with you or you have your own opinion, traders, hit the comments. I’m excited to read your thoughts!

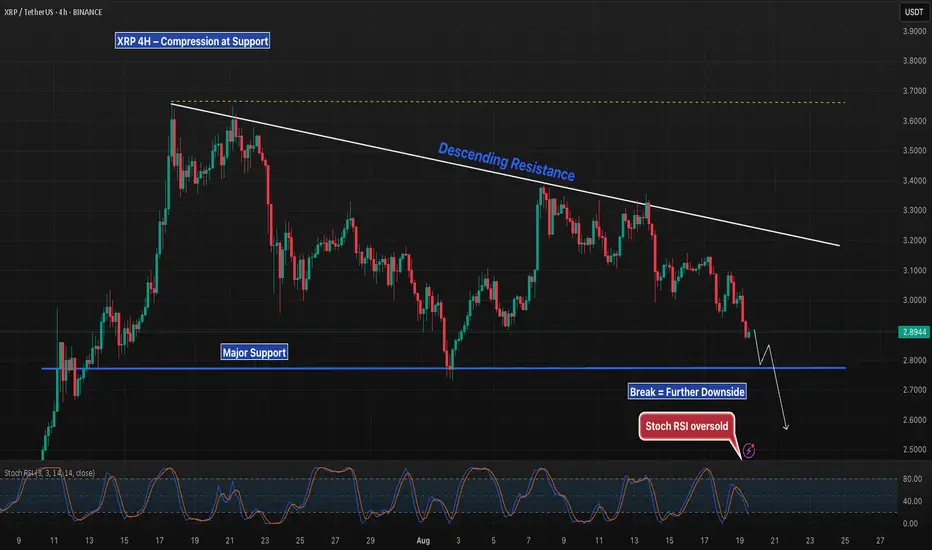
XRP 4H Descending Resistance vs Support, Which Breaks First?XRP is tightening between a long-standing descending resistance and a major support zone around $2.82. Price is pressing lower, but momentum is stretched with Stoch RSI oversold.
Holding support could set up a squeeze toward $3.20+.
A breakdown would confirm bearish continuation, opening downside into the $2.70s.
This is a classic compression setup — the resolution of this range will likely decide the next trend move.
Weekly trading plan for XRPAt the moment, the price is near the first support level and is already reversing from the monthly pivot point. The key level for this week is 3.14 , which is very close to the resistance zone.
If this key level is successfully broken, we can expect growth toward the second resistance at 3.36 , with a possible continuation to the third resistance at 3.50 .
If the price fails to break the weekly pivot point, we could see the downtrend continue toward 2.78 .

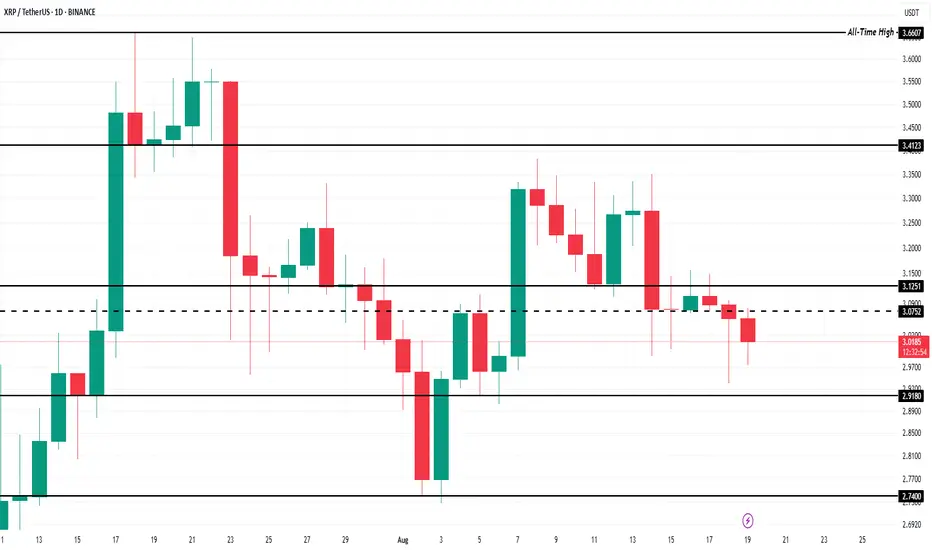
$950 Million XRP Moved Off Exchanges – Price Impact ExplainedBINANCE:XRPUSDT current price is at $3.01 after losing the support at $3.07. The decline in price is largely due to a lack of bullish momentum, compounded by broader market negativity. Without a clear catalyst, XRP might face further consolidation as the market waits for stronger buying signals.
Investors are still actively accumulating BINANCE:XRPUSDT , as reflected in the declining exchange net position. The indicator currently sits at a 5-month low, signaling net outflows from exchanges. In the past week alone, over 312 million XRP worth approximately $950 million has been bought by holders, showing optimism toward the asset's potential recovery.
In the coming days, BINANCE:XRPUSDT may test the $2.91 support level , marking a potential 2-week low. A drop below this level is unlikely, suggesting that this range could act as a temporary consolidation zone. As long as the price holds within this range, the market may await clearer direction.
However, if BINANCE:XRPUSDT reclaims the $3.12 support , the cryptocurrency could recover its recent losses. This would depend on continued accumulation by investors, as well as sustained optimism for a price rebound. Only with this renewed interest would XRP be able to push for higher levels.
Still in playThe IHS on the 4hr is still in play. XRP had a retest of support around 3.00 and 2.65 is in play still as well. Macro events may push price.
If the IHS plays out look for ATH. My tgt is 4.00
If price breaks down I’m looking at 2.96 and if support breaks targeting 2.65
Not financial advice just the inner workings of a hamster 🐹 🧠

Buy side!Hey all as you see it is an AODMS LFTs' Trap. you can be sure to enter a buy position (wink)

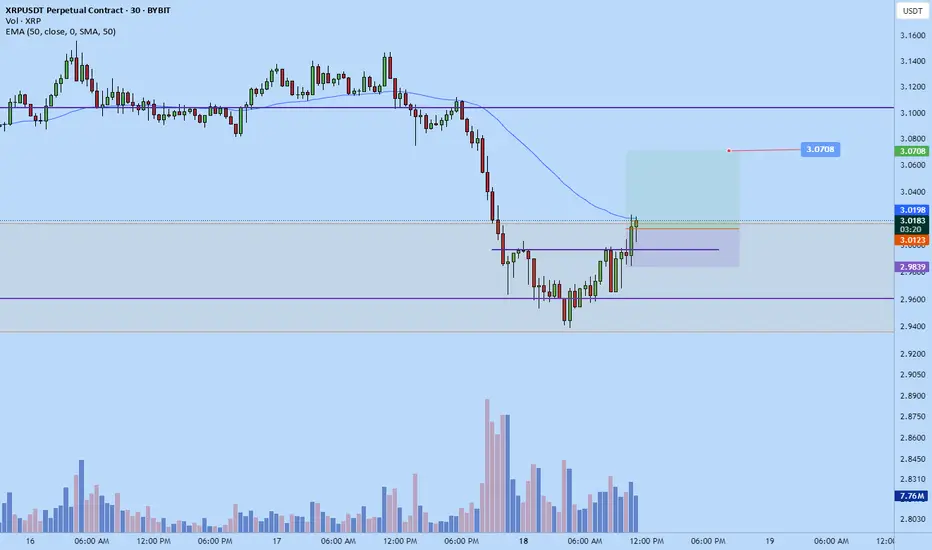
Xrp scalp long to $3.0708Just now opened a long position on xrp. Aiming for 3.0708
Sl: 2.9839
Roughly 2 RR from my entry

Xrp long idea triple reasonsTriple reason xrp is retest 1fair value gap and order block retest 0.618 check lvl 1D head and shoulder pattern test to pass xrp go to all time high now

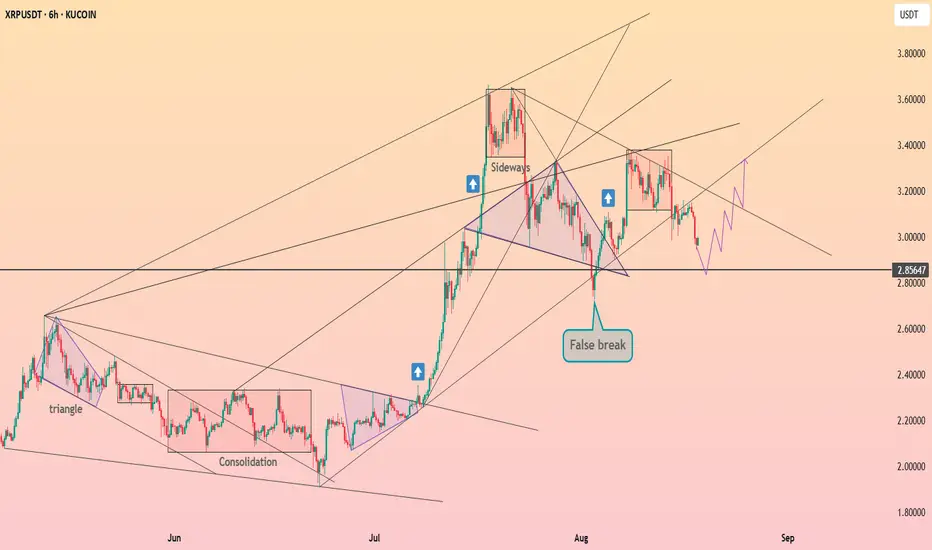
XRP is trying to hold $3 ┆ HolderStatKUCOIN:XRPUSDT on the 6h chart shows a false breakout followed by a correction toward 2.85 support. Sideways and triangle formations remain visible, indicating consolidation. A rebound from this zone could extend gains toward 3.20–3.40.
XRP Pullback Play — 0.786 Fib Meets Sell-Side LiquidityXRP is currently in a pullback phase. The next high-probability long setup is at the 0.786 Fibonacci retracement, aligning with a Sell-Side Liquidity (SSL) zone.
🟢 Long Trade Setup
Entry Zone: 0.786 retracement
Stop-Loss: Below $2.80
Take-Profit 1: $3.00 (mOpen)
💡 Educational Insight
Sell-Side Liquidity (SSL) represents the pool of stop-losses and pending buy orders resting below recent swing lows. Price often seeks these liquidity pockets before reversing.
The 0.786 retracement aligns with this SSL zone, creating a high-probability setup.
However, confirmation should come from order flow → monitoring absorption, delta shifts, or footprint imbalances at this level will validate whether buyers are stepping in before entering.
🔍 Indicators used:
DriftLine — Pivot Open Zones → For identifying key yearly/monthly/weekly/daily opens that act as major S/R reference points
➡️ Available for free. You can find it on my profile under “Scripts” and apply it directly to your charts for extra confluence when planning your trades.
_________________________________
💬 If you found this helpful, drop a like and comment!

Ripple's new patent US10902389B1Ripple's new patent, the correct number of which is US10902389B1 and titled Network computing system executing programmatic adapters to implement asynchronous communications, could help maintain the bullish trend in this cryptocurrency.

XRP LONG SETUP INTRADAY ( 17 AUG 2025 )Entry Details:
Entry: 3.1137 $ - 3.1400 $
Target Price: 3.2186 $
Stop loss: 3.0758 $
BINANCE:XRPUSDT BINANCE:XRPUSDT.P BYBIT:XRPUSDT.P
Trade Ideas:
Idea is clearly shown on chart + we have some secret psychologies and tools behind this.

XRP Realistic targets without hype Dear Traders,
here the full targets for xrp , lets see how it can play out :)
