XRP: Wedge Break & Targets AheadXRP: Wedge Break & Targets Ahead
Three days ago, XRP broke out of a bullish wedge pattern, climbing nearly 7%.
While momentum may slow briefly—especially with market attention shifting toward Bitcoin—the bullish trend looks set to continue.
I’m watching for price targets that XRP has reached in the past: $3.13, $3.30, and $3.55.
The section of the chart from July 17 to September 1 reflects a broader correction phase, which adds strength and structure to the current bullish setup.
You may find more details in the chart!
Thank you and Good Luck!
❤️PS: Please support with a like or comment if you find this analysis useful for your trading day❤️
XRPUST.P trade ideas

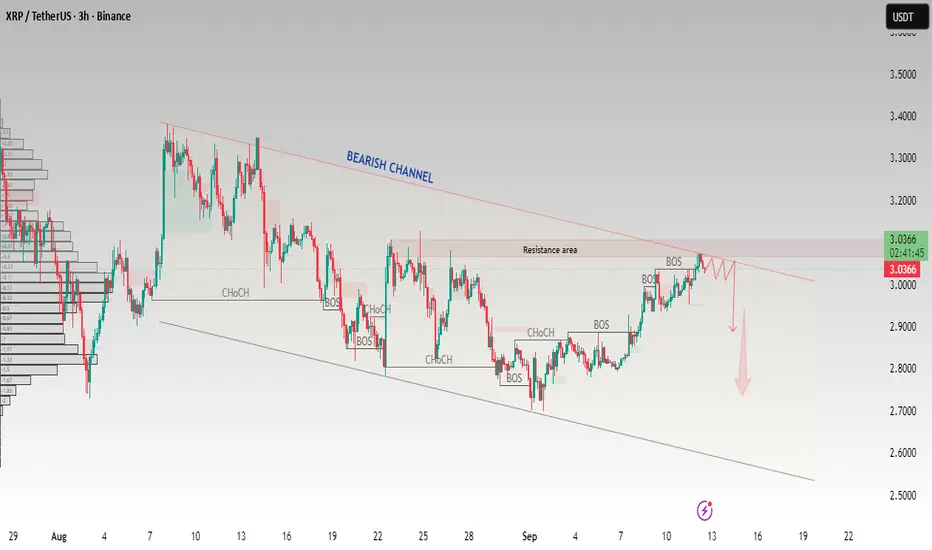
XRP/USDT – Testing Resistance Inside Bearish ChannelXRP is trading within a clear bearish channel and has reached the resistance area near 3.05 – 3.10. Price is showing rejection signs from the upper boundary of the channel, which may trigger a downside move if sellers hold control.
Key Points:
Bearish channel structure in play
Resistance zone: 3.05 – 3.10
Potential rejection at channel top
Downside target zones: 2.90 and below
This setup favors bears as long as XRP remains below the channel resistance. A confirmed breakout above resistance would invalidate the bearish view.
This analysis is for educational purposes only and does not constitute financial advice. Trading cryptocurrencies carries high risk; please trade responsibly and use proper risk management
XRP/USDT: Strong Growth PotentialXRP/USDT is currently trading in a clear upward channel, with strong support at 2.8600. The 12-hour chart shows that the price has made a strong recovery from this support level, continuing to rise and is now testing the resistance zone at 3.1100.
With EMA 34 and EMA 89 supporting the uptrend, XRP could continue to break through the nearest resistance levels and move towards 3.3300 if this momentum is maintained. If 3.1000 is broken, XRP could extend its rally towards 3.3300, creating significant profit opportunities.
With a stable upward channel structure and support at 2.8600, XRP has the potential to continue its rise. If the 3.1000 level is broken, the strong momentum will drive the price toward higher targets such as 3.3300 and 3.5000.

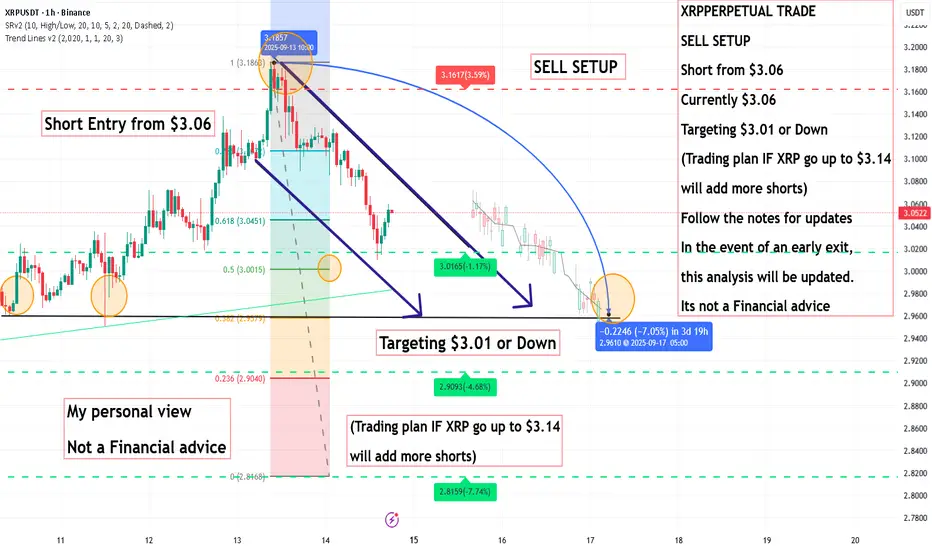
XRP PERPETUAL TRADE SELL SETUP Short from $3.06XRP PERPETUAL TRADE
SELL SETUP
Short from $3.06
Currently $3.06
Targeting $3.01 or Down
(Trading plan IF XRP go up to $3.14
will add more shorts)
Follow the notes for updates
In the event of an early exit,
this analysis will be updated.
Its not a Financial advice
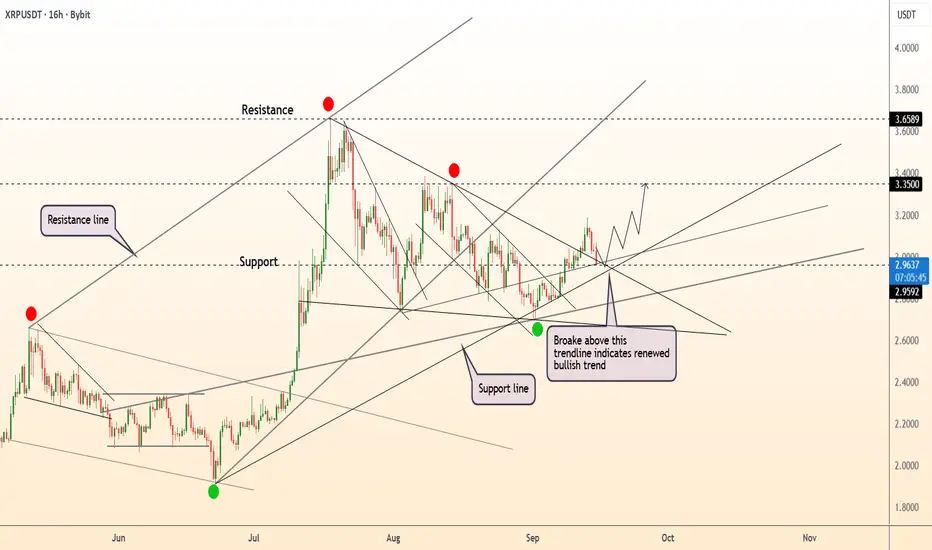
Lingrid | XRPUSDT Bullish Channel Break - Upside PotentialBINANCE:XRPUSDT has rebounded from the range zone and is now holding above the upward trendline, showing early signs of renewed bullish momentum. The structure highlights a breakout from the falling wedge pattern, suggesting potential continuation higher if buyers defend current levels. A push above 3.10 could accelerate gains toward the 3.25 resistance target, with further extension possible into the 3.37 zone. As long as the price holds above 2.90, the bias remains tilted to the upside with accumulation supporting the move.
💡 Risks:
A breakdown below 2.90 would negate the bullish setup and reopen downside toward 2.75 support.
Negative sentiment in the broader crypto market could stall the breakout and trigger renewed selling.
Regulatory pressure or legal developments tied to XRP could weigh on demand despite technical strength.
If this idea resonates with you or you have your own opinion, traders, hit the comments. I’m excited to read your thoughts!

XRP 8H – Trendline Breakout, Eyeing $3.37 ResistanceXRP has broken above its downtrend resistance line, signaling a shift in short-term momentum. Price is now approaching the $3.37 resistance zone, the key level to watch.
Upside:
Breaking $3.37 resistance opens the way toward the $3.62 liquidity pool.
Momentum is supported by the breakout structure and EMA alignment.
Downside:
If $3.37 rejects, watch the $2.74 liquidity level and Fib supports at $2.78 / $2.58.
A deeper pullback could extend to the 0.786 Fib near $2.29.
📊 Key focus: Whether XRP can secure a breakout continuation toward liquidity above, or retrace into support zones for a reset.

XRPUSDT big move is loadingXRP has break above a clear bullish pennant structure after its strong rally, and the price is now consolidating within the buyback zone. This area should act as a solid demand level to fuel the next impulsive leg upward.
The projection shows price potentially targeting $5.54 to $24.66, with the ultimate pennant breakout target near $27+.
As long as the immediate buy back zone holds, the bullish outlook remains intact. A breakout above the local resistance will open the door for the major rally continuation towards the provided targets. On the flip side, invalidation comes if the buyback zone fails to hold.
Share your thoughts on this setup do you think XRP can reach double digits in this bullish phase?

XRPUSDT-LONG IDEAXRP has tested its major support level and has broken its trendline now standing firmly above the trend line making a bullish pattern of consecutive higher highs and higher lows also the ETH is bullish which means as long as ETH is bullish it will take the alts coin with it. Overall market is bullish so you can mark your entries by doing your own research cuz what i think is gonna happen, i have putted all in the chart.

DeGRAM | XRPUSD is testing the support📊 Technical Analysis
● XRP/USD broke above the descending trendline, signaling renewed bullish structure and confirming support near 2.95.
● Price is coiling for continuation, with upside targets at 3.35 and potentially 3.65 if momentum extends.
💡 Fundamental Analysis
● Optimism for altcoins is supported by improved market liquidity and steady institutional inflows, while XRP’s active participation in cross-border payments continues to bolster adoption outlook.
✨ Summary
Bullish above 2.95; targets 3.35 → 3.65. Invalidation on a close below 2.95.
-------------------
Share your opinion in the comments and support the idea with a like. Thanks for your support!
Should be a big moveXRP is attempting to breakout of a falling wedge on the daily TF
Could be a big move towards 4.00
On the other side…
A head and shoulders is forming on the 4h and 1h
Could be a big move towards 2.65-2.70
Macro event this week could be the catalyst for either move.
Wednesday, 2:00pm EST FED 😬

XRP 2 Scenario In the Elliott Wave count for Ripple (XRP), two possible scenarios can be considered, as shown in the chart. It should be noted that the projected targets are only key PRZ levels and, except for the $11 zone, they should not be interpreted as definitive tops.
At the moment, my view is more aligned with the blue scenario, but with a slightly higher target around the $8–$9 range, mainly because we are approaching the end of the cycle.
That said, close attention should be paid to the chart structure and, more importantly, to price reactions at upcoming resistance levels.

XRP Ready for a Bullish Rally?XRP is breaking out of a descending wedge structure on the daily chart after weeks of consolidation. Price is reclaiming moving averages (50 EMA & 100 EMA), showing renewed bullish momentum.
✏️ Entry Zone: ~$3.05
✏️ Target (TP): $5.00 (major resistance from previous high)
✏️ Stop-Loss (SL): ~$2.70(below support / invalidation level)
✏️ Risk/Reward Ratio: 1:6
Key Points
- Daily structure shows a series of higher lows holding strong.
- Breakout accompanied by volume confirmation suggests buyers stepping in.
- If price sustains above the breakout trendline, momentum could extend toward $5+.
- Losing $2.70 support would invalidate the bullish setup.
Cheers
Hexa

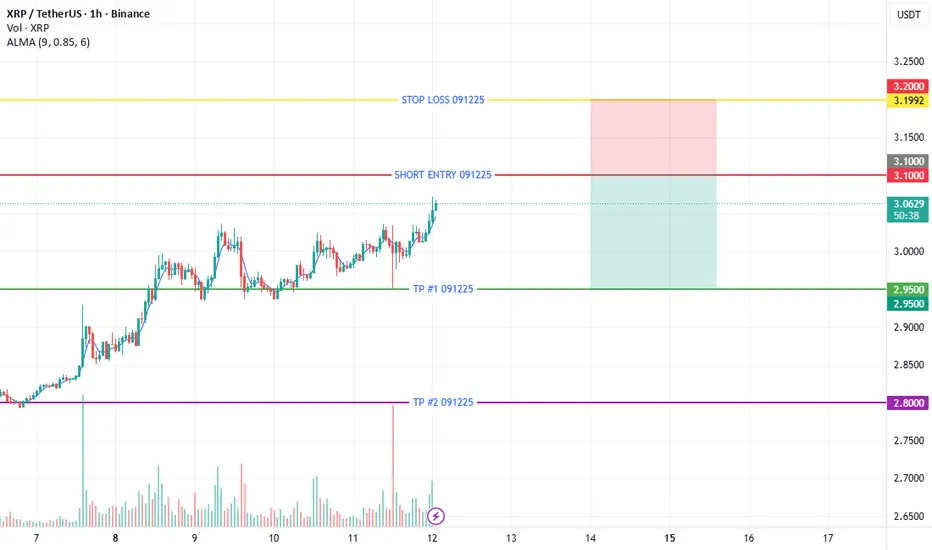
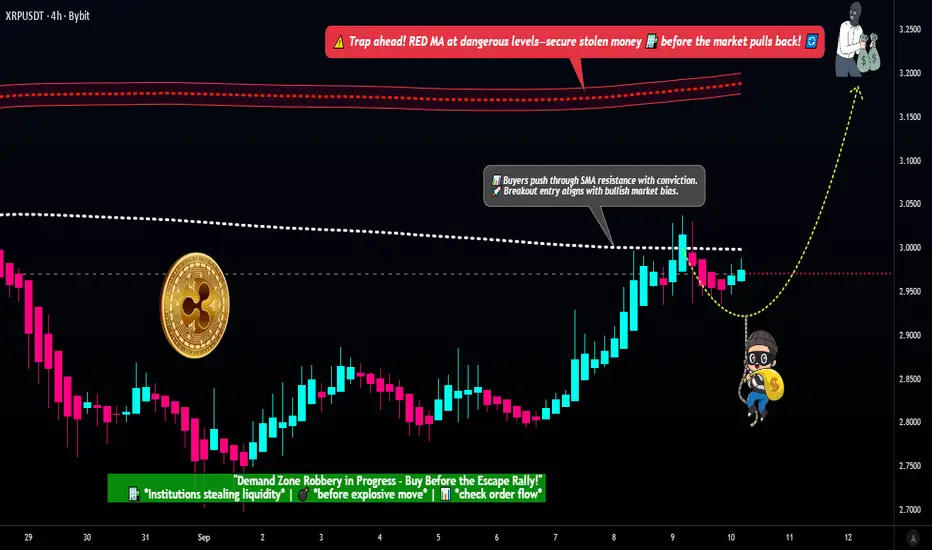
XRP/USDT — Breakout Pending! Will Thief Layers Unlock Profits?🔥 XRP/USDT "RIPPLE VS TETHER" Thief Plan (Swing/Day Trade)
🎯 Trade Setup
Plan: Bullish (Pending Order Plan)
Entry: Breakout at 328 SMA ➝ $3.0000 ⚡
🛎 Set alarm in TradingView to catch the breakout easily.
Thief Strategy = Layered Entries:
$2.9300
$2.9500
$2.9800
$3.0000
(You can increase layers based on your own strategy).
Stop Loss: Thief SL ➝ $2.8800 (after breakout). Adjust SL to your risk preference.
Target (TP): Escape before trap ➝ $3.2000.
Note: Targets & stops are flexible. Risk management is your responsibility.
📊 XRP/USDT Real-Time Data (10 Sept 2025)
Current Price: $2.97
24h Change: -1.11%
Trading Volume: High (4.4B+ XRP traded)
📈 Retail & Institutional Sentiment
Retail Sentiment (Greed 60/100)
Optimism on ETF speculation & rebound momentum.
High social/media buzz fueling greed.
Institutional Sentiment (Neutral–Cautious)
Whales accumulated 340M XRP near $3.20–$3.30 = long-term confidence.
But $1.9B liquidations since July = short-term caution.
😨 Fear & Greed Index
XRP-Specific Score: 60/100 🟢
Volatility: Greed
Volume: Greed
Whale Activity: Extreme Fear (selling pressure)
Order Book: Extreme Greed (buying demand)
Overall Crypto Market: 51/100 (Neutral)
📉 Fundamental & Macro Analysis
Fundamental Score: 7/10
✅ ETF approval speculation (Grayscale/Franklin Templeton).
✅ Ripple expanding RLUSD stablecoin into Africa.
⚠️ Risks: SEC lawsuit uncertainty + Ripple’s centralization issue.
Macro Score: 6/10
Global crypto cap $3.85T (+2.5% weekly), but under 50D avg.
U.S. inflation release = key volatility trigger this week.
🐂 Why This Thief Plan?
Bullish Case (60%)
ETF approval hype (90%+ probability).
Whale accumulation + strong institutional positioning.
Historical September strength (+87% avg. gains).
Bearish Case (40%)
Resistance failure at $3.20.
Whale sell-offs + profit taking.
Crypto-wide sentiment still neutral.
💎 Key Takeaways
High volatility expected around ETF & macro news.
Short-term breakout = fast profit chance with thief layering.
Long-term = bullish bias if ETF approvals confirmed.
👀 Related Pairs to Watch
$BTC/USD (Overall market direction)
$ETH/USD (Altcoin leader)
$SOL/USD (Key altcoin sentiment)
✨ “If you find value in my analysis, a 👍 and 🚀 boost is much appreciated — it helps me share more setups with the community!”
#XRP #Ripple #Crypto #CryptoTrading #USDT #Bitcoin #Ethereum #ThiefTrading #SwingTrade #DayTrading #Breakout #TradingView
XrpusdMonthly support 2.10 resistance is at 3.02$ this resistance has stop the 5 times . Once it break trough xrp easily goes above $4 . I think the etf approval hopefully it happens soon will be the catalyst .

1D chart | XRP/USDT – Bigger 5th Wave in Play: or WXYXZ?I’m tracking the development of the larger 5th wave for OKX:XRPUSDT , which currently has a target range between 4.0600 and 5.4003 .
My main scenario is a standard 5-wave impulse. In this case, wave 3 should extend toward 4.2766 , with the full 5th wave likely pushing deeper into the broader target zone.
The alternative scenario is a complex W–X–Y–X–Z correction. This would imply a minimum target of 3.6618 , but more realistically it should go within the 4.4348–4.9888 zone before the structure completes.
For now, I lean toward the impulsive count, but I’ll be watching price behaviour near these key levels for confirmation.
💬 Which scenario do you think is more likely to play out?

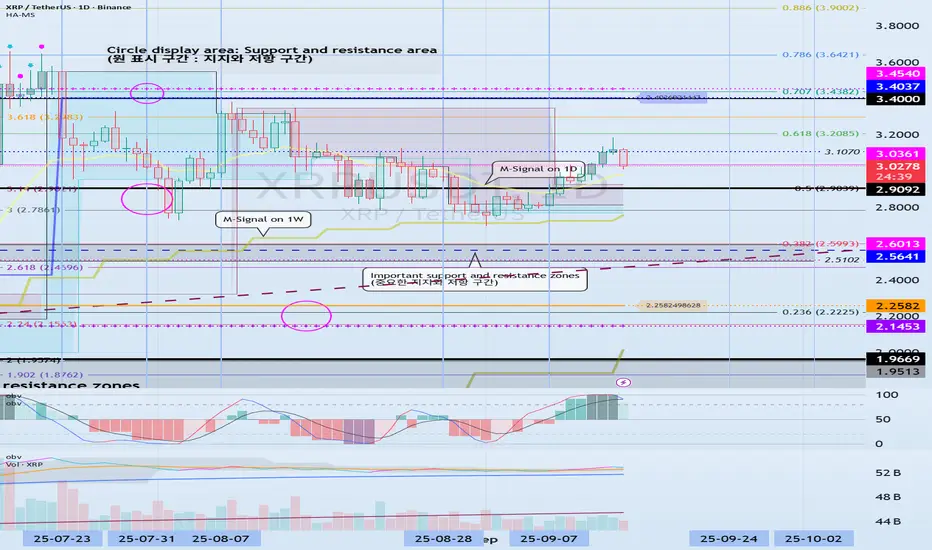
Check for support around 3.0361
Hello, fellow traders!
If you "Follow" me, you'll always get the latest information quickly. Have a great day today.
-------------------------------------
(XRPUSDT 1D chart)
The next volatility period is around September 24th.
However, we should closely monitor the movements around September 18th, which is also the volatile period for BTC.
The key is whether it can find support near 3.0361 and rise above 3.4037.
If not, we should check for support near 2.9092.
The 3.0361 level is the DOM (60) indicator point on the 1M chart. If it finds support near this level and rises, it could potentially lead to a long-term, step-like uptrend.
However, since the HA-High ~ DOM (60) range on the 1D chart is currently formed in the 3.4037-3.4540 range, a breakout above this range is expected to initiate a stepwise uptrend.
-
Thank you for reading to the end.
I wish you successful trading.
--------------------------------------------------
- Here's an explanation of the big picture.
(3-year bull market, 1-year bear market pattern)
I will provide more details when the bear market begins.
------------------------------------------------------
Potential BuyXRP/USD has a clear W formation within a trend in trends where the main structure is a clear bullish structure to the upside.
Price has already moved past the ideal point of entry and is at the conservative point(3.0127) which means that your stop loss will be a bit bigger than that which would have been at the ideal point.
TP1 is 3.5529 and tp2 is 4.3659

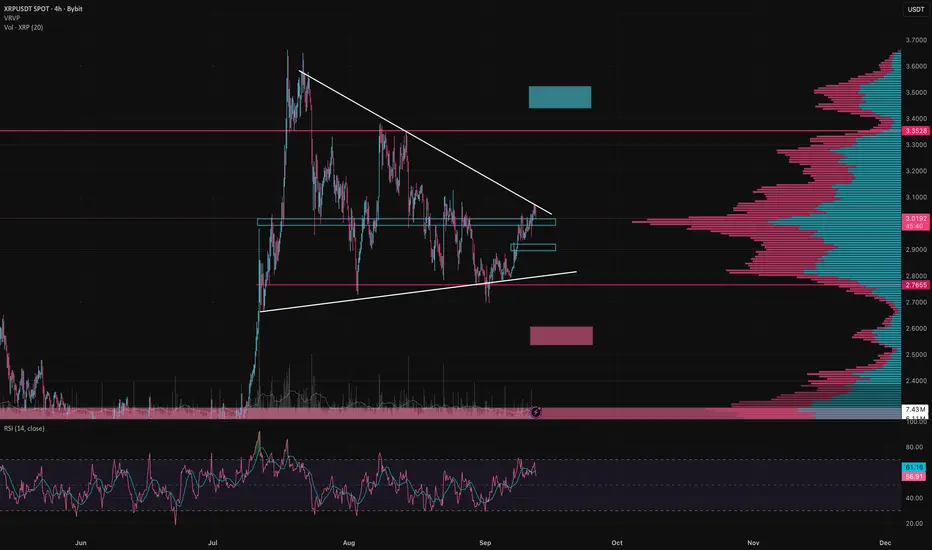
$XRP – Key Levels Before the BreakBYBIT:XRPUSDT is pressing into the upper trendline right where the 0.382 fib level meets a big volume cluster. This zone is super important to watch right now. Let’s break down the scenarios:
Bullish : breakout and close above 3.10 with strong volume → target 3.30 as the next liquidity pocket. If buyers stay powerful, we could even see 3.40+.
Bearish : rejection here and a close below 2.99 puts first support at 2.90. If that level breaks, next major zone is 2.76, and deeper down there’s a bigger demand zone around 2.53–2.60.
RSI : sitting neutral, not overheated. Market still has room to move, but without real volume a breakout won’t stick.
My thoughts: XRP is at decision time. The setup looks clean, but with weak volume I lean toward a pullback into 2.90 before any breakout can hold. If bulls show up, though, the push to 3.30 could happen fast.
Disclaimer: The author’s opinion may not align with yours
[LONG][XRPUSDT] prepare for next bull run ?XRP has likely completed its corrective phase following the recent upward movement. The price is currently supported by the 0.5 Fibonacci retracement level and the lower boundary of the triangle pattern, indicating potential momentum for a breakout above the upper boundary and a continuation into the next bullish phase.
Note: Investors should closely monitor the BTCUSDT pair. A reversal candlestick pattern is emerging, and in the absence of significant new selling pressure, BTC may confirm a trend reversal, which could trigger renewed bullish momentum across altcoins.

XRP NEXT TARGET💰 CRYPTOCAP:XRP
#XRP Very interesting setup on the chart:
A bullish flag formed right at the $3 main resistance👀
Breakout is happening now🔥
Measured target of the flag → above $4🚀

ANALYSIS FOR XRP/USDT Recently XRP have been in a pullback after an uptrend, the pullback happened so fast but now it seems to have slowed down. The price seems to have a small halt to the down trend, though to the lowest swing low of the whole uptrend move to the highest swing high drawing a Fibonacci retracement, the price is yet to hit the 50% or the 61% levels which are considered best levels of Fibonacci. We might see a reversal from here and by doing that the XRP will be on track to the moon. let's wait and see, still i remain bullish about the price of XRP. At the second lowest swing low of the uptrend if you draw a Fibonacci retracement the price is in a perfect golden zone of 61%

XRP wave5 to $4.29 Loading (ABCDE) Corrective wave near completeXRP wave5 to $4.29 Loading (ABCDE) Corrective wave near completion
we may or may not sweep the low, but the next move after will be historric. dont miss it., dont get tricked out.

Here’s a technical short (bearish) setup for XRP/USDTHere’s a technical short (bearish) setup for XRP/USDT based on current info and what looks actionable in the 15-minute / 1-hour frames:
XRP is encountering resistance in the $3.05-$3.10 zone. Multiple rejections here make it a ceiling that bears may respect.
Support is weaker around $2.80-$2.90. Losing the $2.80 area looks dangerous.
Trading volume has not been overwhelmingly bullish—momentum seems to struggle crossing resistance. Sellers appear active around those higher levels.
⚠️ Things to Watch / Risk
Must see confirmation: either a candlestick rejection (like a bearish pin-bar, engulfing, or double top) near that resistance, or a breakdown below support with volume.
If XRP instead breaks above $3.10 or $3.20 with strong volume, the short becomes invalid / risky.
Monitor broader market direction (BTC / ETH moves, macro news) as XRP tends to follow those pulls.