Daily XRP Analysis: Is XRP at an Explosion Point?As you can see on the chart, XRP is in a long-term upward trend. Recently, after a very strong upward leg, it has entered a complex correction. It has currently retraced 50% of its upward leg. We are still waiting for a trigger to activate for entry.
XRPUST.P trade ideas
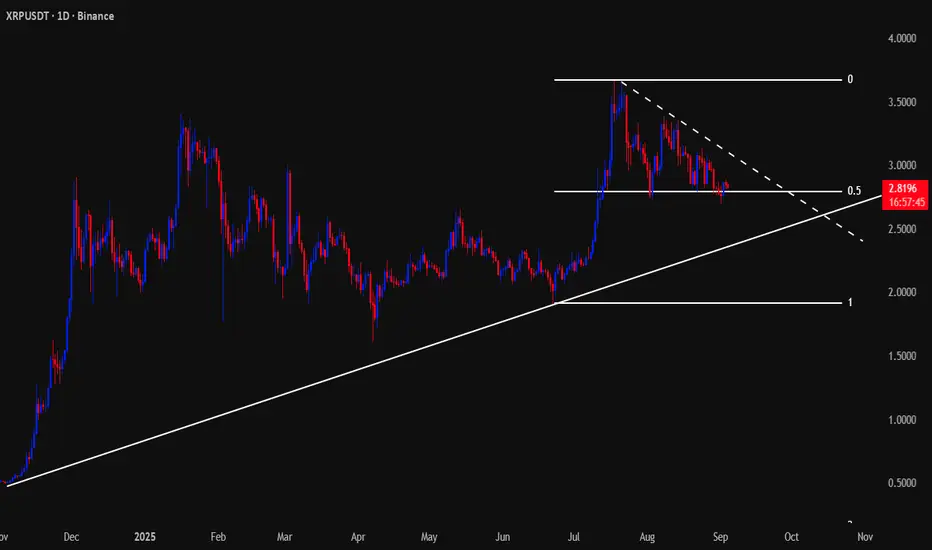
XRPusdtHi snipers. On the one-day timeframe, we are witnessing the formation of a bearish pattern. If the price breaks upward, we will probably see the price reach the specified resistances. I am learning and the analysis is not a buy or sell recommendation.

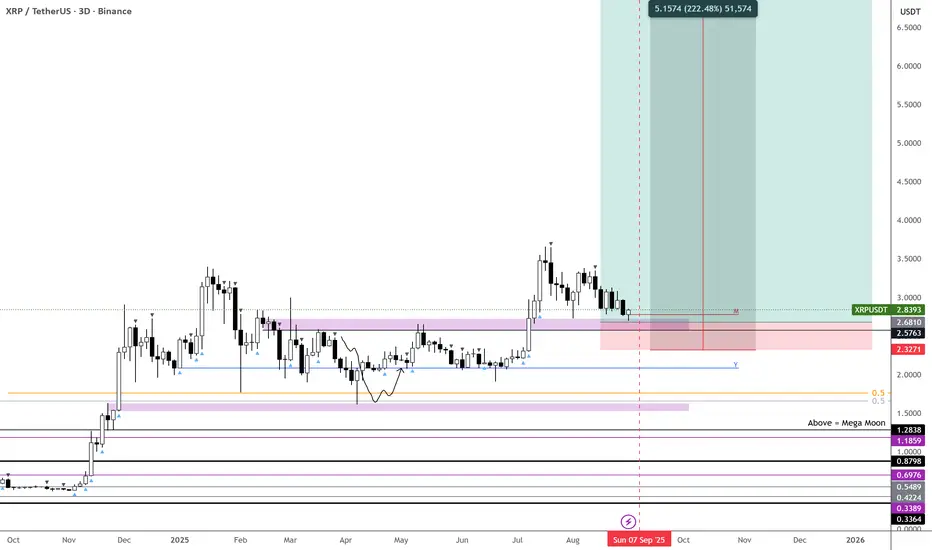
$XRP – Optimal Entry Zone
Honestly was expecting more from MARKETSCOM:RIPPLE , but it is what it is. We’re back at the second entry level — and this zone decides the next chapter.
📍 Buying zone: $2.50 – $2.70
⚠️ Invalidation: loses this level and it likely stays quiet for a while
🎯 Exit: take profits whenever it fits your plan
This is the kind of spot you want to pay attention to:
S/R flip ✅
Pivotal level ✅
Retest of breakout ✅
-30% from recent highs ✅
If you haven’t jumped into CRYPTOCAP:XRP yet, this is as good a level as it gets.
👉 Will LOL if this goes straight into $2 just to scare everyone out… only to send it into $5 on the next swing. BINANCE:XRPUSDT
XRPUSDTThis appears to be a favorable buying opportunity, as the asset has established a well-defined support level. The stability demonstrated at this zone reduces downside risk and provides a solid foundation for potential upward movement.

XRP Daily Chart – Bullish Breakout & Trade PlanTrend Structure: Price has broken above a long-term descending resistance line and is now retesting it as support.
Dynamic Support: Holding above the 50-day moving average, which is acting as a launchpad.
Pattern: Cup and handle formation visible — a bullish continuation setup, pending breakout confirmation.
Momentum:
RSI is holding above 50, indicating positive momentum.
MACD is above the signal line with a green histogram, suggesting bullish pressure.
Volume: Currently average — a breakout with higher volume would add conviction.
Catalyst: Potential ETF-related news could accelerate price action in either direction.
Support Strength: Strong base; would require significant selling pressure to break.
🎯 Trade Plan
Bias: Bullish, but awaiting breakout confirmation.
Entry Trigger
Aggressive: Enter on current support hold above 50 MA with tight stop.
Conservative: Wait for a daily close above the handle’s resistance (~$3.17–$3.18) with increased volume.
Targets
First Target: $3.17–$3.18 (handle breakout zone)
Second Target: $3.34 (measured move from cup and handle)
Stop-Loss
Below $2.79 (beneath retest zone and 50 MA) to protect against false breakouts.
Risk Management
Risk 1–2% of capital per trade.
Adjust stop to breakeven once first target is hit.
Notes
Watch for volume confirmation on breakout.
Be mindful of ETF news timing — could cause volatility spikes.
If price fails to hold the 50 MA, reassess bullish bias.

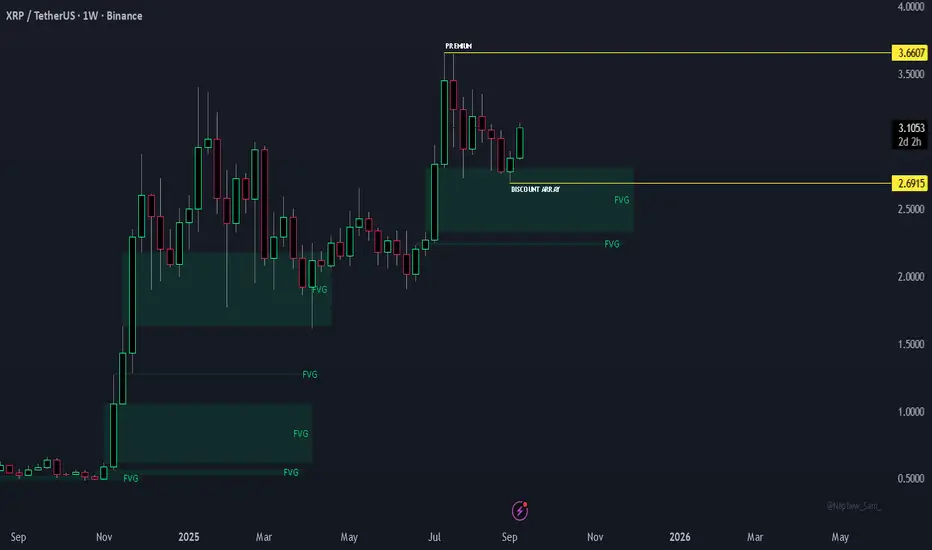
XRP/USDT Weekly Longer viewDISCOUNT ARRAY
Price bounced and respected weekly FVG - after an impressive three leg IMPULSIVE-SHIFT, that has left a WEEKLY FVG. Price seems to have found support and may possibly go higher. A gentle Sweep of the low that failed to create new WEEKLY FVG and instead becoming a new DISCOUNT ARRAY, may indicate a possible liquidity grab to push the price higher.
Target: premium.
🚩 Invalidation: You will need to manage your weekly trades on lower time-frames. No guarantees.
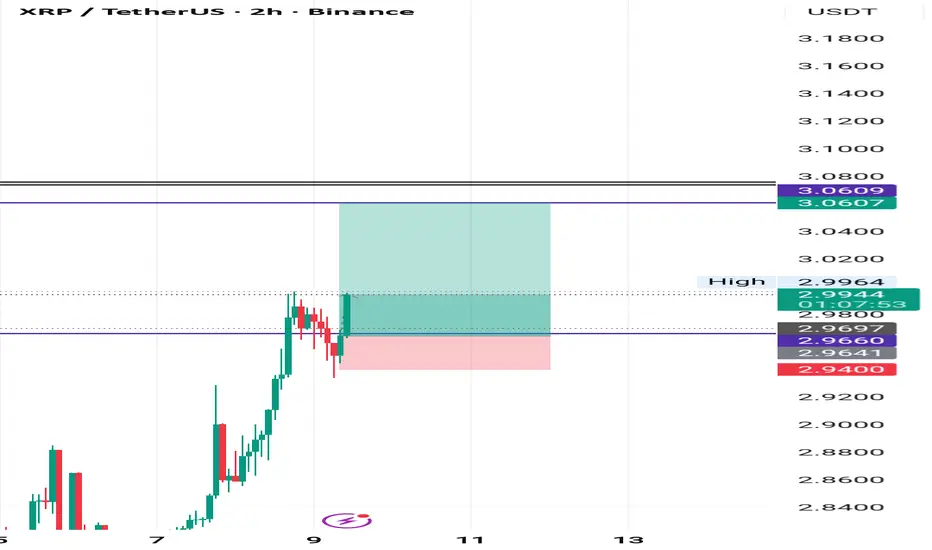
$XRP hits its INVERSE H & S target at $3.09, aiming for $3.24 ?CRYPTOCAP:XRP quick update after adding to the position yesterday, printing like mad at the moment🍾.
The first target has been hit at $3.09 and it continues above explosively towards another target (Elliot's Wave 5 target at $3.24) where i cash out 25% of this position, and another 25% at $3.34 cause this is where the falling wedge target hits.
Bullish stuff so far💙👽

XRP Up 4% as Fed Rate Cut Bets as Bulls Eye $3.00 BreakoutTitle: XRP Climbs 4% as Fed Rate Cut Bets Hit 99% — Bulls Eye $3.00 Breakout While Institutional Flows Dictate the Range
XRP extended its recent upside, gaining roughly 4% intraday as market-implied odds of a Federal Reserve rate cut surged to 99%. The move sent XRP back to the critical psychological level at $3.00, where it briefly tagged the handle before consolidating. While support has held firmly above $2.88, repeated failures near $2.99 underscore how institutional flows are increasingly dictating short-term ranges, with systematic and high-frequency participants leaning on predefined liquidity pockets. The big question now: Can bulls engineer a clean break and weekly close above $3.00 to unlock a sustained trend toward $3.30–$3.60?
Below, we unpack the macro catalyst driving crypto risk appetite, the microstructure of XRP’s order flow around $3.00, the key technical levels to watch on multiple timeframes, and how sector stories—from stablecoin settlement initiatives to real-estate tokenization narratives—might reinforce or derail momentum. We also briefly revisit the regulatory overhang and expert takes on whether the Ripple lawsuit paradoxically protected crypto market structure at a fragile moment.
1. Macro Tailwind: Fed Cut Probability at 99% Reignites Risk Appetite
• Policy backdrop: Markets now price a near-certainty of a 25-basis-point rate cut at the Fed’s September 17 meeting, according to interest-rate derivatives and futures-implied probabilities. In crypto, such a setup typically marginally lowers the discount rate on long-duration risk assets, boosts liquidity appetite, and narrows the opportunity cost of holding non-yielding tokens.
• Liquidity impulse: Crypto has historically responded positively to dovish inflections, especially when dovish signals coincide with risk-friendly cross-asset flows—softening yields, a weaker dollar, and compression in credit spreads. While a 25 bp cut is modest in isolation, the signaling effect—especially if paired with data-dependent guidance—can keep speculative positioning skewed to the upside.
• Caveat: With a 99% probability already priced, the risk of a “buy the rumor, sell the news” reaction grows. If the Fed underwhelms on forward guidance or flags stickier inflation risks, crypto could see a fast fade from local highs. That puts heavy emphasis on the path of real yields and the post-meeting press conference tone.
2. Market Microstructure: Institutions Framing the $2.88–$2.99 Range
• Range mechanics: XRP has established a resilient support shelf above $2.88, with responsive buying stepping in on each probe lower. Conversely, the $2.99–$3.00 area continues to attract supply. This behavior often reflects larger players managing liquidity with tight stop-clusters and iceberg orders near round numbers.
• Repeated failures near $2.99: Such failures typically indicate either (a) active distribution by larger holders who prefer to offload inventory into strength, or (b) systematic strategies (quant funds, HFT) sweeping micro-liquidity into offers and resetting the book to keep price contained until a new exogenous catalyst hits.
• Order book dynamics: Thick sell walls near $3.00 can be both a magnet and a lid. The magnet effect pulls price upward during risk-on waves, while the lid effect stalls rallies unless buyers are willing to consume stacked liquidity. A clean break often requires a combination of momentum ignition (positive macro headline, cross-asset tailwind) and absorption of passive offers.
3. Technical Landscape: Higher Lows Intact, $3.00 the First Gate
Intraday and hourly structure
• Trend context: XRP is trading above $2.90 and the 100-hour Simple Moving Average, keeping the immediate trend biased to the upside. A bullish trend line supports price near $2.93 (Kraken spot data), with a near-term defense zone down to $2.86–$2.88.
• Key intraday bullets:
o XRP price is facing hurdles and struggling to clear the $3.00 resistance.
o The price is trading above $2.90 and the 100-hourly SMA.
o A bullish trend line is forming with support near $2.930 on the hourly chart.
o The pair could continue to rise if it holds above the $2.860–$2.88 zone.
• Alternative micro-view: In earlier sessions, price action emphasized the $2.90–$2.92 band as an initial pivot. Dip wicks into $2.86–$2.87 have been bought, aligning with the 100-hourly SMA and trend-line confluence around $2.865–$2.93.
Momentum and RSI
• RSI stance: Hourly RSI has remained constructive, avoiding deep oversold prints even on pullbacks. That supports the “higher lows” narrative. If RSI holds above the midline on dips while price defends the trend line, bulls retain the initiative.
• Breakout momentum: A decisive hourly or 4-hour close above $3.00, followed by a successful retest holding $2.97–$2.99 as new support, would likely tilt momentum accounts long and invite fresh breakout buyers. Such a confirmatory structure reduces the probability of a false break.
Higher timeframes
• Daily chart context: The market is coiling beneath a psychological barrier. A daily close above $3.00 with expanding volume would project toward $3.15–$3.20 initially, then $3.30—a level that aligns with measured move projections from prior range widths.
• Pattern watch: A narrowing descending triangle under $3.00 has formed over recent sessions. While descending triangles are often bearish continuations, in crypto they can also resolve upward when macro tailwinds are strong. The critical tell is whether buyers keep front-running higher lows into the apex.
4. Scenario Map: Paths Above and Below $3.00
Bullish continuation (probability improves on Fed follow-through)
• Trigger: Clean 4-hour close above $3.00, ideally accompanied by rising volume and positive breadth across large-cap alts.
• Upside targets:
o $3.15–$3.20: First resistance band from prior supply and extension targets based on the local range height.
o $3.30: Key magnet if momentum persists; confluence with measured move from the $2.88–$2.99 box.
o Stretch target $3.45–$3.60: Requires continuation flow, favorable macro tone, and sector risk-on. A path to $3.60 likely needs cumulative breadth improvement and rotation from BTC or ETH dominance.
• Market structure tells:
o Flip of $3.00 to support on retests.
o Shallow pullbacks that hold the 20- and 50-period MAs on 1-hour/4-hour frames.
o Momentum divergence avoidance on RSI and MACD.
Neutral consolidation (base-building under resistance)
• Behavior: Price oscillates between $2.88 and $3.00, with volatility compressing. This can be constructive if it resolves higher. Watch for absorption at $2.92–$2.95: sustained bid depth indicates smart-money accumulation.
• Risks: Choppy stop-runs against both sides. Patience and disciplined entries near range extremes become important.
Bearish fade (news or liquidity shock)
• Triggers: Disappointing Fed guidance, risk-off in equities, or an adverse regulatory headline.
• Downside levels:
o $2.88: First defense. A clean break opens $2.86–$2.85 (trend-line and 100-hourly SMA cluster).
o $2.82–$2.80: Next liquidity shelf; loss of this area would weaken the intermediate uptrend.
o $2.72–$2.75: High-volume node from prior consolidation, potential swing-long reload zone if broader trend remains constructive.
5. Order Flow and Liquidity: What to Watch Around $3.00
• Liquidity pockets: Expect resting offers at $2.99–$3.02 and stop clusters just beyond. A burst through $3.02–$3.05 often reflects stop-fuel rather than sustained demand. The follow-through test is whether bid support appears on the first retest.
• VWAP and session profiles: Monitor intraday VWAP alignment. If price holds above session VWAP after the breakout, it signals strong participation; repeated reversion below VWAP suggests weaker conviction.
• Funding and perp basis: Elevated long funding rates without spot confirmation can forewarn of squeezes. A healthy breakout typically shows rising spot volumes and moderate-perp leverage.
6. Cross-Asset Check: Is Crypto-Wide Breadth Confirming?
• BTC and ETH: If Bitcoin holds or advances alongside XRP, breakouts tend to stick better. Conversely, a BTC pullback from resistance or ETH weakness can sap liquidity from alts and render XRP breakouts vulnerable.
• Dollar and yields: A softer DXY and benign real-yield backdrop would reinforce crypto appetite. Watch the 10-year real yield. A re-acceleration higher could cap upside in risk assets.
• Equities and credit: Positive equity momentum and stable credit spreads are supportive. Risk-off rotations often tighten crypto ranges or trigger downside wicks.
7. Narrative Catalysts: From RLUSD Payments to Real-Estate Tokenization
• RLUSD payments angle: Reports of an electric car maker tapping RLUSD for payments has refocused attention on enterprise-grade settlement rails and Ripple-adjacent stablecoin strategies. If RLUSD or similar fiat-linked tokens embed more deeply into commercial workflows, network effects could lift transactional relevance for XRP and related liquidity pools. Watch for on-chain settlement volumes and treasury adoption headlines.
• Real estate tokenization: The idea that real estate could unlock the next parabolic leg for XRP hinges on two levers: (a) tokenized asset issuance/settlement requiring high-throughput, low-cost rails; (b) institutional-grade custody and compliance frameworks. If pilot programs scale—fractionalized property claims, escrow automation, and cross-border closings—liquidity migration to chains and bridges that interoperate with Ripple ecosystem tools could grow. Concrete KPIs to track include tokenized asset market cap growth, settlement finality times, and custodial integrations with major brokers.
• Payments and remittances: Continued traction in corridors—especially where FX frictions are high—can underpin a fundamental bid for liquidity tokens. Macro volatility tends to increase remittance volumes, indirectly supportive for settlement networks if fees and speed remain competitive.
8. Regulatory Overhang: Did the Ripple Case “Save Crypto” or Just Buy Time?
• Expert discourse: Some analysts argue that the Ripple lawsuit, by forcing clarity on the application of securities laws to token distributions and secondary market activity, reduced systemic legal uncertainty at a critical juncture. The view is that the case delineated boundaries that prevented broader enforcement spillover into secondary liquidity for many assets.
• Counterpoint: Others caution that the landscape remains fragmented. Jurisdictional differences and evolving interpretations keep headline risk alive. Markets may have priced in a partial détente, but precedent is not monolithic, and appeals or parallel actions can re-introduce volatility.
• Trading implication: Regulatory catalysts tend to be binary and gap-inducing. Position sizing around major court dates and policy announcements should reflect that asymmetry.
9. Strategy Playbook: Traders’ Checklist Into and After the Fed
For breakout traders
• Entry logic: Wait for a 4-hour close above $3.00, then look for a retest of $2.97–$2.99 holding as support. Confirmation improves if the retest coincides with an intraday VWAP reclaim and rising spot volume.
• Risk: Place invalidation below the retest low or below $2.93 (trend-line confluence), depending on risk tolerance. Avoid chasing if funding spikes and spot-volume confirmation is lacking.
• Targets: Scale at $3.15–$3.20; trail remainder toward $3.30. Only pursue $3.45–$3.60 if momentum and breadth broaden.
For range traders
• Buy-response zones: $2.86–$2.88 with tight stops if trend line and 100-hour SMA remain supportive.
• Sell-response zones: $2.99–$3.00 if order flow shows absorption and lack of follow-through; cover quickly on decisive breaks.
• Tools: Footprint charts, delta, and cumulative volume profiles to gauge absorption vs. initiative buying.
For swing traders
• Thesis: As long as daily closes hold above $2.82–$2.85, the medium-term bias remains constructive. A weekly close above $3.00 turns the path of least resistance up toward $3.30–$3.60 over coming weeks, contingent on macro tone.
• Invalidations: A daily close below $2.80 suggests a breakdown from the base, opening risk to $2.72–$2.75.
10. Risk Management: Practical Guardrails
• Volatility budgeting: Size positions based on realized volatility. Consider scaling rather than all-in entries around binary macro events.
• Correlation traps: Avoid over-concentration in alts that move in lockstep. If you’re long XRP into the Fed, offset with cash or lower-beta exposures.
• Leverage discipline: Elevated funding and crowded longs can unwind fast. Keep leverage modest and stops hard, especially near psychological levels like $3.00.
• News reaction function: Predefine responses to three scenarios—dovish surprise, baseline cut with cautious guidance, or hawkish tilt. Adjust exposure automatically rather than emotionally.
11. What the Tape Is Saying Now
• Price behavior: XRP has surged through $2.88, probed $2.92, and repeatedly tested $2.99–$3.00. Each dip toward $2.86–$2.90 has found buyers, aligning with the 100-hourly SMA and ascending trend line near $2.93.
• Participation: The best breakouts in XRP historically come on broad-based alt strength and rising spot participation. Watch whether volumes cluster on green candles during NY hours; institutional involvement often intensifies then.
• Sentiment skew: Elevated expectations around the Fed cut can create asymmetry—good news may be “priced in,” while any disappointment can trigger fast downside to first supports.
12. Price Levels Summary
• Immediate resistance: $3.00, then $3.02–$3.05. A strong break above targets $3.15–$3.20 and $3.30.
• Immediate support: $2.93 trend-line, then $2.90, with a stronger shelf at $2.86–$2.88. Below that, $2.82–$2.85 and $2.72–$2.75.
• Momentum markers: RSI holding above midline on pullbacks; MACD on 1-hour/4-hour staying positive; rising OBV on rallies.
13. Frequently Asked Questions
Q: Why does $3.00 matter so much?
A: It’s a psychological round number clustered with offers, stop orders, and optionality hedging. Breaking and holding above it often forces systematic strategies to rebalance, creating momentum.
Q: How reliable is the Fed cut catalyst for crypto?
A: Cuts tend to support risk assets if they signal easier financial conditions ahead. However, when odds are near 100%, the market demands supportive guidance to avoid a fade. It’s the path of policy, not the single step, that matters.
Q: Could XRP reach $3.60 on this leg?
A: It’s possible if $3.00 flips to support, $3.15–$3.30 clears with volume, and macro remains benign. Realistically, $3.15–$3.30 is the first major test; $3.45–$3.60 would likely need follow-through and broader alt strength.
Q: How do institutional flows “dictate” the range?
A: Large players anchor liquidity at key levels, providing both buy-side and sell-side depth. They often fade extremes unless a meaningful catalyst forces them to move, resulting in repeated tests and rejections around known levels.
Q: Is the descending triangle bearish?
A: By textbook definition, yes. But crypto often violates textbook patterns when macro liquidity turns supportive. The resolution depends on who runs out of patience first—sellers defending the ceiling or buyers stepping up on higher lows.
14. Bottom Line
• The setup: XRP is coiled just beneath $3.00 after a 4–5% push, with $2.88–$2.93 acting as a dependable springboard. The hourly trend remains constructive above the 100-hour SMA, and RSI supports further upside if pullbacks stay shallow.
• The catalyst: A near-certain Fed cut anchors the macro bid, but with odds already near 99%, sustained upside likely requires reassuring forward guidance or a concurrent broad-based crypto risk-on.
• The trigger: A decisive close and hold above $3.00 is the primary unlock. If achieved, $3.15–$3.20 and then $3.30 come into view, with $3.45–$3.60 reserved for stronger momentum phases.
• The risk: Failure to clear $3.00 followed by a loss of $2.86–$2.88 would hand control back to sellers and invite a deeper test toward $2.80–$2.75.
As XRP consolidates under $3.00 and the descending triangle narrows, the next directional move will likely hinge on whether institutional sellers maintain the lid or capitulate to momentum post-Fed. Traders should remain flexible, respect key levels, and let the tape confirm the path.

XRP/USD Weekly Outlook: Bulls Eye $3.13 After ReboundPair: XRP/USD
Current Price: 3.01
Trend: Testing key resistance cluster
⸻
🔵 Market Overview
Ripple rebounded from its monthly low near $2.70, gaining ~7% in the past week. The token is consolidating above the 20- and 50-day EMA (2.91) and is now testing the heavy resistance cluster at 3.00–3.07 (horizontal resistance + descending trendline + 38.2% Fib retracement).
Investor sentiment improved on speculation of a potential SEC approval for Ripple Spot ETFs, which could drive demand.
⸻
📊 Bullish Targets
• $3.07 (breakout trigger)
• $3.13 (Supertrend, key resistance)
• $3.30–3.38
• $3.45
• $3.55–3.66
• $3.92
• $4.25 (161.8% Fib extension)
• $4.50–4.67 (max bullish zone)
📉 Bearish Targets
• $2.91 (EMA confluence)
• $2.77–2.70 (200-day EMA support)
• $2.58–2.53
• $2.43
• $2.33–2.26
• $2.17
• $2.08–1.96 (max bearish zone)
⸻
🔎 Indicators
• RSI (daily): Rebounded, close to buy signal.
• RSI (weekly): Holding bullish setup.
• Trend: Above EMA cluster keeps bullish bias, but failure under 2.70 reopens bearish case.
⸻
📈 Trading Scenarios
Scenario (Bullish Continuation)
• Recommendation: BUY STOP
• Entry Point: 3.07
• Take Profit: 3.30, 3.45, 3.66
• Stop Loss: 2.91
Alternative (Bearish Breakdown)
• Recommendation: SELL STOP
• Entry Point: 2.70
• Take Profit: 2.53, 2.43, 2.26
• Stop Loss: 2.91

XRP 1D – Trendline Holding, Liquidity Level Below at $1.78XRP is consolidating above its rising trendline while sitting near the 50 EMA ($2.91). The circled doji may have been an institutional drawdown candle, sweeping liquidity before price drove higher.
Key levels:
Liquidity pool sits lower at $1.78.
Support box: $2.60–2.70 demand zone.
EMA 200 at $2.53 acts as secondary support.
Upside: reclaiming $3.00 could drive a move back into $3.40–3.60 range.
Downside: losing $2.60 trendline support risks a test of EMA 200 and deeper liquidity grabs.
Stoch RSI near overbought signals short-term caution, but market structure remains bullish above $2.60.
📊 Key focus: Will XRP hold structure and push higher, or revisit liquidity pools below?

Number 3 is reminding the party he’s still on the guest list.Number 3 is reminding the party he’s still on the guest list. 🥂
CRYPTOCAP:XRP breaking clean from its $2.80–$2.95 consolidation base.
Push into $3.00+ signals bullish continuation if volume holds. Next test sits at $3.10–3.20.
📈 Momentum: creeping into overbought, but room for one more leg higher.
🔊 Volume: breakout backed by real buy-side conviction.
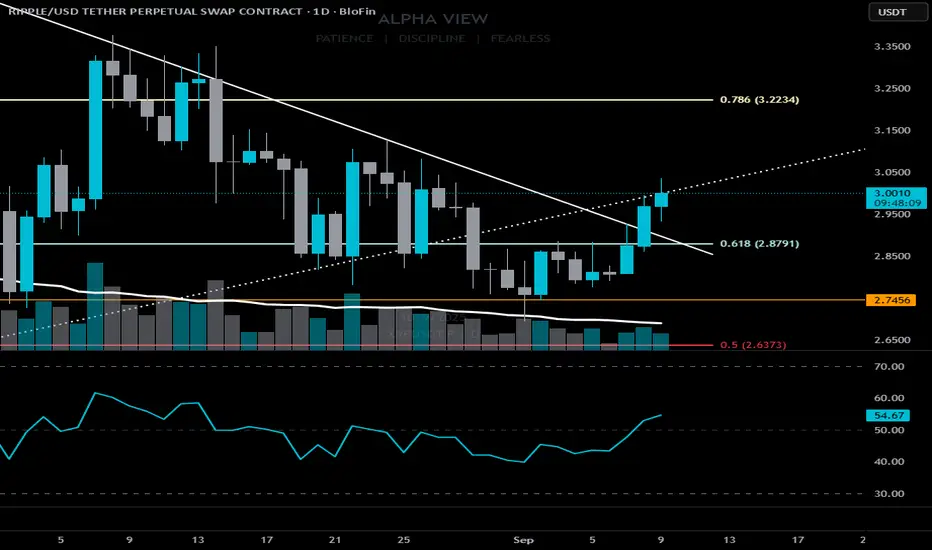
The Alpha View 👇
🎯 Setup is long, but execution requires patience:
— Ideal entry on a retest of $2.95–$2.99 (flipped resistance → support).
— Bonus confluence: a 1H bullish tail.
🎯 Targets:
TP1: $3.20–3.25
TP2: $3.40+ (runner if momentum extends)
⚠️ Don’t FOMO green candles. Precision beats emotion.
⚖️ Watch BTCЗif they stall, XRP’s move could fade.
🔑 Self-Regulate. Risk is the only guest you can control.
XRP RangeI'm looking for a reaccumulation to put in the 3rd tap of that potential HTF distribution. A local distribution, that leaves most of the liquidity above intact, followed by a slow move into either the model 1 or 2 POI's would be great. If this reaccumulation confirms/ plays out i'm watching the HTF extreme supply for a model 2 distribution, but preferably we deviate the highs again to take out all of the liquidity.

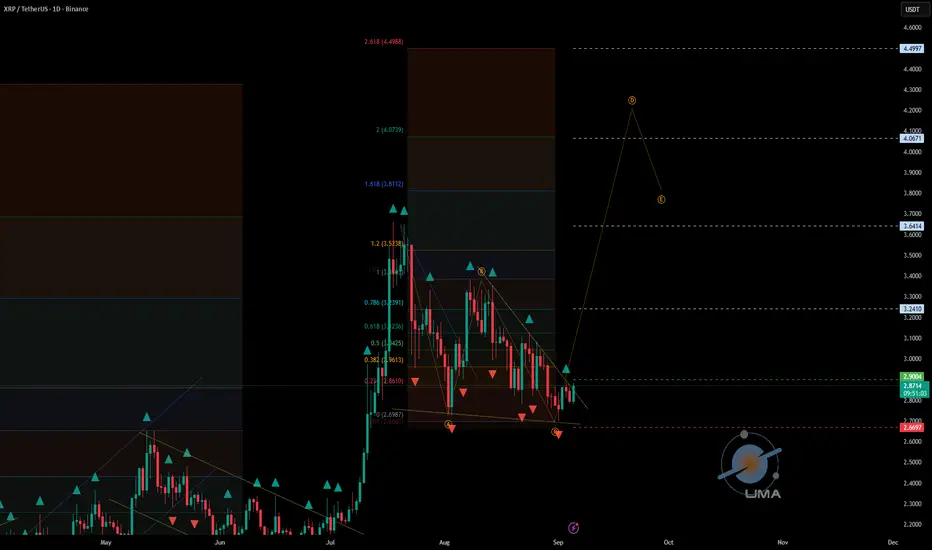
#XRPUSDT - UniverseMetta - Signal#XRPUSDT - UniverseMetta - Signal
D1 - Formation of ABC structure in continuation of the trend.
H4 - Formation of the 3rd wave + breakout of the trend line. Stop behind the minimum of the 1st wave.
Entry: 2.9004
TP: 3.2410 - 3.6414 - 4.0671 - 4.4997
Stop: 2.6697
XRP Setup – 200-Day EMA & 61.8% Fib ConfluenceAfter making a higher high in mid-July, XRP has been retracing to establish its higher low. The price is now approaching the 200-day EMA, the 61.80% Fibonacci retracement, and a key prior resistance zone around $2.60. This confluence creates a strong area where bulls may look to defend.
Trade Setup:
• Entry Zone: $2.50 – $2.60
• Take Profit Targets:
🥇 $3.10
🥈 $3.50
🥉 $3.80
• Stop Loss: $2.30

XRP Full Green Candle · Great News · Reaction at SupportXRP is looking great right now. There is nothing better than a good reaction at support.
Remember this support zone? The orange space on the chart.
This support zone has been tested multiple times since 2-Aug., a month ago. 30 days holding and this time we have the first bullish candle—full green—around this level and this means that the bulls are finally showing their face.
It is hard to believe that it has been already 45 days since the last high, but this is good because the retrace is running its course and as soon as it ends we get the next bullish wave.
More good news. The next major advance will be nothing like before. The last one lasted less than a month, the next one can go for 2-3 months or more. So at least twice the length of the previous one. There is still plenty of room available for growth.
Targets
These are the numbers based on the short-term. For the numbers we were using previously, more accurate, please find a previous publication. You can do so by going to @MasterAnanda and typing XRPUSDT on the search filter. Go a bit lower and you will see hundreds of charts with long-term targets and all-time high projections.
Thanks a lot for your continued support.
Namaste.

ETHUSDT SITTING AT STRONG SUPPORT + TRIANGLEThis has to be the absolute medium term support for ETH. Breaking of this support will lead to further downside, And if the Triangle is broken on the upside- expect a good rally in ETHUSDT.
We Bring you the most no-bs true to foundation old school real analysis to you everyday!
Genuine Questions and Comments are always welcomed :)

Weekly trading plan for XRPAt the moment, a bullish divergence is visible on the chart due to the recent quick update of the local low.
As long as the previous high isn’t broken, the price may continue its downward movement. However, if the 2.83 level breaks, I expect growth into the 2.99–3.07 range. It’s also important to watch the price action around 2.87 , as we could see a pullback from that level.

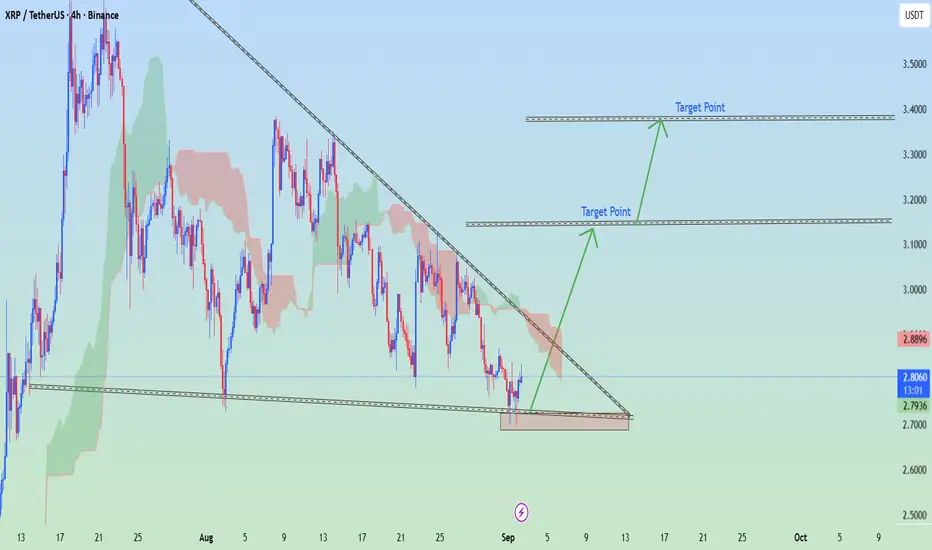
XRP/USDT on Binance (4H timeframe)XRP/USDT on Binance (4H timeframe). I drawn an ascending trendline with breakout projection arrows and labeled “Target Point”.
📌 Based on My chart setup:
Current price: around 2.28 USDT
First Target Point: ~ 3.00 USDT
Second Target Point: ~ 3.40 USDT
⚠ Key Notes:
These levels match the breakout projection my drawn.
As long as XRP stays above the rising trendline (~2.20–2.25 support zone), the bullish breakout targets remain valid.
If it breaks down below the trendline, the setup weakens and downside risk increases.
XRP LONGI have marked out the weekly range on XRP which has swept the liquidity of the last week.
As well as tapped into the weekly Bullish FVG.
This gives me confluence to long XRP as seen on the graph.
My entry lies on the body of a 30M OB.
Take profit targets and SL are visible on the chart.
Feel free to comment and ask!
Good luck and don't overtrade.

XRP — Don’t BlinkXRP at 2.92 isn’t standing strong.
The path still drags it down to 2.57 – 2.67.
Sweet spot? 2.62.
Yes, there’ll be a kick up from there… but don’t fool yourself.
It’s not a flight — just one breath before the next choke.
Remember this chart.
Later, you’ll say: “The Wolf told us.” 😉
#XRP #Crypto #WolfVision #Bearish #TradingView #PriceAction #MarketPsychology #btc #btcusd #xrpusd #xrpusdt #crypto

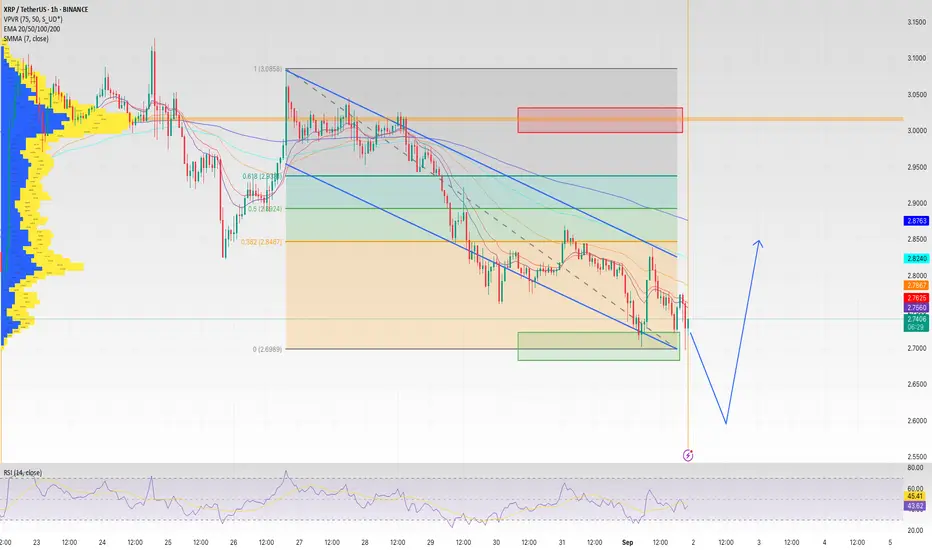
XRP: drop to $2.60 or push to $3.00?On XRP the picture’s pretty clear — we’re already breaking through that green support block, and honestly the odds of a drop toward $2.60 look high. That’s the level where I’m watching for a reaction — RSI is stacking up oversold pressure, plus we’ve got a local volume cluster lining up there.
From $2.60 I expect a bounce into the $2.82–2.85 zone. That’s where EMA and Fib levels meet, making it strong resistance. With the trend still down, I see that move more as a technical bounce, not a full reversal.
For traders the key right now is not to get dragged into crowd emotions. People will panic once support breaks, but if you wait for the $2.60 zone and watch closely for reaction, that’s exactly where a solid entry might show up.
XRP could be going to $5 if we gain and hold $1.70!Hello!
XRP has tested this monthly/yearly level before. Last time it rejected as it was the first test of major resistance. Now a couple years later we are testing $1.70 again. If we gain this level and hold, I see XRP blowing through all time highs. My yearly and monthly projections have price going to $5. Not saying it will do that, but I think there is high likely it will if we hold $1.70. I am not long as I haven't traded crypto in a couple years. I normally would never long a crypto that is up as much as XRP the past month, but the chart is looking prime for higher if we hold here on the monthly and possibly the yearly. I will update on the close of the yearly in a month.
