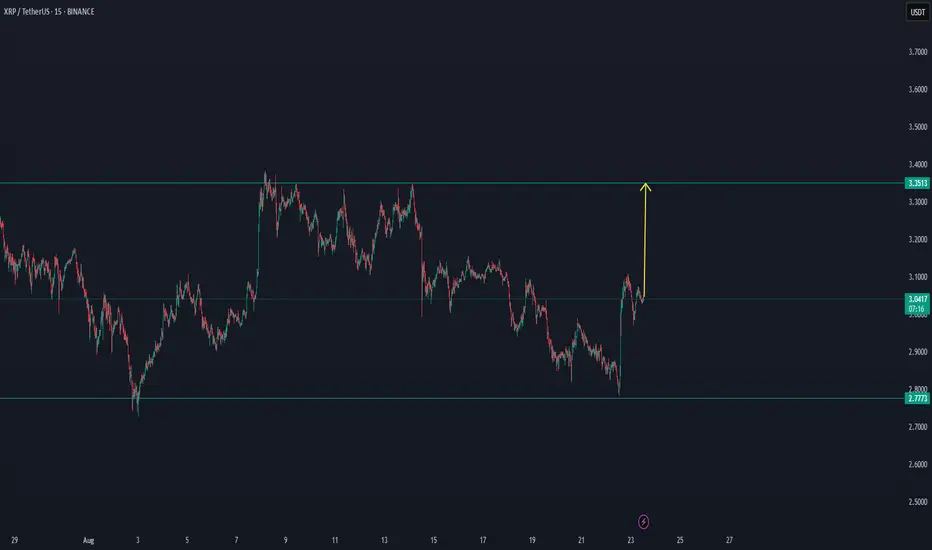
XRPUSDT:Trade 15 min FractalConsidering the Ripple chart and the fact that the majority of the movement is bearish, we can have this view, so we can expect the decline to continue even to $2.5.
XRPUST.P trade ideas

xrp long idea/classic patternI have been trading this pattern for a long time now, and I am waiting for a 3 top to form, the highest in the 3.55 zone from where a strong decline could occur. We have been preparing for a strong uptrend on the hrp at 40% for quite some time now

AltcoinPioneers | XRP Daily Analysis Day1BINANCE:XRPUSDT
AltcoinPioneers | XRP Daily Analysis Day1
👋 Welcome to Altcoin Pioneers Group TRADING ™!
Let’s analyze XRP. Let’s explore the reason behind it and what Bitcoin’s next move might be.
It features a falling wedge pattern 🔻, marked with red lines ❌, indicating a potential reversal ⬆️.
The price rose initially 📈, then declined 📉 within the wedge, forming lower highs and lower lows.
A target price 🎯 is indicated around 3,0881 USDT 💰, suggesting a possible upward breakout 🚀.
The current price is near 2,829 USDT 📍.

XRPUSDT Targets $4.17 After Neckline BreakXRPUSDT is forming a potential inverse head and shoulders structure, with price currently building the right shoulder above the key demand zone. A confirmed breakout above the neckline would validate the bullish reversal pattern, targeting the projected levels at $3.7094 and $4.1769. The plan is to focus on accumulation near the right shoulder zone while maintaining bullish bias towards the outlined objectives.

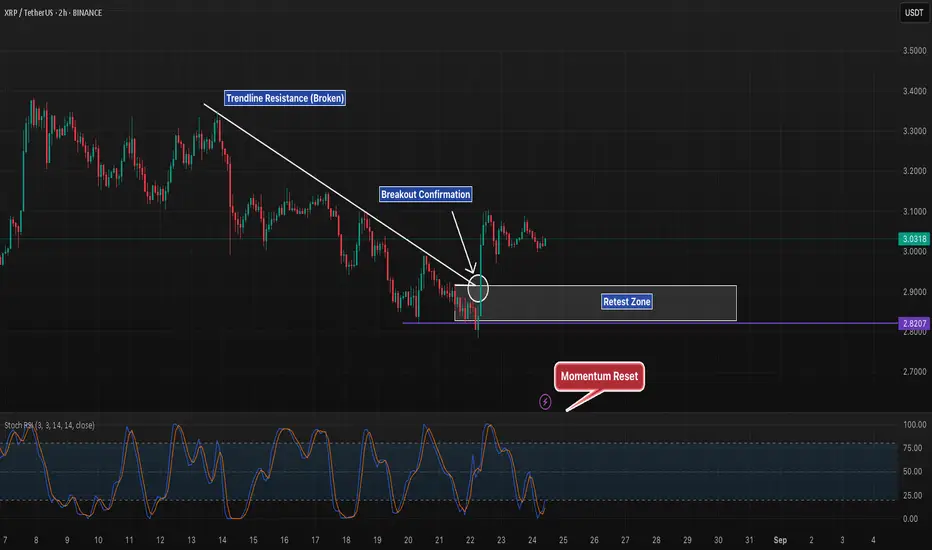
XRP 2H – Breakout Retest in Play, Can $3.20 Hold Next?XRP has broken out of its short-term descending trendline, with a strong impulse candle confirming the move. Price is now consolidating just above the 2.82–2.90 retest zone, making this a critical level for continuation.
Bullish case: If buyers defend the retest zone, XRP could extend toward $3.20–3.30, aligning with prior local highs.
Bearish case: A failure to hold above $2.82 support risks invalidating the breakout, sending price back into the range.
The Stoch RSI has cooled after the breakout spike, suggesting momentum is resetting and could fuel another push if support holds.
Key levels:
Support: $2.82–2.90 retest zone
Resistance: $3.20–3.30 (local highs)
Breakout point: Trendline resistance flipped to support
XRP has shifted structure with this breakout — now the retest will decide whether momentum continues higher.
XRP needs to correctWith falling volume, and weakening momentum on the RSI weekly, Im looking for $2 something

XRP/USD Correction Phase Before New HighThis analysis, utilizing the SB Model, examines a correction phase for XRP/USD on the 1-hour Binance perpetual contract chart, anticipating a pullback before a potential new high. The current price, based on SB Model projections, shows consolidation within a symmetrical triangle pattern. A corrective dip is expected before a breakout above resistance, targeting adjusted take-profit levels (TP1, TP2, TP3, and FINAL) as per the model. The trade is supported by volume trends and a bullish momentum shift. Set a stop-loss to manage downside risk, adjusting based on SB Model signals. Exit or adjust targets if momentum fades post-correction.

XRP NEW VOLUME INCREASE AFTER CASEXRP can show in the coming time new trend volume, since it has shown the first signal.
For this reason there will be a follow at XRP
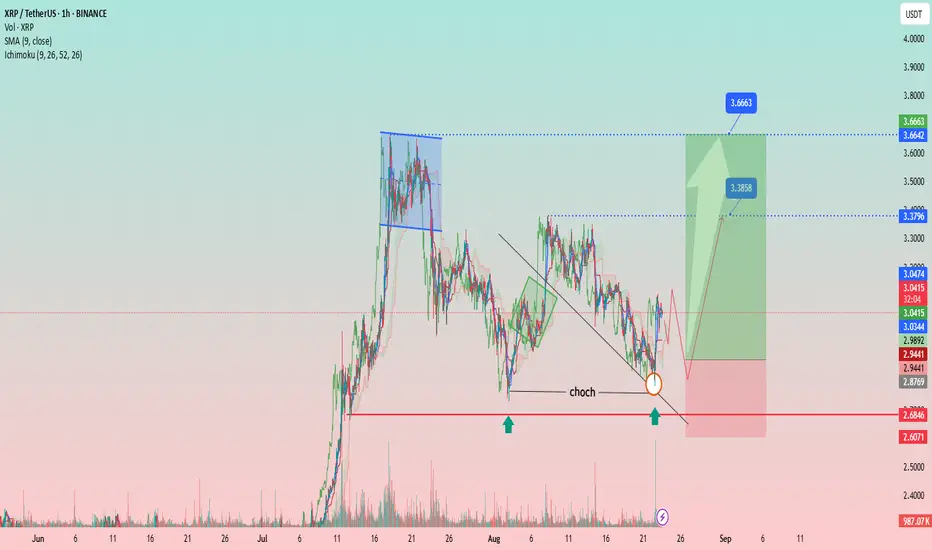
XRP/USDT – Bullish Reversal Setup After CHoCH BreakoutAnalysis:
The chart shows XRP/USDT (1H timeframe) developing a bullish structure after a Change of Character (CHoCH) confirmation near the $2.94 support zone. Price respected the key demand area (highlighted by green arrows) and broke above the descending trendline, signaling potential reversal momentum.
Support Zone: $2.94 – $2.87 (strong demand zone, price reacted twice).
Resistance Levels:
First target: $3.38
Second target: $3.66
Indicators:
SMA (9) at $3.04 – price hovering around it, suggesting early bullish strength.
Ichimoku showing potential cloud breakout aligning with bullish momentum.
Volume: Increasing at demand, indicating strong buyer interest.
Trade Plan:
Entry Zone: Around $3.00 – $3.05 (after retest confirmation).
Stop-Loss: Below $2.86 (invalidates setup if broken).
Targets:
TP1: $3.38
TP2: $3.66
Risk/Reward: Favorable, with potential 2:1 or higher depending on entry execution.
👉 This setup suggests that XRP may attempt a bullish continuation if support holds and volume sustains the breakout momentum.
Xrp chartXrp chat - key levels.
If price drops under support it invalidates the setup, it needs to stay on top for a valid move.
Price can get back even in a few month and use this as support to go higher if it does not do it now.

Jackson Hole Signals & My XRP LongPowell’s Jackson Hole speech opened the door for just one rate cut – likely in September. Markets rallied as equities hit new highs and bond yields fell, while the Fed stays cautious, balancing inflation risks with a cooling labor market. As shared with my community, I’m holding a long position on XRP.

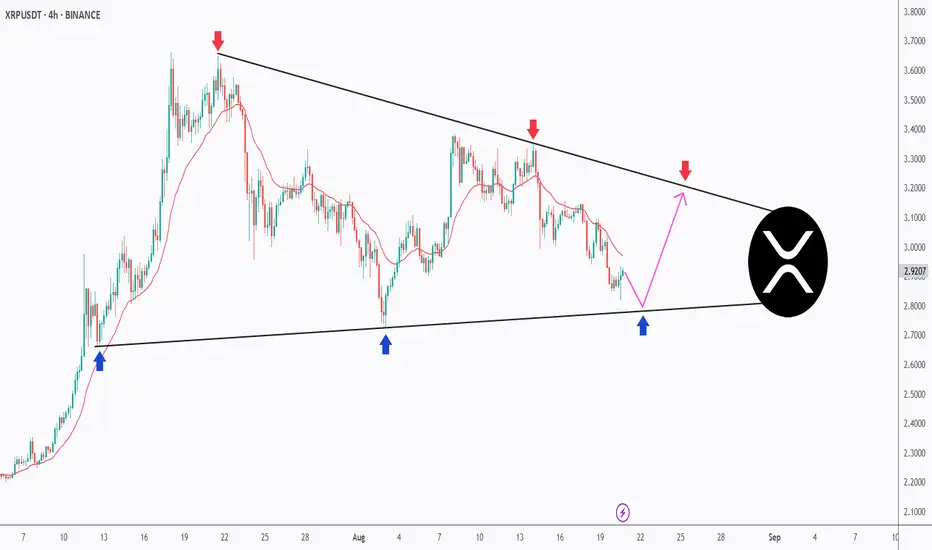
The Perfect Triangle – XRP’s Setup of the Month!XRP has been coiling up inside a textbook symmetrical triangle on the 4H timeframe.
🔻 Sellers are defending the descending trendline (red arrows).
🔹 Buyers keep stepping in at the rising support (blue arrows).
📉 Price is now retesting the lower bound, and as long as this zone holds, we can anticipate a potential bounce back toward the upper boundary.
🚀 A breakout from this formation will likely define XRP’s next major move — either continuation higher or a bearish breakdown.
This clean structure makes XRP one of the most exciting charts to watch this month!
⚠️ Disclaimer: This is not financial advice. Always do your own research and manage risk properly.
📚 Always follow your trading plan regarding entry, risk management, and trade management.
Good luck!
All Strategies Are Good; If Managed Properly!
~Richard Nasr
XRPUSDT: Trade 15 minHello, I opened a trade on Ripple, the points where the price is likely to reverse are marked, so in the lower timeframe there is a short-term trend towards gain. Be profitable.

XRP 2H – Supply Rejection, Can Supports Catch Price?XRP tapped into the 3.097–3.065 supply zone and rejected sharply. Price is now pulling back.
Levels to watch:
First support sits near 2.8739.
If that breaks, deeper liquidity sits at 2.8191.
Only a reclaim above the 3.097 supply zone would shift bias back to bullish.
For now, rejection from supply keeps risk of further downside open unless buyers step in at lower support.

XRP Confirms Support · Good NewsWill XRP resume growing right away? Yes!
Continue reading below for the full details... I shall explain.
My fellow reader and long-term supporter, it is my pleasure to write again for you today. We have good news here, we have strong signals to support our highly profitable and successful LONG trades. You can go all-in right now, timing is great.
XRP confirms support in two different ways. The main low happened the 28-July week and this week we have a shy higher low. The action stopped right at EMA13 and all selling was bought. All the losses this week have been recovered within a few hours, this is a major development.
If the market can recover this fast in just a few hours, what happens in a matter of days? What happens in 10 days or 21 days? Amazing possibilities; expect something great.
With support confirmed we know prices can move higher but it can happen that resistance is also confirmed and we continue—get—sideways forever more... And it becomes boring and we turn off the computer and find something to do at home.
Well, the last peak happened 14-July. Counting this week, we have a total of five weeks and that's a standard retrace for you. Prices move lower only a little, briefly and then the market continues with its main trend.
With five weeks of retrace and the retrace being over, we can expect higher prices right away.
Our targets continue to be the same. We will be aiming first at $4.4444 but just to move higher. Main target short- to mid-term is $6.28. Depending on how the market is doing at this point, we adapt and continue to trade.
Thank you for reading.
Namaste.

Ripple (XRP): Powell Gave Us Break of Structure!Ripple is showing good signs of potential 20% movement after today's economic news, which broke the chart of XRP with a good break of structure.
More in-depth info is in the video—enjoy!
Swallow Academy

XRP is forming a triangle ┆ HolderStatBYBIT:XRPUSDT is forming a new triangle after its recent rally. Prior structures like sideways ranges and triangles acted as bases for breakouts. Price is holding a higher low, and the next move could be a breakout toward $3.20 if buyers sustain momentum.

XRP Game PlanXRP Game Plan
📊 Market Sentiment
Market sentiment has slightly shifted as expectations for a 0.25 bps cut in September are no longer strongly priced in. Current probabilities still show around a 60% chance of easing, but overall, the market remains uncertain. This uncertainty has led to risk-off moves and sell-offs across multiple assets, starting with NQ and extending into crypto.
📈 Technical Analysis
Price is retracing towards a higher timeframe (HTF) key support level.
The main liquidity zone sits around $2.73, where I would expect a significant bounce.
📌 Game Plan
I expect price to run into the $2.73 liquidity zone and close back above it. From there, I will look for price to reclaim the HTF key level as confirmation of bullish continuation.
🎯 Setup Trigger
I will monitor the 4H market structure for confirmation before initiating a position.
📋 Trade Management
Stoploss: 4H swing low confirming the BOS
Targets:
TP1: $3.14
TP2: $3.38
💬 Like, follow, and comment if you find this setup valuable!
⚠️ Disclaimer: This content is for informational and educational purposes only and does not constitute financial, investment, or trading advice. Always do your own research before making any financial decisions.

Fear or courage?I think Ripple will continue to be bullish until the weekly candle closes below the $2.74 range and enters the huge box it created, and this correction is normal.
Whales are still accumulating while small traders are panicking and selling.
The $5 price target is still available.

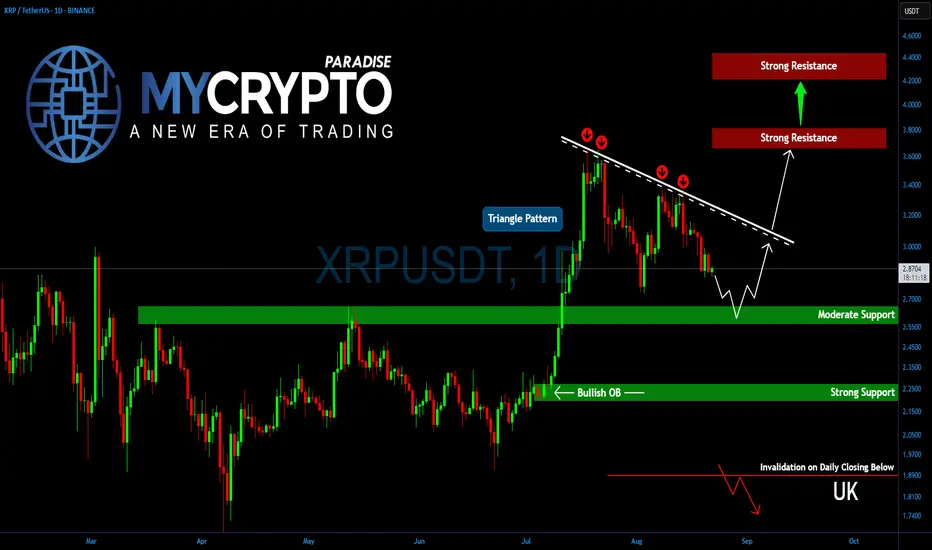
Triangle or Trap? XRP’s Next Move Could Shock TradersYello, Paradisers! Is #XRP quietly preparing for its second explosive leg? The chart is tightening fast, and the next move will decide everything.
💎XRP has been one of the strongest altcoins in this rally, holding momentum after July’s major leg up. Price action is now consolidating inside a triangle formation, which often signals continuation before the next move. This consolidation is also beginning to resemble a potential bull flag, a strong bullish setup.
💎For #XRPUSDT, the key to confirmation lies at $3.15. A breakout above the descending resistance with strong volume would trigger the second bullish leg, sending XRP toward $3.70–$3.85. If momentum carries through, the move could even extend to $4.20–$4.40, which aligns with the 161.8% Fibonacci extension.
💎On the downside, solid support sits between $2.65–$2.55. The longer price holds above this range, the stronger the base bulls will have to push higher. In the case of aggressive profit-taking, XRP could retest $2.25–$2.20, a strong support zone that is expected to withstand any deeper breakdown attempts.
Paradisers, strive for consistency, not quick profits. Treat the market as a businessman, not as a gambler.
MyCryptoParadise
iFeel the success🌴
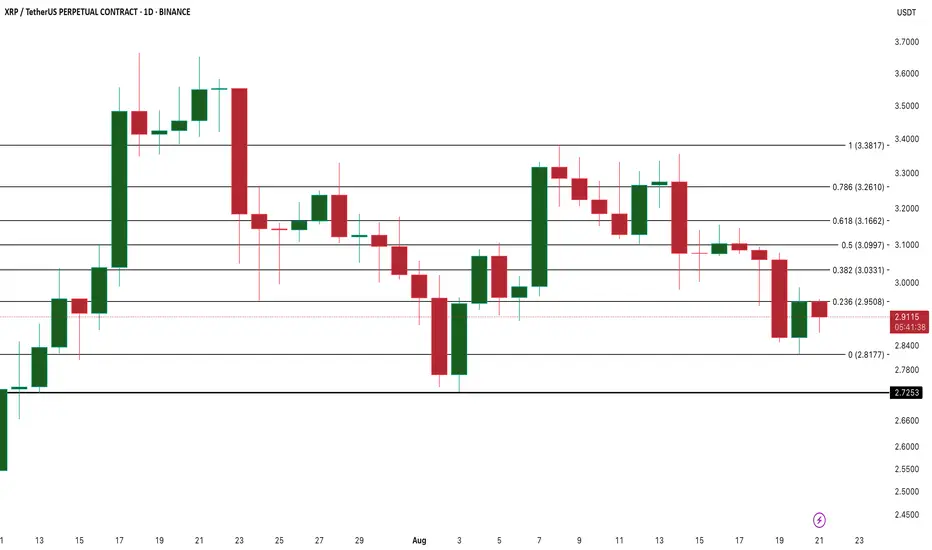
XRP - 1H Elliott Wave Analysis - 21.08.25Welcome back to another XRP update.
The bullish count is still valid. Today we gonna look on the potential count on a lower timeframe.
We did retrace deep into our Wave 2 support area that we had on the chart in the last analysis already but it is still valid.
From the support area we saw a bounce which we count as either green 1 or yellow A Wave followed be a retracement in either the green 2 or yellow B. Currently we are looking for a bounce in the green Wave 3 or as the yellow Wave C.
The support area for this green impulse or yellow ABC is between the 0.382 FIB at 2.9227 USD and the 0.886 FIB at 2.8374 USD which cuts into our other support area.
The targets for the yellow Wave C or the green Wave 3 would be the 1 to 1 FIB at 3.0545 USD, the 1.236 FIB at 3.0949 USD, the 1.382 FIB at 3.1199 USD and the 1.618 FIB at 3.1603 USD.
We think the 1.382 FIB is the most likely but for the green count we would like to see the 1.618 FIB get hit. We do think the yellow ABC has a higher probability compared to the green count because the bounce from our last low during the 21th of August looks rather corrective than impulsive.
Be aware that if we break the 0.886 FIB at 2.7957 USD of the Wave 2 support area we are looking for a deeper retracement which would take us to 2.52 USD or even lower. In this scenario we would need to count the move up that we started in April as a diagonal or even some corrective structure to the upside.
Thanks for reading.
NO FINANCIAL ADVICE.

XRP Price Tests $2.81 as Whale Inflows and Chart Rejection BuildBINANCE:XRPUSDT XRP’s price remains stuck in a bearish structure despite a minor intraday bounce. The $2.95 level continues to act as a stubborn resistance on the daily BINANCE:XRPUSDT chart, while key support at $2.81 is now under pressure. If this support breaks, price could swiftly slide to $2.72—last seen during early August dips.
The latest whale inflow data confirms short-term distribution. Over the past 5 days, whale deposits to exchanges rose 7x—from 900 XRP to 6,293 XRP—signaling intent to offload. Historically, similar inflow spikes preceded sharp price drops, including the recent $3.09 to $2.76 slide.
On the technical side, a third 4H EMA death cross is forming, with the 50-EMA about to break below the 200-EMA. While crossover lag signals trend confirmation, the more critical clue is price action itself: lower highs, failure to reclaim $3.16, and weakening support.
Until $3.16 is reclaimed, the short-term trend remains down, and traders should watch $2.81 for immediate directional cues. Any bounce without volume or a whale retreat could be short-lived.
XRP: Calm before the storm!Keep an Eye on XRP
Now is the time to watch XRP. If the price breaks to the upside, we could see a significant move that might take it above $3.57!
Trading Setup
If you’re considering trading XRP, here’s a quick setup that may help you.
The idea is: Buy when the price breaks above $3.35 and take profits at the levels shown in the chart.
Targets:
1. $3.4
2. $3.48
3. $3.57
-------------------------------------------
About our trades:
Our success rate is notably high, with 10 out of 11 posted trade setups achieving at least their first target upon a breakout price breach (The most on TW!). Our TradingView page serves as a testament to this claim, and we invite you to verify it!
