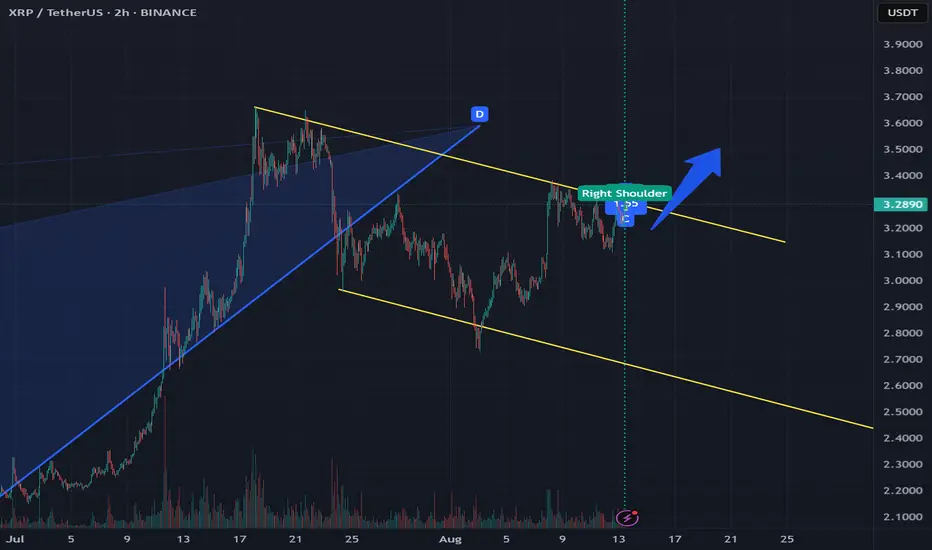
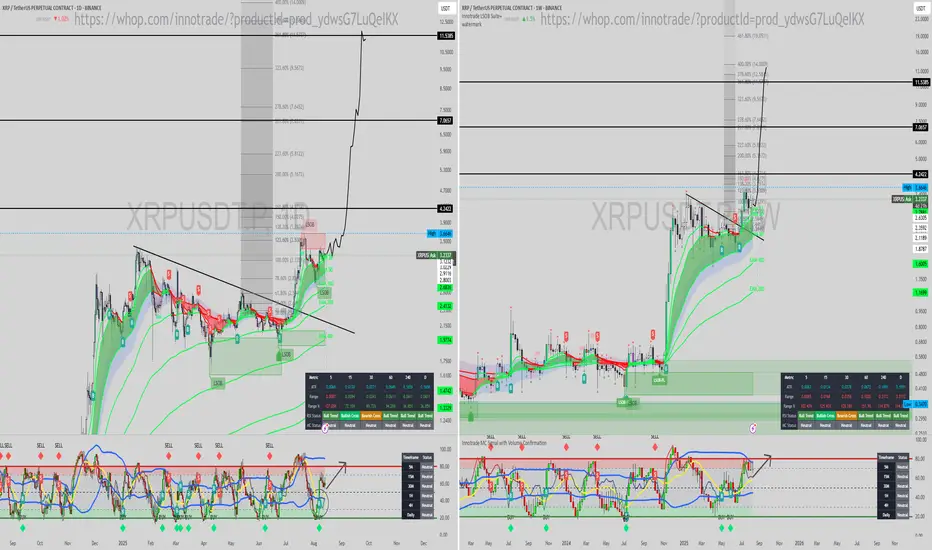
XRP Forms Fifth Wave and Bullish Flag With Potential Breakout AbAccording to wave analysis, XRP is trying to form a fifth fall, according to wave analysis, after breaking through the fifth wave , price growth is often observed
There is also an attempt to exit the descending corridor, which forms the bullish flag pattern
The descending corridor was formed after exiting the global butterfly pattern
On the minute timeframe, we see two patterns that tried to break through the upper border of the descending corridor, these are the head and shoulders, and the butterfly
Current price: $3.2830
If there is a breakthrough of the upper border of the descending level, according to the bullish flag pattern, the price is more likely to rise to the level of $3.30 , after which it can go to the levels of $3.33
Also, if the price does not hold after the breakthrough, it can fall to the level of $3.2637 and below
XRPUST.P trade ideas
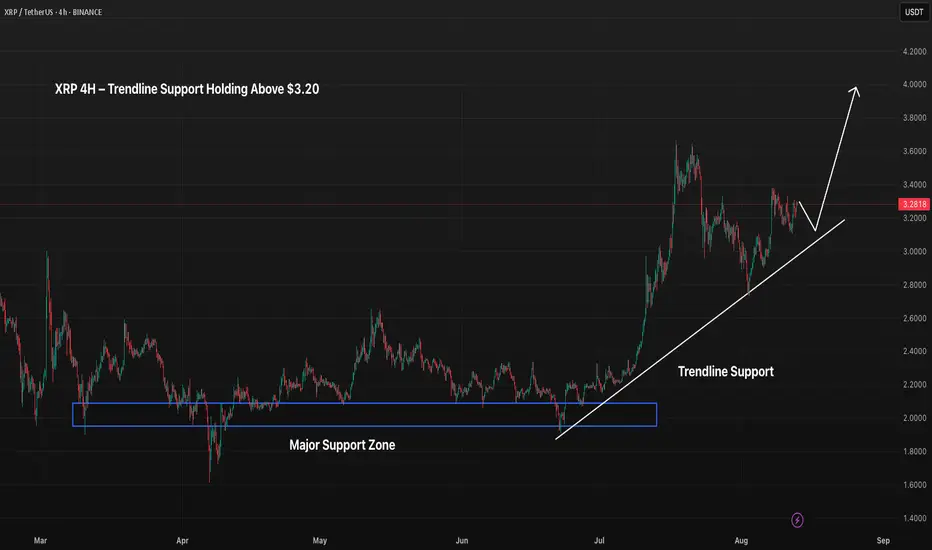
XRP 4H – Holding Above $3.20 Trendline, Eyeing $4.00 TargetXRP continues to hold its ascending trendline from early July, maintaining $3.20 as a key pivot level. The $2.00–$2.20 zone remains the major long-term support after the breakout in mid-July. Price action is forming higher lows, with bulls targeting a breakout above $3.40 to open the path toward the $3.80–$4.00 range. A breakdown below the trendline could shift momentum toward $3.00 and potentially deeper into the $2.50 zone.
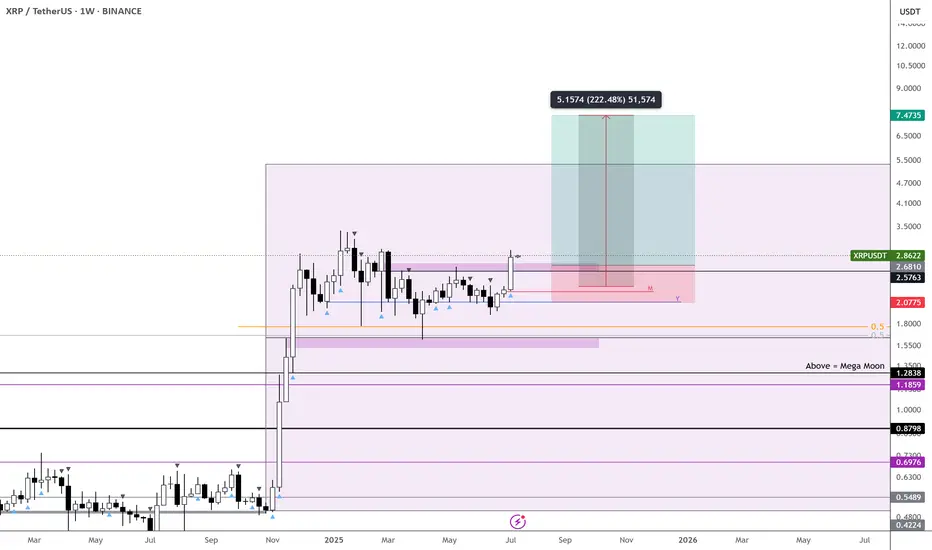
XRP – Dual Trends Active, Ready to Outperform - $7 Incoming
Two active trends on CRYPTOCAP:XRP right now—monthly and weekly confirmations are in, which significantly boosts the probability of hitting the first target.
Honestly, I see this outperforming CRYPTOCAP:ETH , though both are worth holding.
With both timeframes aligned, I’m expecting a strong move.
Targeting $7 on CRYPTOCAP:XRP and over $7k on $ETH.
XRPUSDT TRADE SETUP.XRPUSDT 1H — Price broke structure, creating OB + FVG confluence as a POI below current level. Watching for retracement into zone near SSL for a potential long setup.

XRPUSDT - UniverseMetta - Analysis#XRPUSDT - UniverseMetta - Analysis
Potential continuation of the bullish trend
🗓 W1 — Weekly Timeframe
🔹 XRP is currently within a potential 5th wave of the broader uptrend
🔹 A down fractal has formed — a key signal indicating a possible end of correction
🔹 If the bullish structure continues to develop:
🎯 Long-term target (W1): $4.36
📉 D1 — Daily Timeframe
🔹 The correction appears to have completed as an ABC structure
🔹 Price broke above the trendline and is now retesting it
🔹 This retest could serve as the launch point for a new impulse upward
🎯 Potential extended target: $5.13
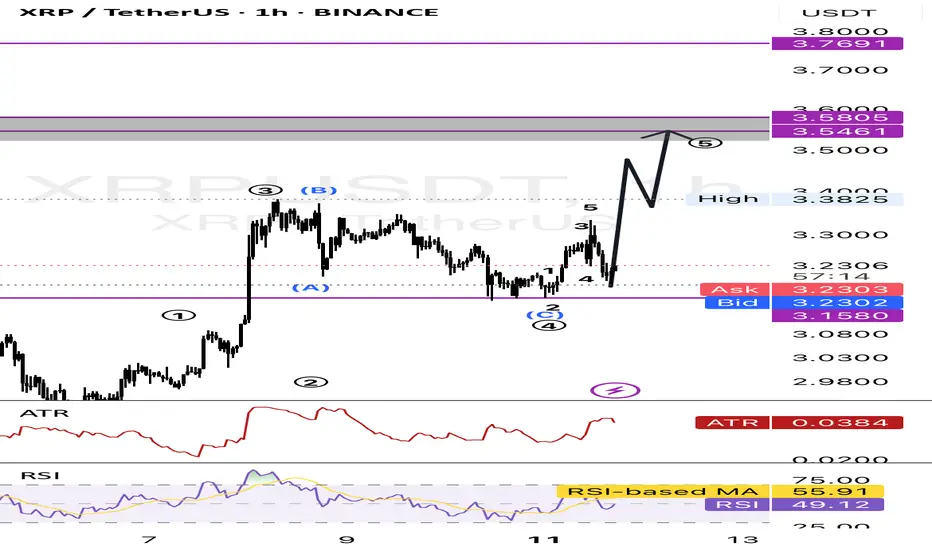
⌛ H4 — 4H Timeframe
🔹 Price is moving within a descending corrective channel
🔹 For confirmation of bullish continuation, we need a breakout above the channel
🔹 Ideal entry scenario: formation of a 3rd wave to the upside
🎯 Local targets:
▫️ $3.43
▫️ $3.55
⚠️ If price falls back inside the channel — the idea is invalidated.
Stop-loss should be placed below recent key lows.
🎯 Trade Setup:
#XRPUSDT #BUY
Entry: 3.3105
Take Profits (TP):
▫️ 3.4383
▫️ 3.5556
▫️ 3.8311
▫️ 4.2406
Stop Loss: 3.0897
‼️ Total risk should not exceed 1–3% of your portfolio
This signal/idea is not investment advice

XRP RALLY BEGINS "THE CALM BEFORE THE STORM"🚀🚀🚀
SUBSCRIBE, BOOST AND COMMENT IN ORDER TO GET HIGH QUALITY TECHNICAL ANALYSIS.
Firstly, our Algo-based indicators are used to create this analysis.
XRP IS ACCUMULATING TO PUMP SO HARD THAT YOU MIGHT SAY "WHY I DIDN'T LISTEN HIM AND BOUGHT MORE"
The Path to $30 XRP: Why This Bull Cycle Could Be DifferentIs a $30 XRP Price a Real Possibility for This Bull Cycle? A Deep Dive into the Perfect Storm Required
The cryptocurrency market is once again buzzing with audacious predictions, and at the heart of many speculative discussions is XRP, the digital asset native to the XRP Ledger. Following historical patterns of explosive, 10x or greater gains in previous bull markets, a vocal portion of the investment community is eyeing a monumental target: $30 per XRP by the end of the current cycle, potentially by mid-2026. This would represent an unprecedented surge, catapulting its market capitalization into the trillions and reshaping the hierarchy of the digital asset world.
While some market analyses project a climb toward the $34 mark, citing long-term technical patterns, the path to such a valuation is fraught with immense challenges and requires a "perfect storm" of legal, technological, and market-wide catalysts. This article will dissect the fervent bull case for a $30 XRP, weigh it against the significant bearish headwinds, and offer a balanced perspective on what it would take for such a dream to become a reality.
The Bull Case: Charting a Course to the Stratosphere
The optimism surrounding XRP is not unfounded but built on a combination of historical precedent, bullish technical setups, fundamental developments, and favorable macroeconomic tailwinds. The argument for a parabolic rise is multi-faceted, weaving together past performance with future potential.
Echoes of Bull Runs Past
History is a powerful psychological driver in financial markets, and for seasoned crypto investors, it often rhymes. XRP has a documented history of parabolic advances during bull cycles. In past market-wide rallies, the asset has demonstrated an ability to multiply its value in spectacular fashion, delivering gains that far outpace many of its peers. Proponents of a new all-time high believe these past performances are a prelude to future potential. They argue that the asset is coiled for another breakout and that a tenfold gain from its recent highs is not just possible, but consistent with its historical behavior during periods of market euphoria.
Technicals Flashing Green
Several technical analysts have laid out a roadmap that could, in theory, lead to astronomical prices. These analyses focus on long-term chart patterns that have been developing over several years.
One of the most cited bullish patterns is a massive, seven-year double-bottom structure. In technical analysis, a double-bottom is a classic reversal pattern that indicates a major shift from a downtrend to an uptrend. A breakout from such a long-term formation is often considered a powerful signal of sustained upward momentum. Some chart interpretations suggest that a confirmed breakout from this pattern, followed by a successful retest of the breakout level as new support, could launch the price on a trajectory toward the $30-$34 range.
Furthermore, other analytical frameworks like Elliott Wave theory are being applied to forecast XRP's potential path. This theory posits that markets move in predictable, repetitive wave patterns driven by investor psychology. According to some of these models, XRP may be in the midst of a powerful "Wave 3" surge, which is typically the longest and most powerful wave in an uptrend. These projections offer various potential price targets, with the most ambitious scenarios pointing to a price corridor between $27 and $30.
The End of a Legal Saga
Perhaps the most significant fundamental development has been the resolution of the nearly five-year-long legal battle with the U.S. Securities and Exchange Commission (SEC). For years, this lawsuit cast a long shadow over XRP, creating immense uncertainty and suppressing its price while the rest of the market soared.
The landmark court ruling, which determined that programmatic sales of XRP on public exchanges do not constitute securities transactions, provided crucial legal clarity. The subsequent finalization of this matter has removed a massive overhang, boosting investor confidence and, more importantly, paving the way for greater institutional adoption. With the legal ambiguity resolved in the United States, exchanges that had delisted the asset can relist it, and financial institutions that were hesitant to engage with XRP now have a clearer regulatory framework to operate within. This legal victory is widely seen as a foundational catalyst for the next phase of growth.
The Promise of a Spot ETF
Following the watershed moment of the successful launch of spot Bitcoin ETFs, the market is overwhelmingly optimistic about a spot XRP ETF. The precedent has been set, and many believe an XRP ETF is not a matter of if, but when. Market sentiment suggests a very high probability of approval by late 2025 or early 2026.
A spot ETF would be a game-changer for accessibility. It would allow traditional investors, wealth managers, and large institutions to gain exposure to XRP through their existing, regulated brokerage accounts, without the complexities of managing private keys or using cryptocurrency exchanges. The resulting inflows of capital could be substantial. If an XRP ETF were to capture even a fraction of the capital that flowed into Bitcoin ETFs, it would create immense buying pressure and could significantly propel the price. Some forecasts suggest an approved ETF alone could be the primary driver of a rally toward the high double-digits, a figure that aligns with the most bullish technical targets.
Ecosystem Growth and Utility
Beyond speculation and market structure, the XRP Ledger itself is evolving. Proponents argue that its underlying utility is growing, providing a fundamental basis for a higher valuation.
A key area of growth is the tokenization of Real-World Assets (RWAs). The XRPL is gaining traction as an efficient and low-cost platform for creating digital representations of tangible and financial assets. The value of tokenized assets on the ledger has seen explosive growth, driven by institutional interest in bringing assets like U.S. Treasuries, real estate, and private credit onto the blockchain.
Simultaneously, the Decentralized Finance (DeFi) ecosystem on the XRPL is expanding. While still nascent compared to competitors, its Total Value Locked (TVL) has been steadily increasing. The introduction of new stablecoins, including an upcoming offering from Ripple itself and the integration of established stablecoins, is expected to further enhance the ledger's utility for payments, trading, and other decentralized financial applications. This growing utility, bulls argue, will eventually be reflected in the price of the native asset, XRP.
The Bear Case: The Immense Hurdles on the Path to $30
While the bull case is compelling, the journey to $30 is littered with formidable obstacles. A sober analysis reveals that such a price target may be more of a dream than a realistic probability for this cycle, requiring a suspension of disbelief regarding market dynamics and valuation principles.
The Staggering Market Cap Requirement
The single greatest argument against a $30 XRP is the sheer market capitalization it would require. This is not a matter of opinion, but of simple mathematics. With a total supply of 100 billion tokens, a price of $30 per XRP translates to a market capitalization of $3 trillion.
To put this number into perspective:
• Bitcoin's all-time high market cap is approximately $1.4 trillion.
• The entire cryptocurrency market at its absolute peak valuation was around $3 trillion.
• Ethereum, the second-largest cryptocurrency, reached a peak market cap of roughly $550 billion.
For XRP to reach a $3 trillion valuation, it would need to become more than twice as valuable as Bitcoin has ever been. It would have to single-handedly equal the value of the entire crypto asset class during the peak of the last bull run. This would require an unprecedented and arguably unrealistic inflow of capital into a single altcoin within one market cycle, an event for which there is no historical precedent.
The Glaring Valuation Disparity
A major red flag for fundamentally-oriented investors is the massive disconnect between XRP's market capitalization and the actual economic activity occurring on its ledger. A common metric used to gauge this is the market-cap-to-TVL ratio. Even at more modest valuations, XRP's market cap has often been thousands of times greater than the Total Value Locked in its DeFi ecosystem.
This indicates that the valuation is overwhelmingly driven by speculation on future utility rather than current, tangible use. While the promise of RWA tokenization is exciting, the current on-chain metrics remain weak in comparison to the asset's valuation. Critics point out that daily trading volumes on the ledger's decentralized exchange can be surprisingly low, and nascent sidechain projects have yet to gain significant traction or attract substantial capital. This stark contrast with platforms like Ethereum, where a robust and multi-billion dollar DeFi ecosystem provides a much stronger fundamental underpinning for its valuation, suggests XRP may be significantly overvalued on a utility basis.
Intense Competition
Ripple and XRP do not operate in a vacuum. The problems they aim to solve are being tackled by a host of powerful and innovative competitors.
In the cross-border payments arena, where XRP was a pioneer, it now faces a crowded field. Traditional systems like SWIFT have not stood still, upgrading their services to improve speed and transparency. More importantly, the rise of stablecoins presents a formidable challenge, as they offer a stable unit of account for remittances and have seen massive adoption. Furthermore, a new wave of fintech solutions and central bank digital currencies are all vying for a piece of the global payments market.
As a smart contract platform, the XRP Ledger is competing in the brutal Layer 1 blockchain race. It is up against the entrenched network effects of Ethereum and the high-speed, rapidly growing ecosystems of alternatives like Solana, all of which are battling for developers, users, and capital.
Tokenomics and Sell Pressure
XRP's large total supply of 100 billion tokens is a persistent point of concern for some investors, as it creates a different price dynamic than scarcer assets like Bitcoin. Additionally, after a significant run-up in price, a very large percentage of the circulating supply is often held at a profit. This raises the risk of significant sell-offs as the price climbs. Long-term holders and early investors may be tempted to take substantial profits at key psychological levels, creating persistent headwinds that could challenge sustained upward momentum toward extreme targets like $30.
Conclusion: A Possible Dream, An Improbable Reality
So, is a $30 XRP a real possibility for this bull cycle? The answer is nuanced. While not mathematically impossible, it resides firmly in the realm of extreme optimism and would require a confluence of events so perfect it borders on miraculous.
For XRP to reach a $30 valuation, the following would likely need to happen:
1. Massive Institutional Inflows: A spot XRP ETF would need not only to be approved but also to attract hundreds of billions of dollars in a short period, dwarfing the initial success of the Bitcoin ETFs and signaling a seismic shift in institutional asset allocation.
2. Explosive Utility Growth: The XRP Ledger would need to see an exponential, near-vertical increase in real-world adoption for payments, DeFi, and RWA tokenization. Its on-chain economic activity would need to grow by orders of magnitude to begin to justify a multi-trillion-dollar valuation.
3. Unprecedented Market-Wide Euphoria: The entire cryptocurrency market would likely need to swell to a valuation of $10 trillion to $15 trillion or more, with XRP simultaneously capturing a disproportionately large share of that new capital.
4. Sustained Macroeconomic Tailwinds: A continued global economic environment of high liquidity and strong investor risk appetite would be necessary to fuel such a speculative rally across all risk assets.
More conservative, yet still very bullish, price targets tend to fall in the $5 to $13 range. These projections, while less sensational, represent substantial gains from recent levels and are grounded in more realistic assumptions about market growth and adoption.
Ultimately, while the dream of a $30 XRP fuels excitement and captures the imagination, investors should remain grounded. The journey ahead will be defined by tangible progress in the Ripple ecosystem, the real-world utility of the XRP Ledger, and the broader health of the global financial markets. The leap from its current standing to a $3 trillion asset is not a single jump but a vast chasm that is exceptionally unlikely to be crossed in a single bull cycle.
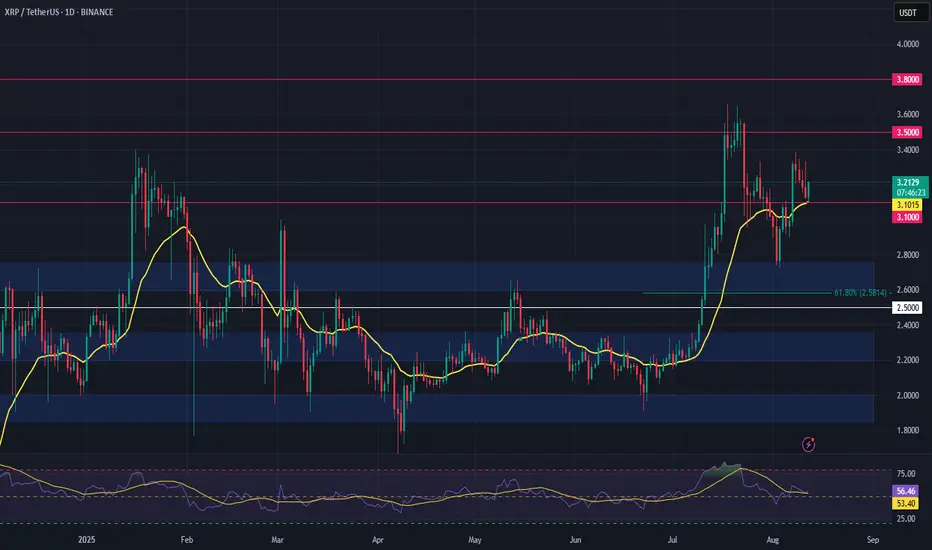
XRP Setup – Confluence Support Holding StrongXRP is holding above a major confluence zone, combining the 21-day EMA, the 61.8% Fibonacci retracement, and a flipped prior range high. This cluster often acts as a strong defense for buyers.
Trade Setup:
• Entry Zone: $2.60 – $2.75
• Take Profit Targets:
🥇 $3.10
🥈 $3.50
🥉 $3.80
• Stop Loss: $2.50
Weekly trading plan for XRPLast week, after breaking the trendline, an impulsive rally began. At the moment, the price is in a correction and has already returned to the weekly pivot point.
As long as the price stays above 3.1 , there’s a chance to see further growth and a new ATH. If 3.1 breaks and the price fails to reclaim it, we could see a move down toward the support zone.

XRP Whales’ $3.8 billion Accumulation May Drive Price To ATHBINANCE:XRPUSDT is currently trading at $3.18 , having faced a slight decline over the last four days. The altcoin remains 15.3% below its ATH of $3.66, which investors are targeting. The ongoing bullish sentiment, coupled with whale accumulation, keeps the price within range of a potential breakout.
If the whales’ efforts succeed, BINANCE:XRPUSDT price could rise to $3.41 . If the $3.41 level is flipped into support, XRP could continue its ascent toward its ATH of $3.66 . This scenario would signal a sustained bullish momentum, with strong backing from both large holders and retail investors. The support level at $3.41 would play a crucial role in sustaining XRP’s price growth.
However, if BINANCE:XRPUSDT faces bearish cues from the broader market or selling pressure from retail investors, the price could dip to $2.99 or even lower . This would invalidate the bullish thesis and raise concerns about the sustainability of the upward trend.

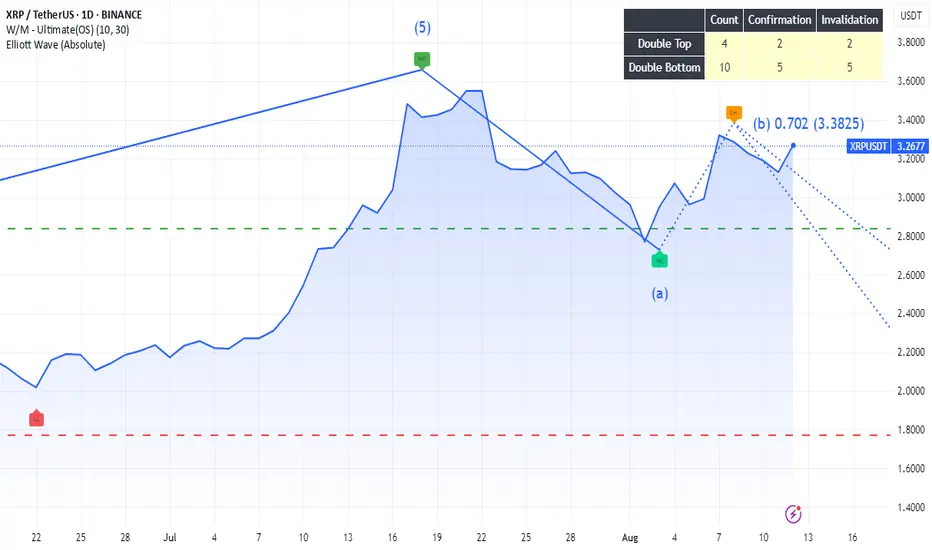
[SeoVereign] RIPPLE BEARISH Outlook – August 10, 2025In this idea, I would like to present a bearish outlook on Ripple.
There are three main reasons on which this perspective is based.
First, an arbitrary wave X forms a 1.272 ratio with another arbitrary wave X.
Second, a 1.414 BUTTERFLY pattern has formed.
Third, if the consistently formed trendline is broken to the downside, I believe the likelihood of Ripple’s decline will increase.
Accordingly, the average take-profit target has been set around 3.145 USDT.
Thank you very much for reading, and as time goes by and the chart becomes clearer, I will continue to update this idea accordingly.
Thank you.

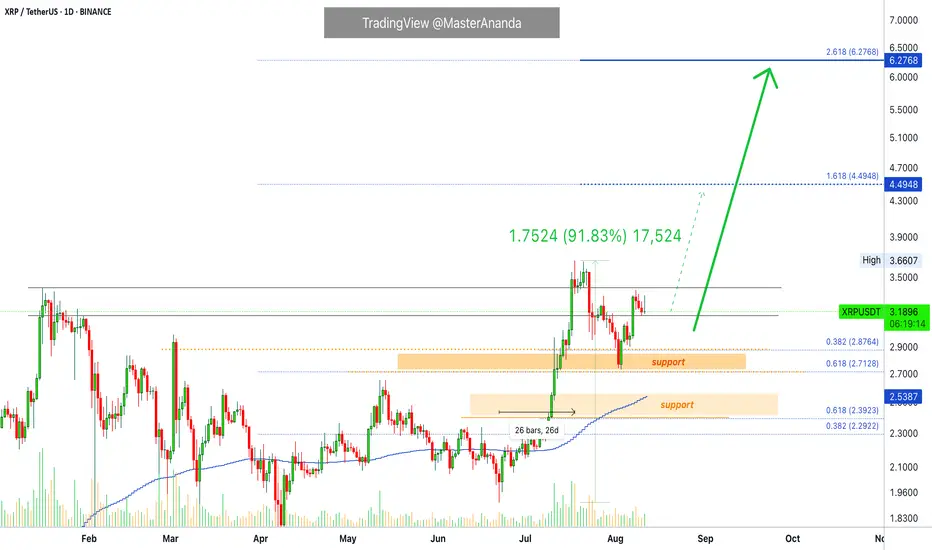
Pump Always Comes, After You’re Too Tired To HoldHave you ever felt the market is deliberately tiring you out?
The moment your hope runs out is when the real flight begins.
This analysis explains why market makers change the game exactly then.
Hello✌️
Spend 2 minutes ⏰ reading this educational material.
🎯 Analytical Insight on Ripple:
BINANCE:XRPUSDT is showing strong volume with a respected daily trendline and nearby support. If this zone holds, price could rally about 17% toward 3.70 USD. 📈💹
Now , let's dive into the educational section,
🎯 Big Picture of the Market Maker’s Game
The market is never just a single candle up or down. Its moves are filled with swings designed less for short term gains and more for managing your emotions. Market makers know that 70% of traders think alike. When they see some profit they fear losing it and when they face some loss their patience fades. That exact weakness is their golden opportunity.
This is not random and it is not luck. Behind every long range or sharp fluctuation lies a clear goal. Collecting liquidity and pushing the weakest hands out. Once most people are caught on the wrong side the market maker takes the biggest profit with the least effort.
⏳ Wearing Down Investors
The market maker is a master of time manipulation. They can hold price in a narrow range or dull sideways move where neither strong rallies nor deep drops happen. This slow bleed in excitement causes small traders to withdraw their money one by one.
Every day this continues hope fades and doubt grows. By the time most decide to exit the market is primed for a move they will not be part of.
📉 Stop Loss Hunting in Price Swings
Stop loss placement is vital for traders but to a market maker it is a treasure map. They know most stops are just below recent lows or above recent highs. With a few intentional pushes in price they trigger these stops and collect the liquidity.
This can happen multiple times in one trend each time pushing more traders out and clearing the way for the next move.
🎯 Targeting Leveraged Traders
High leverage traders are like low hanging fruit. Even a small move against their position can cause forced liquidations or margin calls. Market makers exploit this by moving price briefly against the crowd several times flushing them out.
This not only removes a large chunk of opposing positions but also makes it easier to drive the price strongly in the desired direction with minimal resistance.
💧 Building Liquidity
Liquidity is the fuel for major market moves. Without it a big push in price is costly and risky. To create it market makers need traders to buy or sell in large volumes. Stop hunts exhausting investors and shaking out leveraged players all feed this goal.
Once there is enough volume stacked on one side they flip the market hard taking the big profit while the majority has either exited or is trapped in the wrong direction.
📊 TradingView Tools to Spot the Market’s Mind Games
To see this game more clearly TradingView has tools that directly help you.
Volume Profile lets you identify price zones with the most traded volume which are prime hunting grounds.
Liquidity Zones Drawing helps you mark liquidity pockets to predict the next hunt.
Replay Tool lets you rewind past trends and find moments where stop losses were targeted.
Relative Strength Index (RSI) shows that multiple touches in overbought or oversold with sideways price often means a hunter is at work.
Alerts Customization allows you to get notified when price nears key liquidity zones.
Practical use. Open the BTCUSDT chart run a Volume Profile to find high volume areas mark liquidity zones then use Replay Tool to see how often the market hit those zones before a major move. This drill trains your eye to avoid becoming prey.
Summary
The market never moves in a straight painless path. Every swing trap or sideways grind has a purpose. If you understand these moves as part of the market maker’s plan to gather liquidity you can position yourself where others give up and join the move when it truly starts. Patience and pattern recognition are your sharpest weapons.
✨ Need a little love!
We pour love into every post your support keeps us inspired! 💛 Don’t be shy, we’d love to hear from you on comments. Big thanks, Mad Whale 🐋
📜Please make sure to do your own research before investing, and review the disclaimer provided at the end of each post.

XRP Update · Nothing Changes But One Thing...Market conditions continue to improve and all is great but one thing...
XRPUSDT is trading in the bullish zone but below its January 2025 peak price, this can have some implications. If XRP were to stay below this resistance, it can take a while before the next target is reached.
The last advance was a good one. XRP grew 92% in 26 days, including all-time high and everything. The market is good, the market is strong and the market can continue to grow, but there is no hurry if the growth is set to be sustained long-term. If a rise is to be maintained, there needs to be stops along the way.
So moving below resistance for a few days can lead to bullish momentum drying up. Once dried, the bears can take the upper-hand and push prices lower. Lower but still higher as in our classic higher lows.
Retraces, sideways, reversal, consolidation, accumulation. Bullish wave.
The market has room to wiggle around. Patience is key.
If a move back above $3.40 doesn't happen soon, prepare to wait.
Regardless of the length of the waiting period, possibly with a downward bent, XRP will continue to grow. If prices move lower this is an opportunity to buy-in or rebuy.
Namaste.
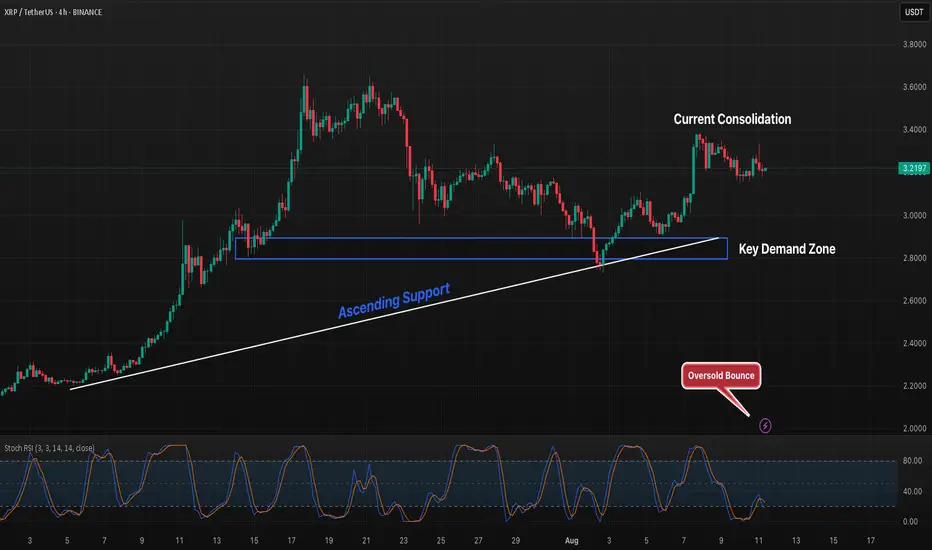
XRP 4H Holding Above Support, Can Bulls Break Consolidation?XRP is holding above a key ascending support line and the $2.85 demand zone after rebounding from oversold Stoch RSI conditions. Price is currently consolidating near $3.18, with a breakout above recent highs potentially signaling continuation toward $3.40–3.60. Failure to hold support could see a retest of the $2.85–3.00 demand area, which remains critical for the bullish structure.
XRP:Elliot Wave Analysis Hello friends, you can see the Ripple chart, which is analyzed on the basis of Elliott waves. The first and second waves have completed, so we are waiting for the Sharpe movement for the third to fifth waves, and the number will be 3.54 to 3.84. Be profitable and successful.
XRP LONG SETUP INTRADAY ( 11 AUG 2025 )Entry Details:
Entry: 3.1798 $ - 3.2035 $
Target Price: 3.2896 $
Stop loss: 3.1454 $
Trade Ideas:
Idea is clearly shown on chart + we have some secret psychologies and tools behind this.

Still bullishMy overall bias for XRP is still bullish.
I have one major Fibonacci line in the daily chart that I have been using to analyse the price action.
The Fib line is drawn from Jan 25 high at $3.40 to April 25 low at $1.58.
XRP has been spending most of the last 18 months oscillating in this range.
In mid July 2025, the price finally broke above the range but it was short lived and started to retrace.
The price found a strong support at $2.73 where Fib 0.618. It is also a 50% retracement area from the recent high to recent low.
All momentum indicators are in the bull zone and plenty of scope to keep moving to the upside.
Causions:
Daily MACD lines haven't crossed to the upside.
The price has hit the major resistance line and is rolling to the downside in the lower time frame. It has failed to break above it.
All the bullish signals are there. However, it is such a major historical resistance area: it might consolidate and perhaps retrace to fill the fair value gap first before it starts to make a major move to the upside. (see 4H chart)

xrpxrp usdt daily analyses
time frame daily
look at the chart
xrp is moving up and down slowly. when all of assets fall down in two week before , ripple was excepted
so I think if xrp break the red box (strong resistance) it can move to moon and my first target is 4.86$

Ripple (XRP)Xrp usdt Daily analysis
Time frame daily
Risk rewards ratio >1.5
Short position ↘️↘️
Bad news for Ripple investors
Head and shoulders pattern is created
So I think , maybe xrp fall down to 1.7$

Xrp (Ripple)Ripple
Xrp usdt Daily analysis
Time frame daily
Risk rewards ratio >3.2 👈👌
Target 3.2$
Ripple technical analysis ✅️
My last short position reached the target.
Head and shoulders pattern completed.
Now it is a good time to start
My critical area is red box that you see on the chart. It is very important area .
If Ripple can reach and break this resistance, we will have a good pump
But now 3 _3.2$ is a good target

Lingrid | XRPUSDT Potential Upside Move From Support ZoneThe price perfectly fulfilled my previous idea . BINANCE:XRPUSDT is rebounding after a breakout from the consolidation zone and testing support around 2.897. The price is forming a bullish structure within a downward channel, aiming to reclaim the mid-level resistance. As long as it remains above 2.897, the bullish wave has room to target the descending channel’s upper boundary near 3.230. Momentum is gradually shifting toward upside continuation following the recent breakout and rebound.
📉 Key Levels
Buy trigger: Break and hold above 2.960
Buy zone: 2.850–2.960
Target: 3.230
Invalidation: Drop below 2.740
💡 Risks
Failure to hold 2.870 could invalidate the rebound
Overall channel remains bearish, posing structural resistance
Broader market sentiment may weigh on breakout momentum
If this idea resonates with you or you have your own opinion, traders, hit the comments. I’m excited to read your thoughts!

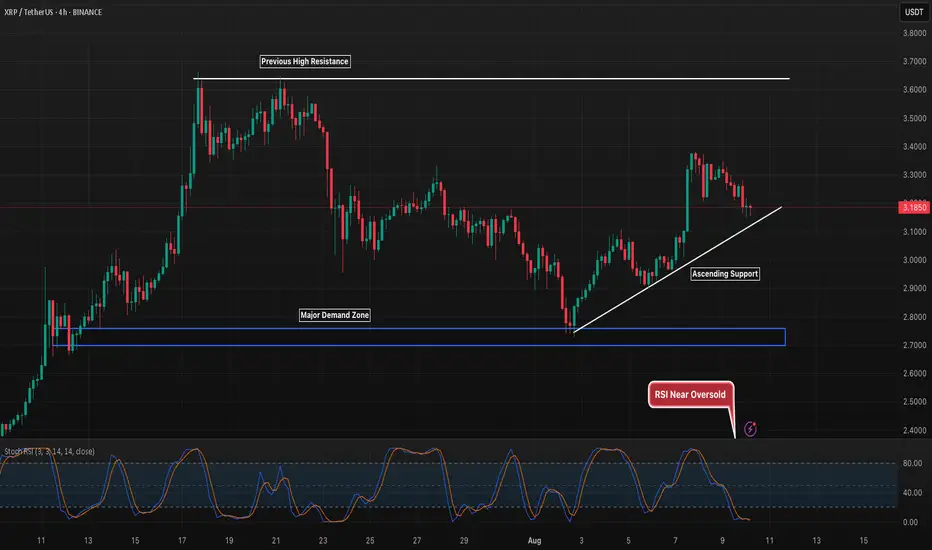
XRP 4H Testing Ascending Support After Strong RallyXRP is pulling back into ascending support after a sharp rally from the $2.70 demand zone. The structure remains bullish above this trendline, with the next key resistance at the previous high near $3.65. A breakdown here could send price back toward the major demand zone, while holding support could set up another push toward highs.
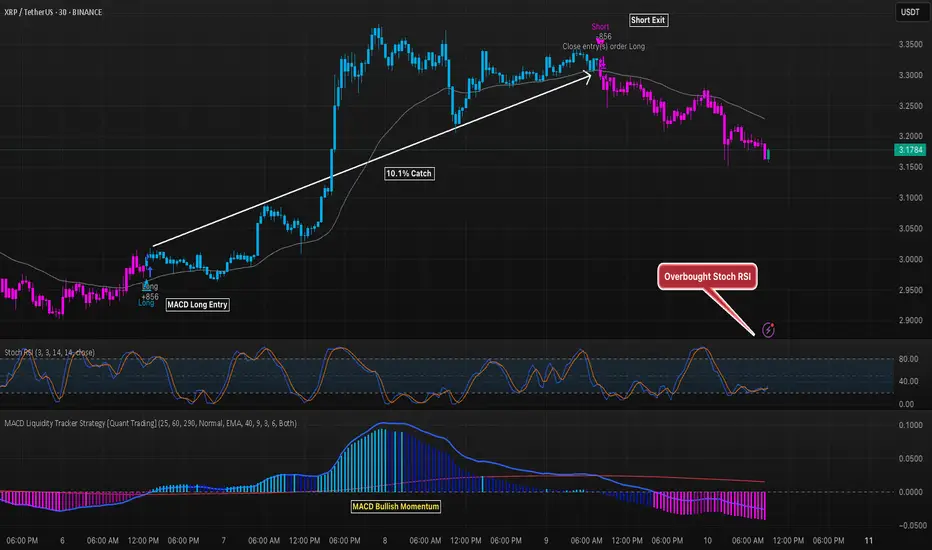
XRP 30M Strategy Trade Nets 10.1% GainThe MACD Liquidity Tracker Strategy caught a strong 10.1% move on XRP’s 30-minute chart, entering on bullish momentum and closing near the peak. The rally aligned with overbought Stoch RSI conditions, signaling potential exhaustion before price turned lower. Post-exit, momentum flipped bearish, confirming a timely close.