XRP Poised for Breakout Above 2.27 — Bullish Targets AheadXRP Poised for Breakout Above 2.27 — Bullish Targets Ahead
I also posted XRP analysis on November 14. From our analysis, Ripple reached our first target and fell to $2.00, a move created by BTC and ETH. It is an almost identical move.
Yesterday, XRP recovered along with BTC. I expect a short-term pause before its price moves further. A clear bullish move should start once the price moves above the 2.27 zone
Key target zones:
2.270
2.5
2.65
3.00
You may find more details in the chart!
Thank you and Good Luck!
❤️PS: Please support with a like or comment if you find this analysis useful for your trading day❤️
Trade ideas

XRP Review With Focus on Trend Shifts XRP is completing the previously formed bearish butterfly pattern on the global timeframe.
At the same time, a large bullish flag is visible in the chart structure, within which the price continues to move. The lower liquidity zone has already been fully engulfed, while the upper liquidity zone remains intact, making it potentially attractive for a subsequent test.
Also, each new correction forms a higher bottom, indicating a possible global trend recovery. If the lower boundary of this liquidity zone is broken, the structure could shift to a deeper downward movement.
Full breakdown with levels and graphs on the website

XRP bullish flag target $15 - research strategic financial assetXRP shows on the monthly chart a bullish flag with a possible target of $15. But I believe that it can go even higher, because with all the institutional buyings for the ETF's the XRP supply can dry up within 14-30 days.
I see conflicting news messages in the media about XRP causing confusion about where xrp might be heading too. Don't let anyone fool you. The price now is surpressed with a reason.
What is going on with XRP is big, but only a few are seeing the bigger picture.
I was not a fan of xrp first. I believed that xrp was centralized and controlled by one party. But it is not. After doing my own research, I recently found out that xrp is one of the few cryptocurrenties that has the biggest potential to keep your financial freedom in the near future.
I have done my own calculations with chatgpt giving him the assignment to make realistic calculations in different scenario's as a Hedge Fund Trader and see below the outcome.
Realistic mid term: $5–$25
Institutional investments: $50–$350
Ultra-squeeze supply shock: $500–$1.500
World wide financial settlements: $3.000–$10.000+
With the XRP supply drying up, there is only a small window left to get xrp and store it safely in a cold wallet.
Also you should google search for: XRP as a Strategic Financial Asset for the U.S.
You will find a official lobby document at the SEC website with a entire strategy about how XRP can become a strategic financial asset worldwide.

i can see at least 10% gain for XRP toward 2.28$Hi,
The support and resistances on the chart are based on the previous data and weekly candlesticks,
BINANCE:XRPUSDT is in the descending channel now and close to the resistance side if it holds this
position and these last support the potential of 10% gain is logical toward 2.28$.
And breakout of this descending channel will be completed.

TradeCityPro | XRP Compressing at Key Support Ahead of Breakout👋 Welcome to TradeCity Pro!
In this analysis, I want to review XRP, one of the oldest cryptocurrencies, currently ranked 4th on CoinMarketCap with a $127 billion market cap.
🗓 Daily Timeframe
On the daily timeframe, XRP is sitting on a very important support zone and has entered a compression (squeeze) phase over the past few days.
⭐ The bottom of this compression is 2.0242, and the top is 2.2317.
✔️ If this compression breaks on either side, the price can begin a new impulsive wave.
🎯 So, if either 2.0242 or 2.2317 breaks, we can open a position.
🎲 However, one important point:
Breaking 2.0242 is just the first trigger for entering the major support zone.
⚡️ Breaking this support will not be easy, price has attempted to break it several times and failed.
💥 Because of that, a safer short entry would be to wait for a break of the support floor at 1.7864.
↗️ For a long position, if the 2.2317 zone breaks with strong increasing volume, we can enter a long setup.
⚖️ For XRP to turn bullish, it’s very important that the RSI stabilizes above 53.22.
💡 A break above this RSI level will be the first momentum confirmation for a bullish trend reversal.
📝 Final Thoughts
Stay calm, trade wisely, and let's capture the market's best opportunities!
This analysis reflects our opinions and is not financial advice.
Share your thoughts in the comments, and don’t forget to share this analysis with your friends! ❤️

Lingrid | XRPUSDT Sell-Off Possible from Resistance ZoneBINANCE:XRPUSDT continues to trade within a well-defined descending structure, with each rally capped by a sequence of lower highs beneath the falling trendline. The recent upside attempt stalled again inside the 2.14 supply zone, confirming seller dominance and keeping the broader bearish market structure intact. Price action remains compressed under the downtrend resistance, suggesting distribution rather than accumulation.
The local triangle consolidation is forming directly below resistance and within the downward channel, which generally favors resolution to the downside. A rejection from the trendline increases the probability of renewed pressure toward the major support band around 1.80, where the lower channel boundary and horizontal demand align.
➡️ Primary scenario: rejection from the downtrend → continuation 1.80 support.
⚠️ Risk scenario: a clean breakout and acceptance above 2.20 would weaken the bearish structure and open room for a move back toward 2.40.
If this idea resonates with you or you have your own opinion, traders, hit the comments. I’m excited to read your thoughts!

XRP – Up? Maybe Asia Sends It!Can XRP pump during the Asia session?
Absolutely possible. Why not?
The whole crypto market still has some upside juice left in the tank,
momentum is there, sentiment is improving,
and XRP loves to be dramatic at the weirdest hours anyway. 😅
If the market keeps pushing up,
XRP can easily become one of the early movers —
leading the charge while everyone else is still waking up.
Nothing guaranteed (because… XRP),
but the setup looks good and the timing is perfect.
👉 Manage your risk
👉 Don’t FOMO
👉 And let Asia do its magic 😎🚀

XRP/USDT Long — Trading Idea— A falling wedge pattern is forming (a reversal technical formation), supported by bullish convergence on the 4D/3D timeframes. Price is sitting under resistance but right at the lower boundary of the range formed after the previous rally, which makes a consolidation before continuation of the broader trend quite possible.
— Entry: $2.03 (market buy)
— Stop: $1.91 — 5.5% is the price distance from entry to stop, NOT the percentage loss
— Target: $2.55
Risk per trade: 0.8% of the total account — this is the actual percentage loss
Position size: 15% of the total account, 10x leverage
RR: 1:4.5

Testing Its Long-Term Support Zone Inside a Descending ChannelXRP | Key Long-Term Support Zone Near
1.89
–
1.89–
1.77
The structure of this market says:
XRP is still fluctuating inside a descending channel. The long-term support range at
1.8965-
1.8965
1.7744 has been tested several times and remains the main line holding the structure together.
As long as this zone holds, a short-term rebound toward the channel’s dynamic resistance remains possible.
Failure to defend this support, however, would confirm a continuation of the bearish structure.

FireHoseReel | XRP Breaks Key Support, Eyes $1.99 Next🔥 Welcome To FireHoseReel !
Let’s jump into Ripple (XRP) market analysis.
👀 XRP 4H Overview
Compared to most coins in the market, XRP has experienced a sharper sell-off. Based on chart data, it has now broken its dynamic support and is currently moving toward the next dynamic support around $1.9928.
📊 Volume Analysis
XRP volume has declined due to the holiday period, so we rely more on past reactions. Previously, price attempted to defend this zone and bounce higher. This time, however, the level has been broken with a strong sell-off candle.
✍️ XRP Trading Scenarios
🟢 Long Scenario:
A breakout above the local high at $2.2454, supported by strong buying volume, could trigger a sharp upside move.
🔴 Short Scenario:
At the moment, a stop can be defined above the previous 4H candle. For a safer entry, wait for a reaction at $1.9928—if this support breaks with selling pressure, a short setup becomes valid.
🧠 Protect your capital first. No setup is worth blowing your account. If risk isn’t controlled, profit means nothing. Trade with rules, not emotions.

Next Volatility Period: Around December 23rd
Hello? Hello, traders.
If you "Follow" us, you'll always get the latest information quickly.
Have a great day.
-------------------------------------
(XRPUSDT 1D Chart)
I believe the expected uptrend will continue when the price rises above 2.4810-2.6013.
Therefore, the final buy zone is the 2.4810-2.6013 zone.
If the price falls below the 1.5-19669 zone, a long-term downtrend should be considered.
Therefore, if support is found around the 1.5-19669 zone, it would be a good time to buy from a long-term perspective.
As it's difficult to determine the support level on a 1D chart alone, the StochRSI 80 and 20 indicators on the 1M chart are marked.
Therefore, the 1.8209-1.9575 range should be considered the support level for a continued uptrend.
If the price rises above the OBV High indicator and holds, further upside is likely.
However, it must break above the M-Signal indicator on the 1W chart.
-
Thank you for reading.
We wish you successful trading.
--------------------------------------------------

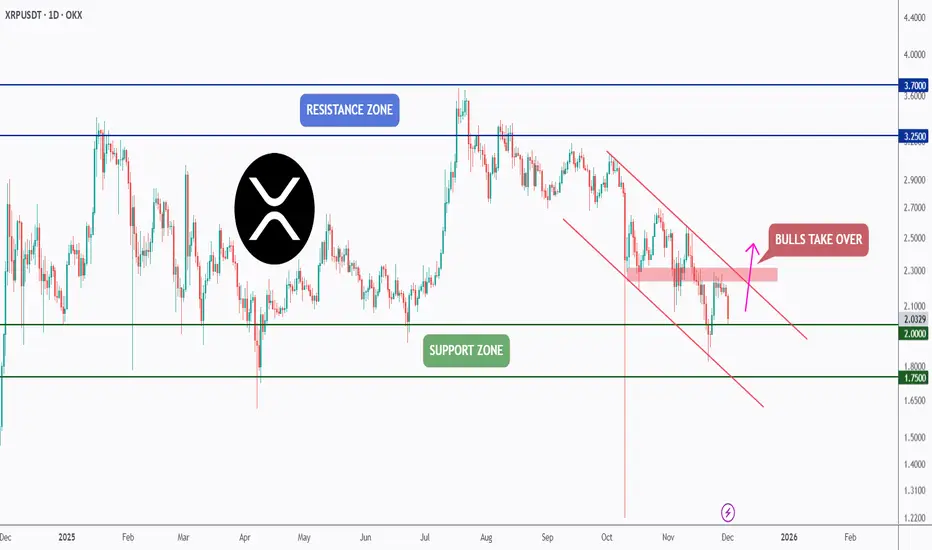
XRP - Support First, Breakout Second!📦XRP has been holding well above its key support zone , and as long as this level continues to act as a floor, we will be looking for long setups. Buyers have defended this zone multiple times, making it a critical area for a potential bullish reaction.
🏹However, for the bulls to fully take over, XRP needs more than just a bounce. A confirmed break above the falling channel and the last major high in red is needed to shift the momentum and open the door for a larger bullish leg.
Until then, the plan remains simple:
Support holds → look for longs.
Structure breaks → bulls take control.
Will XRP finally break free from this falling channel? 🤔
⚠️ Disclaimer: This is not financial advice. Always do your own research and manage risk properly.
📚 Stick to your trading plan regarding entries, risk, and management.
Good luck! 🍀
All Strategies Are Good; If Managed Properly!
~Richard Nasr
$XRP/USDT ANALYSISOn the 3-day chart, **XRP/USDT** is trading inside a broad descending triangle structure, with a clear pattern of lower highs meeting a flat demand base around the **$2.00–$2.10** zone. Price has repeatedly tested this green support area, showing strong buyer defense but also declining momentum as each rebound becomes weaker. The **trendline from the previous top near $3.20** continues to cap all recovery attempts, acting as dynamic resistance.
Currently, the candle is hovering near **$2.17**, just above the main demand region, while the EMA-9 is trending downward, signaling short-term bearish pressure. However, as long as the structure holds above **$2.00**, bulls still have a chance to stage a rebound toward **$2.28–$2.40**, which is the next resistance area aligned with the descending trendline and cloud rejection zone. A clean daily close below **$2.00** would invalidate the support and likely open room toward **$1.80–$1.70**, but a confirmed breakout above the trendline could trigger a reversal pattern toward **$2.80–$3.00**.
In short, XRP remains at a critical decision point—holding the demand zone shows accumulation, while rejection from the descending resistance continues to suppress upside momentum.

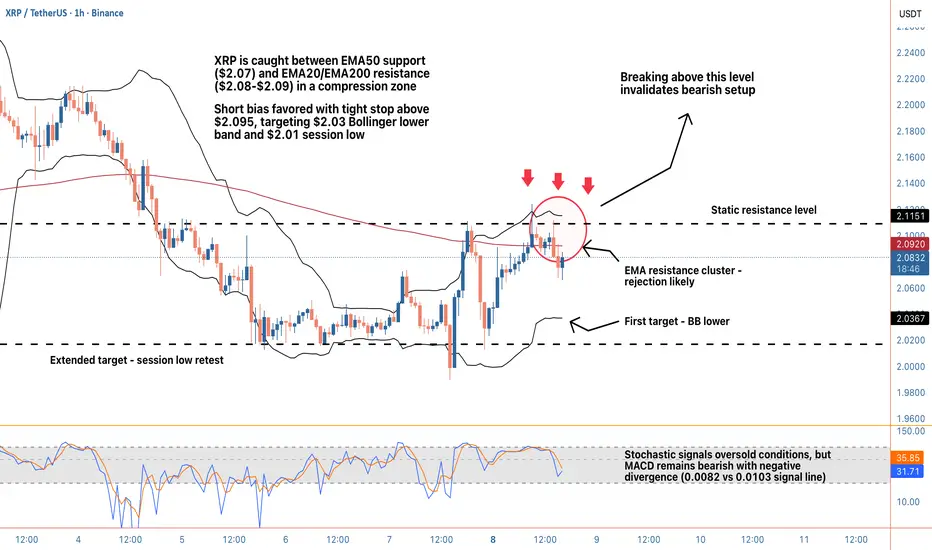
A short setupHey guys, XRP is navigating a tight compression zone on the 1-hour timeframe, trading at $2.07 and caught between critical moving average levels that are setting up a potential directional break. Price is sitting right on the EMA50 at $2.07, which has been acting as immediate support, but overhead we've got a resistance cluster formed by the EMA20 at $2.08, EMA200 at $2.09, and HMA55 also at $2.09. That's a lot of technical density above current price, and the repeated rejections from this zone over the past several hours suggest sellers are defending it aggressively. The 24-hour range spans from $2.01 to $2.12, and we're currently positioned in the lower half, about 6 cents off the highs and 6 cents above the lows.
The technical indicator suite is painting a mixed but ultimately bearish picture. Stochastic has crashed to 12.2, firmly in oversold territory, which on the surface might suggest a bounce is overdue. However, context matters here. The MACD remains in bearish configuration with the MACD line at 0.0082 sitting below the signal line at 0.0103, indicating momentum hasn't shifted despite the oversold reading. RSI at 48.5 is neutral, not providing much directional conviction, but it's worth noting we're not seeing bullish divergence that would typically accompany a reversal setup. The ADX at 33.5 confirms we're in a moderate trending environment rather than choppy consolidation, and when you combine that with the lower high formation visible in recent price structure, the trend bias leans bearish.
Volume analysis is critical here and it's telling a bearish story. Current volume sits at just $10.8M, roughly 50% below the average of $21.5M. That lack of participation during this consolidation phase suggests buyers aren't showing up with conviction, even at these relatively attractive levels. When price compresses near support without volume expansion, it often precedes a breakdown rather than a reversal. The wick analysis adds another layer: lower wicks comprise 55.5% of recent candle structures, showing there have been attempts to bid price higher, but the minimal 7.3% upper wicks tell us those rallies are getting faded quickly. That's classic distribution behavior where each bounce gets sold into.
Bollinger Bands provide additional context for potential targets. Price is currently trading just below the middle band at $2.07, with the upper band at $2.11 and lower band at $2.03. The bands are relatively tight, suggesting we're in a consolidation phase that's likely to resolve with a directional move soon. The MFI (Money Flow Index) at 43.0 sits below the midpoint, confirming that money flow is leaning negative but not extreme. This supports the thesis of a measured grind lower rather than a panic sell-off.
From a price structure perspective, the lower high formation is the key bearish signal. After tagging $2.12 in the 24-hour session, price has failed to reclaim that level and instead printed a lower high, which is textbook bearish price action. The internal market state shows a bearish bias with a trending regime and only 26.4% directional confidence, suggesting the move might not be explosive but rather a methodical drift lower. The alignment score of 4 and the bear stack dominating (4 bearish indicators vs 1 bullish) reinforce this directional lean.
For a trading setup, I'm looking at short entries on any bounce toward the $2.075-$2.08 zone, particularly if we see rejection wicks forming at the EMA20. The stop loss would sit just above the resistance cluster at $2.095, providing about 20 pips of breathing room while staying below the HMA55. A close above $2.095 would invalidate the bearish structure and suggest buyers are regaining control, so that's a logical invalidation point. First take profit target comes in at the Bollinger lower band at $2.03, offering approximately 4.5 cents of downside for roughly 2 cents of risk, which delivers better than 2:1 risk-reward. Second target would be the session low at $2.01, extending the potential reward to nearly 3.5:1 if we get full follow-through and momentum acceleration.
The key level to watch is $2.07, where the EMA50 and Bollinger middle band converge. If price breaks and holds below this level with volume confirmation, I'd expect acceleration toward $2.03 as there's minimal structural support in between. Conversely, if bulls want to flip the script, they need to reclaim $2.09 with conviction and push volume above that $21.5M average to prove there's genuine buying interest rather than just short-term bounce attempts. The 24-hour change of +1.41% shows we're still in positive territory for the day, but the intraday structure has deteriorated, and the failure to hold the EMA20 is a warning sign.
Risk management is crucial in this setup given the mixed signals from oversold indicators. While Stochastic at 12.2 suggests we're technically due for a bounce, trading against established bearish structure and weak volume is risky. The safer play is waiting for either a confirmed breakdown below $2.07 or a clear rejection from the $2.08-$2.09 resistance zone. If you're already short from higher levels, consider taking partial profits at $2.03 and trailing stops on the remainder toward $2.01. If you're looking to enter fresh, patience for a bounce into resistance offers better risk-reward than chasing current levels.
What are you thinking on this XRP setup? Are you fading the weakness for a bounce play off EMA50 support, or riding the bearish structure down toward those lower targets?
XRP/USDT Professional Analysis – SMA Breakout Validated🌐 Professional XRP/USDT Trade Map — Breakout, Targets, Risk Controls
Asset: XRP/USDT – “RIPPLE VS TETHER”
Crypto Market Opportunity Blueprint (DAY/SWING Trade) 🚀📊
🔥 TRADE PLAN OVERVIEW
Plan: Bullish plan confirmed with Simple Moving Average breakout 📈✨
Entry: YOU CAN ENTRY ANY PRICE LEVEL 🟩🟢
This structure is built on momentum continuation + clean SMA upside confirmation.
🛡️ STOP LOSS GUIDANCE
Stop Loss: This is thief SL @ 2.0000
Dear Ladies & Gentleman (Thief OG's) — adjust your SL based on your strategy & your own risk.
⚠️ Note: I am not recommending you to set only my SL. It's your own choice; you can make money then take money at your own risk.
🎯 TARGET LEVEL – PROFIT MANAGEMENT
Target: TRIANGULAR Moving Average acts as a strong resistance + overbought zone + trap region.
📌 OUR target @ 2.3000 — kindly escape with profits before the trap activates.
⚠️ Note: Dear Ladies & Gentleman (Thief OG's), I am not recommending you to set only my TP. It's your own choice; you can make money then take money at your own risk.
🌍 RELATED PAIRS TO WATCH — CORRELATIONS & KEY POINTS
Monitoring correlated assets gives extra confirmation of trend strength, liquidity flow, and momentum shifts. Here are the pairs to keep an eye on:
💠 1. BINANCE:BTCUSDT – Bitcoin Controls Crypto Liquidity
Why watch it:
BTC is the macro driver of overall crypto momentum.
A bullish BTC → stronger inflow into alts like XRP.
If BTC rejects from key levels, XRP often slows or traps.
Key correlation:
Rising BTC dominance can limit XRP upside.
Falling dominance supports large-cap alt breakouts.
💠 2. BINANCE:ETHUSDT – Ethereum Trend Confirms Alt-Market Strength
Why watch it:
ETH often leads altcoin rotations; when ETH trends strong, major alts follow.
ETH breaking resistance = broader bullish environment for XRP.
Key correlation:
Strong ETH liquidity → better confidence for XRP swing trades.
💠 3. BINANCE:XLMUSDT – Directly Related Utility Sector Coin
Why watch it:
XLM and XRP often move with similar cross-border payment narratives.
When XLM surges first, XRP commonly follows with a delayed reaction.
Key correlation:
Positive XLM momentum strengthens confidence in XRP bullish setups.
💠 4. BINANCE:ADAUSDT – Risk-On Altcoin Indicator
Why watch it:
ADA rallies typically signal strong retail participation in altcoins.
Helps confirm whether the market is in alt season rotation mode.
Key correlation:
ADA strength → XRP follow-through probability increases.
💠 5. BINANCE:XRPBTC – Relative Strength Indicator
Why watch it:
If XRP/BTC is rising, XRP is outperforming Bitcoin → strong signal.
If XRP/BTC is dropping, XRP bullish trades may weaken or get trapped.
Key correlation:
XRP/BTC breakout = highest-quality long confirmation.
📌 SUMMARY FOR TRADINGVIEW READERS
This XRP blueprint delivers a clear bullish continuation setup powered by SMA breakout momentum, structured risk guidance, and a realistic trap-aware profit target. Monitoring correlated pairs amplifies your confidence, especially during critical breakout or overbought zones.

XRPUSDT Analysis : Bullish Channel Continuation After Liquidity 🐻 Bearish Channel Confirmation
The most prominent feature is the downward channel (the green shaded area) that has been containing the price action since the major high in July/August.
The Trend: The market has been making lower highs and lower lows, confirming a strong downtrend.
Channel Respect: The price bars (candles) consistently bounce off the channel's upper and lower boundaries, indicating that traders are respecting this structure.
Continuation: The note "Market is in Channel" and "From Here I Analyzed It Still Running" confirms the analyst's belief that the downtrend is likely to continue in the near term, keeping the price contained within the green parallel lines.
💧 The Liquidity Magnet
A key part of the current analysis is the expectation of the price reaching a specific low point, often referred to as a liquidity zone or demand zone.
Target: The chart specifically marks a horizontal line around the $1.20 - $1.00 area with the note: "This liquidity will filled."
Analyst’s Logic: In technical analysis, large market orders often sit below prior significant lows (a 'liquidity pool'). The analyst anticipates that the final phase of this downtrend will be a sharp move down (liquidity grab) to trigger these sell orders and fill the demand from institutions or "smart money."
🚀 The Projected Reversal: Heading into 2026
The analysis outlines a distinct two-stage prediction for the future price action: a final drop followed by a massive surge.
Stage 1 (Final Drop): The projected path shows the price breaking out of the channel to the downside and plunging towards the marked liquidity zone (around $1.00-$1.20) in late December or early 2026. This completes the bearish structure.
Stage 2 (The Bounce): Immediately after filling the liquidity, the chart projects a sharp reversal and an aggressive move upward, forming a large V-shaped recovery. The arrow indicates a significant potential rally, suggesting the start of a new, long-term bullish trend that could break the previous highs.
💡 Content Points for the Minds Section
For a more detailed explanation on Minds, you can expand on the following concepts:
Downtrend Structure: Explain that the bearish channel defines the current macro-trend. Until the price breaks convincingly above the channel's upper boundary, the overall direction remains down.
Why Liquidity is Key: Discuss the concept of "selling to the buyers." A deep wick or move to the $1.00-$1.20 area is necessary to clear out weak hands, trigger stop losses, and allow large players to accumulate at a discount before the rally begins.
The Timeframe: Stress that this is a long-term (1D chart) analysis. The expected moves will take weeks or months to fully materialize, especially the final bullish push into 2026.
Confirmation Signals: What would invalidate the analysis? If the price breaks above the top of the channel before hitting the liquidity zone, the bearish move would be cancelled. What confirms it? A sharp spike down to the $1.00 area followed by an immediate, strong candle close back up.

Xrp? Watching
Hi,
These levels are only convictions, where I'm predicting where it's going.
Sometimes, even with strong biased. Still stops are hit.
Wide enough to breath, not too big so TP will be reasonable.
So investing is another story altogether.
All the best
Not a guru

XRP USDT - HARMONIC GARTLEYI am observing Harmonic Gartley for XRP USDT on a weekly chart.
If it crosses death valley, it seems possible to reach 2 USDT by mid-October.
Of course, this is not investment advice , it is my personal analysis.
Good luck.

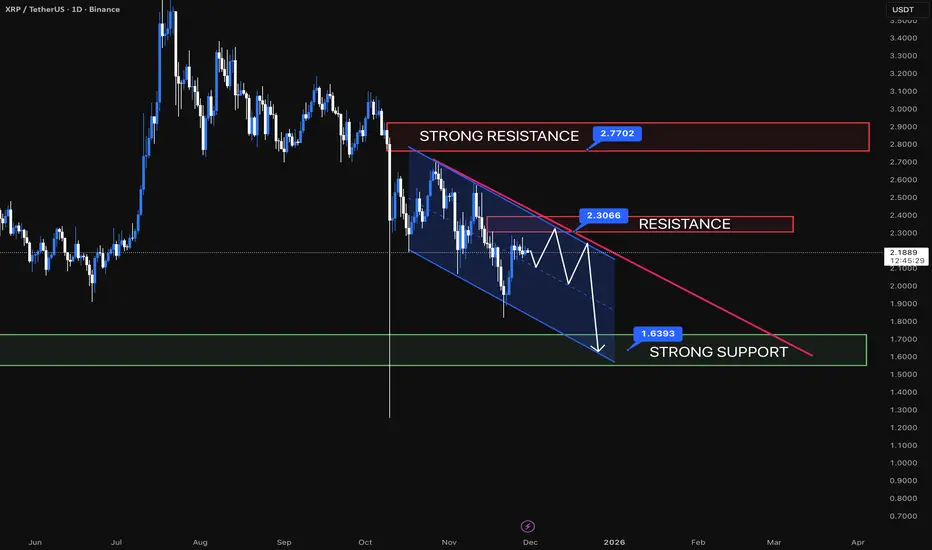
XRPUSDT /// 30NOVRipple, a project often surrounded by controversy, appears to have entered another period of low momentum. The $2.30 resistance may continue to cap price for an extended period, and an even stronger supply zone exists around $2.77, where sellers have historically shown significant activity. If price were to revisit that area, it could once again trigger downward pressure toward the $2.00 region or lower.
Overall, XRP is currently trading within a micro-channel structure, where the downward bias appears stronger than the bullish momentum. This raises an important question for long-term followers of the project:
Where could a potential investment zone be considered?
Based on the chart, the $1.40–$1.60 area could be a reasonable region for a speculative, swing-oriented entry—provided that the structure and quality of the move into that zone become clear. Observing the nature of the decline will be essential to determine whether XRP has the potential to recover from that level or if it is likely to remain in a prolonged low-volatility phase.
As always, these scenarios depend on broader market conditions and the strength of momentum as price approaches key levels.
XRP Breakdown Risk: Triangle + Resistance = DropXRP( BINANCE:XRPUSDT ) is moving within a resistance zone($2.32-$2.19) and has shown notable reactions to the resistance line and the Potential Reversal Zone(PRZ) .
From a technical analysis perspective, it seems that XRP has formed a Symmetrical Triangle Pattern. If the lower line of this pattern is broken, it would align with our analysis.
Additionally, from an Elliott Wave theory standpoint, we expect the next corrective wave for XRP, and a break of that lower triangle line would confirm this expectation.
I expect that in the upcoming hours, XRP will begin a downward trend and test the support zone($2.16-$2.11). If it breaks through that support, we can expect further declines toward the next support zone($2.04-$2.00) and Cumulative Long Liquidation Leverage($2.04-$2.02).
First Target: $2.133
Second Target: $2.069
Third Target: $2.043
Stop Loss(SL): $2.330
Cumulative Short Liquidation Leverage: $2.30-$2.25
Cumulative Long Liquidation Leverage: $2.16-$2.13
💡 Please respect each other's opinions and express agreement or disagreement politely.
📌 XRP Analyze (XRPUSDT), 1-hour time frame.
🛑 Always set a Stop Loss(SL) for every position you open.
✅ This is just my idea; I’d love to see your thoughts too!
🔥 If you find it helpful, please BOOST this post and share it with your friends.

Time for XRP?CRYPTOCAP:XRP ➖ Time for XRP?
I checked CoinMarketCap and saw the coin is currently ranked 6th in searches, so I got curious about what's going on with it.
Like every other coin, it dropped hard together with the market on Monday and triggered a ton of trader stop losses.
Looking at the liquidation heatmap, there is still room for upside along with Bitcoin. Basically this will just be a corrective bounce before we head even lower. We'll wipe out the shorts first and then drill a new bottom.
➖ Entry around $2.0210 with a target of $2.3700, good for roughly +17%.
Unless aliens and reptilians don't step in and mess with this little XRP bounce of course 🦖👽.

XRP 4H – Trendline Test, But Is Liquidity Next?XRP is testing a clean descending trendline that has been rejecting price since early November. Today’s move taps that same trendline while also running directly into the 50 EMA and 100 EMA — creating a tight confluence zone that historically produces strong reactions. Price is also sitting inside the 0.5–0.618 Fibonacci band, with the 0.786 level acting as the upper cap of the current retracement.
Below, the $1.8476 level remains a clear liquidity target from the November sweep, and the Stoch RSI is already stretched into overbought territory. Bulls need a decisive breakout and retest above the trendline to invalidate the downside liquidity draw. Bears are watching for another clean rejection into a move toward the purple liquidity line.
Expect volatility as XRP decides between breakout continuation or a liquidity-seeking reversal.

XRPUSDT – Another Try?Alright traders, here we go again.
Another long attempt on XRP —
because honestly, things are finally looking way better than before. 😄
It might actually behave today…
maybe.
Quick setup, clean structure, decent momentum.
Nothing more to add — just trade safely
and let’s hope XRP doesn’t troll us this time. 🚀🤞
