Winter Is ComingCan you feel the chill in the market?
Charts look silent, but deep down, something massive is moving.
Winter is coming and only the prepared will survive.
Hello✌️
Spend 2 minutes ⏰ reading this educational material.
🎯 Analytical Insight on Ripple:
XRP is testing a strong support while moving on the descending channel. A confirmed breakout with solid volume could drive a 20% rally, targeting 2.90$. 📊🚀
Now , let's dive into the educational section,
🌐 Signs of the Coming Winter
Every crypto cycle has its cold season the phase when volumes dry up, fear rises, and confidence slowly fades. Experienced traders spot the signs before the crowd. One of the best ways to detect this shift on TradingView is through the Volume Profile. It reveals where most trading activity has occurred and how liquidity is shifting.
When the market starts losing momentum, volume drops near resistance zones. Combine this with RSI, and the picture gets clearer: if RSI floats between 40 and 60 for too long without breaking higher, buyers are losing strength. That’s usually when the air turns cold.
🧭 TradingView Tools for Surviving the Winter
When markets freeze, precision becomes survival. The combination of the 200-Day Moving Average and the Ichimoku Cloud works like a compass in the storm. If price stays below the MA200 and inside the Ichimoku Cloud, the trend is still in the bearish zone.
Use TradingView’s Alert System to set notifications at major support and resistance levels. This way, you won’t miss key moments and more importantly, your decisions won’t be emotional. Winter rewards discipline, not luck.
💭 The Trader’s Mind in Cold Markets
The real winter starts in the trader’s mind. When fear dominates, many fall into Paralysis by Analysis endless studying, no action.
Keep a Trading Journal, plan your scenarios before they happen, and define your stop-loss tolerance. Having pre-written plans transforms hesitation into confidence. Winter isn’t the time to doubt yourself it’s the time to stay systematic.
🧊 The Role of Whales in Shifting Seasons
Whales always sense the change of season first. When large on-chain transactions increase, something big is brewing.
By monitoring On-Chain Indicators in TradingView, you can see if capital is flowing into or out of wallets.
But remember: this data isn’t an instant buy or sell signal it’s a quiet warning. Whales move in silence, and only those listening closely catch the shift before it’s visible on the charts.
🕯️ After Every Winter, a Dawn Arrives
No bear market lasts forever. After every decline, there’s a point where sellers get exhausted that’s when smart money starts accumulating.
Using Dollar Cost Averaging (DCA) during the cold phase builds powerful long-term positions. Winter is not the time to run; it’s the time to build.
🧩“Winter Is Coming”
defines the psychology of every bear market. It’s the reminder that downturns are natural, that every bullish phase ends with exhaustion, and that the real professionals are those who prepare when others celebrate.
The “winter” of the crypto market symbolizes declining liquidity, fading momentum, and emotional fatigue. Surviving it requires discipline, patience, and smart use of tools like TradingView’s Volume Profile, RSI, and Alerts.
In both markets and life, winter always comes but for those who plan ahead, it’s not the end. It’s the beginning of the next opportunity cycle.
Always analyze indicators before entering a trade – never let emotions dictate your actions.
Set stop-losses and manage risk – protecting capital is more important than short-term gains.
✨ Need a little love!
We pour love into every post your support keeps us inspired! 💛 Don’t be shy, we’d love to hear from you on comments. Big thanks, Mad Whale 🐋
📜Please make sure to do your own research before investing, and review the disclaimer provided at the end of each post
Trade ideas

#XRPUSDT: Swing Buy At 2.60, Possible Target At 3.50! We have strong bullish confirmation in smaller time frames that we can take a swing buy entry on XRPUSDT. There is a single major target at 3.50 but the price could move beyond that region. Please like and comment on the next cryptocurrency pair you would like us to analyse.
Team Setupsfx

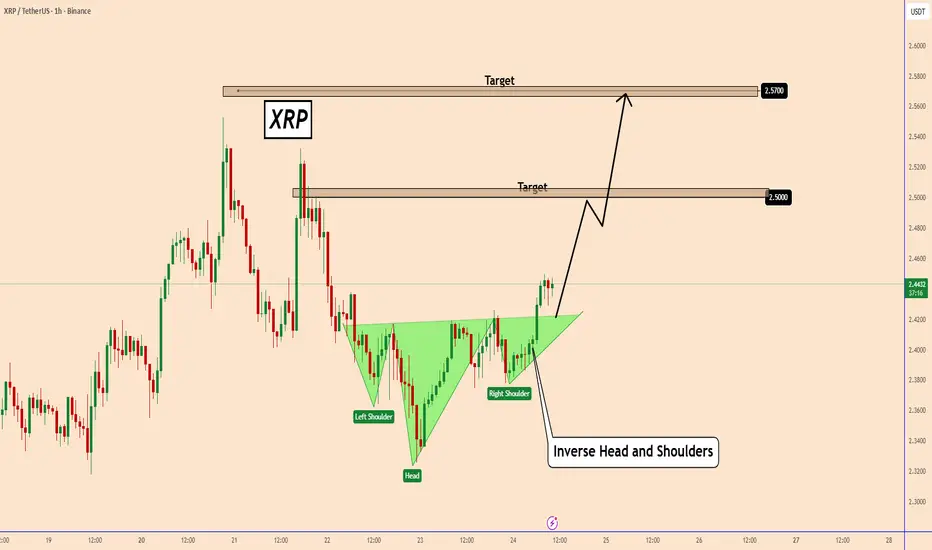
XRP Prepares to Resume Uptrend with an Inverted H&SH PatternXRP Prepares to Resume Uptrend with an Inverted H&SH Pattern
On the 60-minute chart, XRP confirmed a clear bullish pattern. The price has already broken out of the neckline of an Inverted Head and Shoulders pattern, indicating that the bullish trend is emerging again.
If the price holds strong around this area, there is a good chance that XRP will perform well in this short-term trading setup, possibly reaching targets today or over the weekend.
Main targets:
2,500
2,570
You may find more details in the chart!
Thank you and Good Luck!
❤️PS: Please support with a like or comment if you find this analysis useful for your trading day❤️
XRP - BIG OI Rise - we`ll take short in a caseXRP - BIG OI Rise - we`ll take short in a case
clear strucutre change
becasue such oi often end with big move

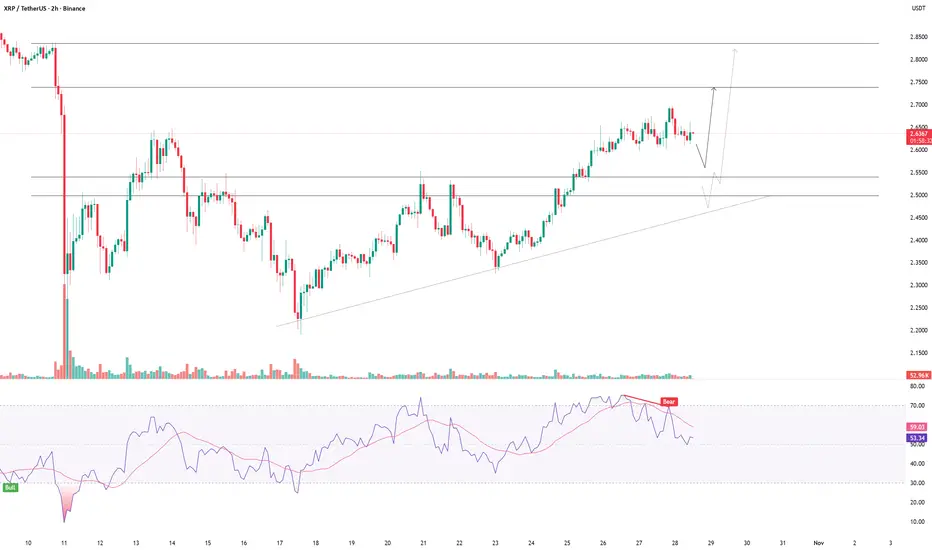
XRP's situation+next targets and expected movementsAs you can see, the price is forming two bullish patterns on the 4h timeframe, If my view is correct, XRP will rise to $2.8
And if this pattern is correct and breaks, higher targets are possible.

Lingrid | XRPUSDT Bearish Pressure Continues BINANCE:XRPUSDT continues its decline within a well-defined downward channel after facing rejection near the resistance trendline. The pair remains trapped under a bearish structure marked by lower highs and lower lows. Unless it breaks above 2.50, the bias stays bearish with potential continuation toward 2.10. Overall momentum reflects sustained selling pressure as the market follows its descending trajectory.
⚠️ Risks:
A sudden shift in BTC sentiment could invalidate the bearish setup.
A breakout above 2.45 would signal a reversal toward 2.83.
Unexpected regulatory or liquidity events could distort short-term technical flows.
If this idea resonates with you or you have your own opinion, traders, hit the comments. I’m excited to read your thoughts!

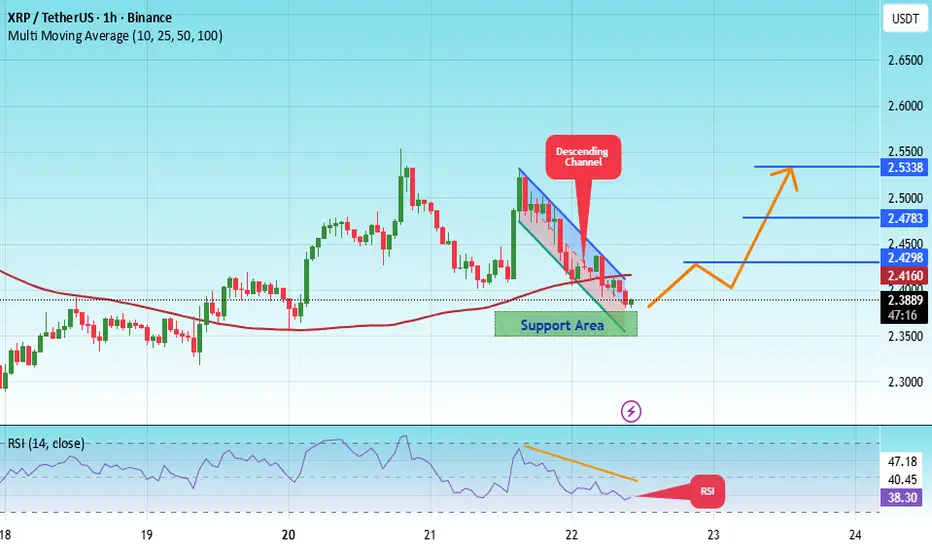
#XRP/USDT (1H) chart, here’s a full technical read:#XRP
The price is moving within a descending channel on the 1-hour frame, adhering well to it, and is heading for a strong breakout and retest.
We have a bearish trend on the RSI indicator that is about to be broken and retested, which supports the upward breakout.
There is a major support area in green at 2.36, representing a strong support point.
We are heading for consolidation above the 100 moving average.
Entry price: 2.38
First target: 2.41
Second target: 2.47
Third target: 2.53
Don't forget a simple matter: capital management.
When you reach the first target, save some money and then change your stop-loss order to an entry order.
For inquiries, please leave a comment.
Thank you.
XRPUSDT → Pre-breakout base. Are the bulls back?BINANCE:XRPUSDT is attempting to break through the resistance of the trading range as part of a bullish run across the entire market. There is a chance that a breakthrough could form after a pullback...
The market is gradually buying back the liquidation that occurred on October 10. Bitcoin is breaking the structure, which indicates a possible return of the bulls. This sets a positive tone for the cryptocurrency market.
XRP is testing resistance and entering a consolidation phase. The trigger that could provoke growth is 2.661. However, as part of the consolidation, the market may test support before growth in order to hunt for liquidity.
Resistance levels: 2.661, 2.739
Support levels: 2.587, 2.547, 2.500
Since the opening of the session, the market has formed a fairly strong momentum, and at the beginning of the European trading session, a correction may form before the growth continues. As part of the correction, XRP may form a pullback to 2.587 - 2.500.
Best regards, R. Linda!

XRP RIPPLE XRP is a digital asset and cryptocurrency developed by Ripple Labs, primarily designed for fast and low-cost cross-border payments. It serves as a bridge currency in Ripple’s payment network (RippleNet), enabling financial institutions to transfer money globally with improved speed and reduced costs compared to traditional banking systems.
Key Features of XRP
Speed: Transactions take 3-5 seconds to settle, significantly faster than traditional wire transfers.
Low Cost: Transaction fees are minimal, making it suitable for micropayments and international transfers.
Scalability: XRP can handle around 1,500 transactions per second, much higher than Bitcoin or Ethereum.
Decentralized Ledger: XRP runs on the XRP Ledger, a decentralized blockchain-like system maintained by a network of independent validators.
Use Cases
Cross-border Payments: Banks and payment providers use XRP to source liquidity on-demand, avoiding the need to hold multiple fiat currencies.
Remittances: Enables cheaper and faster remittance transfers worldwide.
Microtransactions and Digital Content Payments: Its low fee structure supports small-value transactions efficiently.
Market Overview
XRP is among the top cryptocurrencies by market capitalization.
It has experienced regulatory scrutiny, most notably with the U.S. SEC lawsuit filed by the SEC against Ripple Labs, resulting in legal debates around its classification as a security.
Despite challenges, XRP retains a strong community and ongoing institutional partnerships.
Summary
XRP is a fast, scalable cryptocurrency designed for cross-border payments and liquidity provision, used in RippleNet global payment solutions. It offers efficiency improvements over conventional payment rails and remains significant in the crypto ecosystem.

700% XRP Trade — The Exact Strategy I UsedThe XRP Trade That Made 700% — Full ICT Breakdown!
In this video, I break down my 700% XRP trade that I called out on the channel — exactly how I entered, why I entered, and how I managed the position.
I also explain why you don’t need to overcomplicate trading by drilling down to the 15-minute or 5-minute charts — sometimes, the cleanest ICT setups are right on the higher timeframes.
If you’ve been struggling to find consistency, this video will show you how powerful HTF liquidity plays can be when combined with patience and clear structure.
📈 Covered in the video:
Full breakdown of my XRP 700% trade
The exact HTF setup I used
How I manage risk and secure profits
Why ICT trading doesn’t need to be complicated

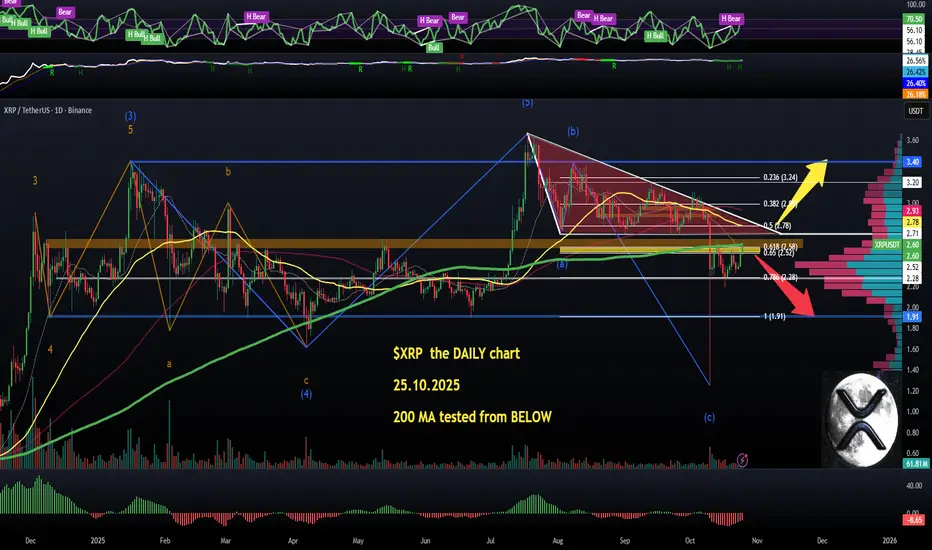
$XRP (DAILY): THE key 200 MA being TESTED from belowCRYPTOCAP:XRP has been fighting HARD TO RECOVER some of its lost value after topping out at $3.67 in JULY.
The #XRPArmy is bloody but not yet beaten, it seems, trying to reclaim the all-important (fat green line, 200 MA just above the GOLDEN POCKET) BEAR/BULL line in the sand.
So, the $2.6~ zone is a pivot level, a long-term horizontal resistance/support level, #XRP MUST close above to flip the MARKET Structure BULLISH.
The worst part of a correction may be finished for now, yes, but this is still a heavy RESISTANCE AREA, not to mention a HIDDEN BEAR RSI divergence flashing.
So, in a nutshell:
1) either a strong show of INTENT to push the price above fib 0.5 ($2.78) in order to continue upwards and toward the BEAR Liquidation zone ($3.05+)
2) or a rejection in the current zone, DAILY CANDLE CLOSES below the 200 MA and further bleeding towards $2.28.
For now, a BEAR MARKET coin until proven otherwise.
💙👽
XRPUSDT - BULLISH CONTINUATION IN SIGHTSymbol - XRPUSDT
XRPUSDT is making an attempt to break above the upper boundary of its trading range amid a broader bullish rebound across the cryptocurrency market. A confirmed breakout could develop after a short-term pullback.
The market continues to recover from the liquidation event of last week, with Bitcoin displaying structural strength - hinting at a possible return of bullish momentum. This supports a more optimistic outlook for the overall crypto sector.
Currently, XRPUSDT is testing resistance and entering a consolidation phase. The main breakout point sits near 2.661 However, during consolidation, a retest of support levels remains possible as the market may seek liquidity before a potential upside move.
Resistance levels: 2.661, 2.739
Support levels: 2.587, 2.547, 2.500
Since the beginning of the session, momentum has remained notably strong, though a short correction could occur before the upward trend resumes. During this corrective phase, XRPUSDT may retrace toward the 2.587 – 2.500 zone to gather liquidity before continuing higher.
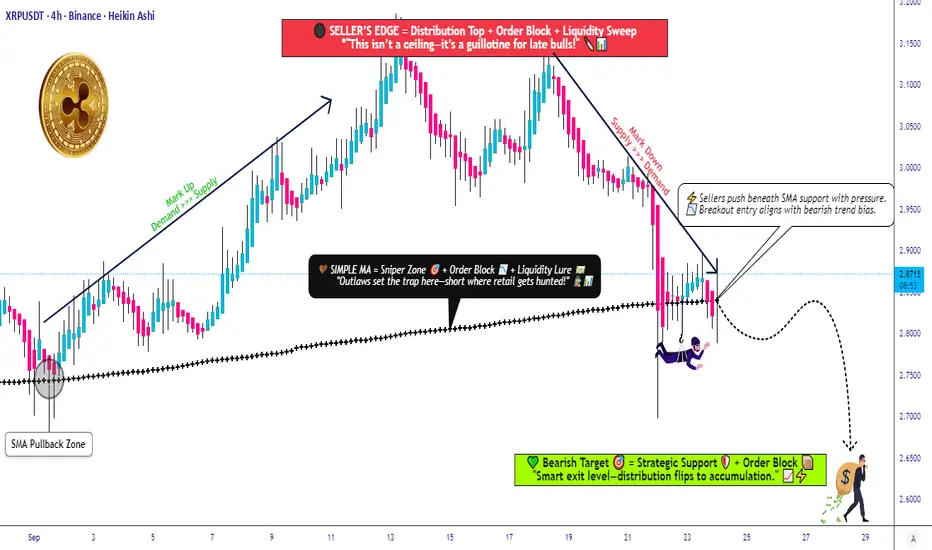
Ripple vs Tether: Key Technical Levels Every Trader Should WatchXRP/USDT | "RIPPLE vs TETHER" Market Wealth Strategy Map (Swing/Day Trade)
📊 Plan:
We’re eyeing a bearish confirmation if candles break below the 0.786 Fibonacci zone + SMA breakout @ 2.8300. At that point, sellers could gain momentum and dominate short positioning.
💡 Thief Strategy Highlight → Using a layered entry style (multiple limit orders). This method allows staggered entries rather than “all-in at once.”
🎯 Layered Short Entries (Sell Limits):
2.9300
2.9000
2.8800
2.8600
(You can expand layers based on your own strategy adjustment.)
🛑 Stop Loss (Thief SL):
Placed near 3.0000 — but ⚠️ please note: Risk management is personal. Thief OG’s — make your own choices. My SL is just an example.
✅ Target (Thief TP):
The “police barricade” (aka strong resistance zone with overbought pressure + possible trap) aligns around 2.6500. That’s where profit-taking may be wise before liquidity hunters catch us.
Again, this is flexible — adjust TP to your own risk/reward plan.
🔗 Related Pairs to Watch
$BTC/USDT → Major market leader, XRP often follows Bitcoin’s momentum.
$ETH/USDT → Correlation with altcoin sentiment; strong ETH moves ripple across XRP.
$ADA/USDT & $SOL/USDT → Competing Layer-1s, often mirror similar retail/institutional flows.
$XLM/USDT → Direct cousin of XRP, highly correlated in macro movements.
Watching these can help confirm broader market bias & correlation flows.
✨ “If you find value in my analysis, a 👍 and 🚀 boost is much appreciated — it helps me share more setups with the community!”
⚠️ Disclaimer: This is a Thief style trading strategy shared just for fun & community engagement. Not financial advice. Manage your own risk, make your own decisions.
#XRP #Ripple #CryptoTrading #SwingTrade #DayTrading #Fibonacci #TechnicalAnalysis #CryptoCommunity #TradingStrategy
XRP XRPUSDTXRP is a digital asset and cryptocurrency developed by Ripple Labs, primarily designed for fast and low-cost cross-border payments. It serves as a bridge currency in Ripple’s payment network (RippleNet), enabling financial institutions to transfer money globally with improved speed and reduced costs compared to traditional banking systems.
Key Features of XRP
Speed: Transactions take 3-5 seconds to settle, significantly faster than traditional wire transfers.
Low Cost: Transaction fees are minimal, making it suitable for micropayments and international transfers.
Scalability: XRP can handle around 1,500 transactions per second, much higher than Bitcoin or Ethereum.
Decentralized Ledger: XRP runs on the XRP Ledger, a decentralized blockchain-like system maintained by a network of independent validators.
Use Cases
Cross-border Payments: Banks and payment providers use XRP to source liquidity on-demand, avoiding the need to hold multiple fiat currencies.
Remittances: Enables cheaper and faster remittance transfers worldwide.
Microtransactions and Digital Content Payments: Its low fee structure supports small-value transactions efficiently.
Market Overview
XRP is among the top cryptocurrencies by market capitalization.
It has experienced regulatory scrutiny, most notably with the U.S. SEC lawsuit filed by the SEC against Ripple Labs, resulting in legal debates around its classification as a security.
Despite challenges, XRP retains a strong community and ongoing institutional partnerships.
Summary
XRP is a fast, scalable cryptocurrency designed for cross-border payments and liquidity provision, used in RippleNet global payment solutions. It offers efficiency improvements over conventional payment rails and remains significant in the crypto ecosystem.

BUTTERFLY BEARISH PATTERN FOR XRPI've check XRP and its making a butterfly bearish pattern. (4 hour time frame)
- As we can see in our TA. The price is increasing but the RSI is going down. It is showing weakness.
We might see a short term bearish movement for XRP. Lets wait for more signals to come for us to support our technical analysis. Stay tuned! I'll be updating this technical analysis if we see more signal to come.
Lets go! Trade at your own risk and always do your own research!

XRPUSDT.P - October 25, 2025XRPUSDT is showing bullish momentum with a potential continuation toward the 3.1327 resistance zone, making this a medium-risk long setup. Move the stop level to 2.7152, and while it’s recommended to take full profit at 3.1327 for a better RRR, traders may choose to take partial profit and move the stop to breakeven or simply adjust the stop to breakeven within that range.

XRPUSDT.P - October 28, 2025Entry price is at 2.6375 with a market order; if price has moved slightly higher, consider placing a better limit order entry. Profit level is set at 2.6969, stop level at 2.5976, and move stop level to breakeven at 2.6614. Based on the recent consolidation and breakout attempt, this is a medium-risk setup due to moderate volatility and proximity of stop to recent swing lows.

Ripple vs Tether — Can Bulls Escape the Resistance Trap?📌 TradingView Idea Description (XRP/USDT Thief Strategy)
Asset: XRP/USDT — “Ripple vs Tether”
Market: Crypto Wealth Strategy Map (Swing/Day Trade)
Bias: 🔵 Bullish Setup
🗺️ Trading Plan
Entry Style (Thief Layer Strategy):
Multiple buy-limit layered entries →
✅ 2.8000
✅ 2.8500
✅ 2.9000
✅ 2.9500
(Layers can be increased based on your own risk tolerance)
Stop Loss (Thief SL):
@ 2.7000 (personal setup — adjust as per your own risk appetite)
Target Zones:
🎯 Primary Target: 3.1500 → Key resistance zone + overbought condition + potential bull trap (take profits smartly).
🎯 Secondary Target: 3.3500 → Strong resistance cluster (“police barricade” zone) + overbought trap risk (partial/exit profits advised).
⚠️ Important Notes
👥 Dear Ladies & Gentlemen (Thief OGs):
I’m not recommending my exact stop loss or target — these are my personal levels.
Manage your own risk responsibly: “Make money, then take money at your own risk.”
This strategy is built around layered entries for flexibility in volatile markets.
🔍 Correlation & Related Pairs to Watch
Ripple (XRP) often shows sentiment correlation with broader altcoin momentum and BTC’s dominance. Key pairs worth monitoring for confirmation:
BINANCE:BTCUSDT → Bitcoin drives overall crypto market liquidity.
BINANCE:ETHUSDT → Strong ETH moves can influence Ripple flows.
BINANCE:XLMUSDT → Stellar often mirrors or diverges from XRP due to similarity in use cases.
BINANCE:ADAUSDT → Watch ADA for altcoin sentiment correlation.
Monitoring these pairs can give early signals of potential XRP strength or weakness.
✨ If you find value in my analysis, a 👍 and 🚀 boost is much appreciated — it helps me share more setups with the community!
📜 Disclaimer
This is a “Thief Style” Trading Strategy, shared for educational & entertainment purposes only.
Not financial advice. Trade responsibly — risk management is your best weapon.
#XRP #Ripple #Crypto #Altcoins #USDT #TradingStrategy #SwingTrade #DayTrade #LayeredEntries #ThiefStrategy

XRP still RANGING.Waiting patiently for confirmation as XRP still consolidating. Knowledge, Risk Management and Psychology are keys to being a consistent profitable trader.

[SeoVereign] RIPPLE BEARISH Outlook – October 27, 2025Hello everyone,
This idea presents a bearish (short) outlook on Ripple (XRP).
Currently, Ripple has reached a major resistance zone following a short-term upward movement,
and from a technical standpoint, a corrective phase is likely to occur.
Basis — BEARISH BAT PATTERN (Alternate Bat Pattern)
Structurally, Ripple has entered the PRZ (Potential Reversal Zone) of a Bearish BAT Pattern.
This zone coincides with a price range that has historically shown strong selling pressure,
and typically, a downward reversal tends to occur once the pattern is completed.
Accordingly, the average target price is set around 2.3 USDT.
This perspective is based on data as of October 27,
and further detailed updates will be provided depending on future price developments.
Thank you for reading.

Ripple (XRP): Looking For Market Structure BreakBuyers are starting to show small dominance after the breakdown, which could easily turn into a decent market structure break if momentum continues. For now, this looks like a clean recovery phase — if buyers manage to secure this zone, we’ll be looking for continuation toward the upper targets.
Swallow Academy

XRPUSDT — consolidation before the next impulseOn the 1H chart, XRPUSDT is consolidating after a short pullback, forming a flag pattern above the 2.45 support area. Despite a few false breaks, buyers continue to defend the trendline, signaling demand absorption.
The 2.45–2.52 range remains pivotal. A breakout with confirmation could open the way toward 2.63 (Target 1) and 2.82 (Target 2) — the next supply zones. As long as the higher-low structure holds, the bullish scenario remains intact.
Fundamentally, XRP still shows resilience amid the broader altcoin weakness. Ripple’s ongoing expansion in cross-border payments and hopes for a clearer regulatory framework in the U.S. support investor confidence.
This is a classic accumulation phase — expectations may diverge from reality, but that’s where strong trends are born. Keep emotions aside and wait for a clean breakout signal.

$XRP Gearing for $5 Move The price of CRYPTOCAP:XRP is down 0.21% today however, should the asset break the ceiling of the symmetrical triangle, the $5 resistant seems feasible with investors and VC's migrating to utility tokens positioning for the so-called "Uptober".
Albeit all the bullish thesis, the Open Interest of CRYPTOCAP:XRP on all exchanges is down 2.15% losing roughly $1.3B.
