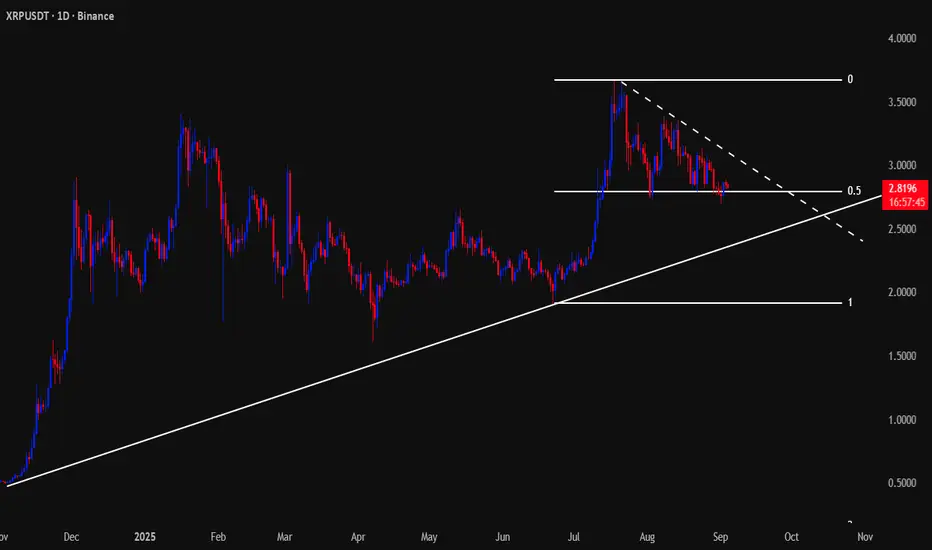
XRP Breakout ImminentOver the past 2.5 months, XRP has been in a healthy retracement from its all-time highs, forming what I see as a bullish structure:
• ✅ Double Bottom confirmed on the daily 0.618 Fibonacci retracement
• ✅ I entered my long position near the 0.618 level on the second bounce and have been accumulating throughout this consolidation
• ✅ Structure is forming a falling wedge, which is typically a bullish reversal pattern
• ✅ On the 4H timeframe, we are approaching a golden cross, adding further confluence for bullish momentum
As long as XRP holds the 0.618 Fib, I’ll continue to accumulate. A breakout from this wedge could open the door to higher targets, with key resistance levels at the 0.382 (≈2.88) and major resistance at 3.00+.
⸻
💭 My take: This chart setup looks like controlled consolidation before the next leg up. Patience and holding the 618 are key.
Trade ideas

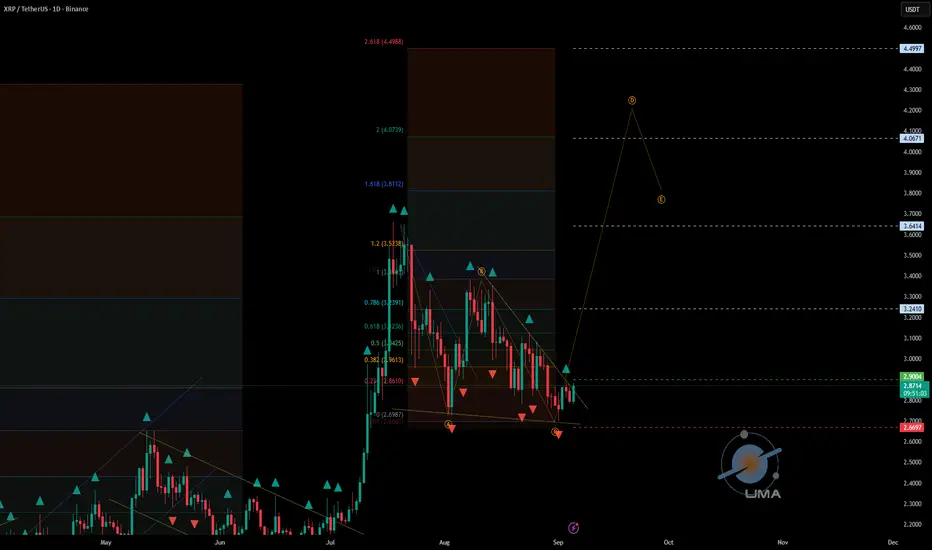
XRP wave5 to $4.29 Loading (ABCDE) Corrective wave near completeXRP wave5 to $4.29 Loading (ABCDE) Corrective wave near completion
we may or may not sweep the low, but the next move after will be historric. dont miss it., dont get tricked out.

what I will do with xrp“Expecting a pullback near 2.8712, aiming for 3.01. This represents a potential 5% move, with a protective stop around 2.79 (≈2.5%), giving a risk-reward ratio of 2:1.”
XrpusdtXrp now going higher Macd turning bullish also resistance likely will be broken today unless price falls back to support or if it loses support that’s would be very bad

RIPPLE: The Pivot MagnetExperimenting with stop orders on XRP and a few other altcoins.
Overnight, the price might be attracted to the daily PIVOT for the next day and then fall again to continue the trend.
Elliot Wave charting in altcoins is almost pointless. Instead, I have to rely on simple tricks like pivot levels, POC, and trend indicators.
Can continue going down, though.

XRP at a Crossroads: Two Scenarios For The Next Big MoveBefore looking ahead, lets review the current situation: Since December 2024 XRP has been consolidating in a sideways range between $2.00 and $3.50, similar to the pattern seen before last year rally.
After setting a new ATH, XRP has now entered a corrective phase with two possible Scenarios:
1: Break the support zone and drop toward $1.90-$2.10, followed by the start of a new bullish trend.
2: Hold the support zone and move upward toward the dynamic resistance. in this case, XRP could first reach $3.70 and if broke the dynamic resistance, another strong bullish wave similar to the previous one will happen
This analysis is personal opinion, Not financial advice.

XRPUSDTXRP/USDT Bullish Outlook
XRP is holding strong around $2.74, with buyers stepping in to defend key support. The momentum looks healthy, and if it keeps holding, we could see it push toward $2.95–$3.00.
Any dips to support could be good spots to enter, and overall the market feels optimistic and ready for a bullish move.

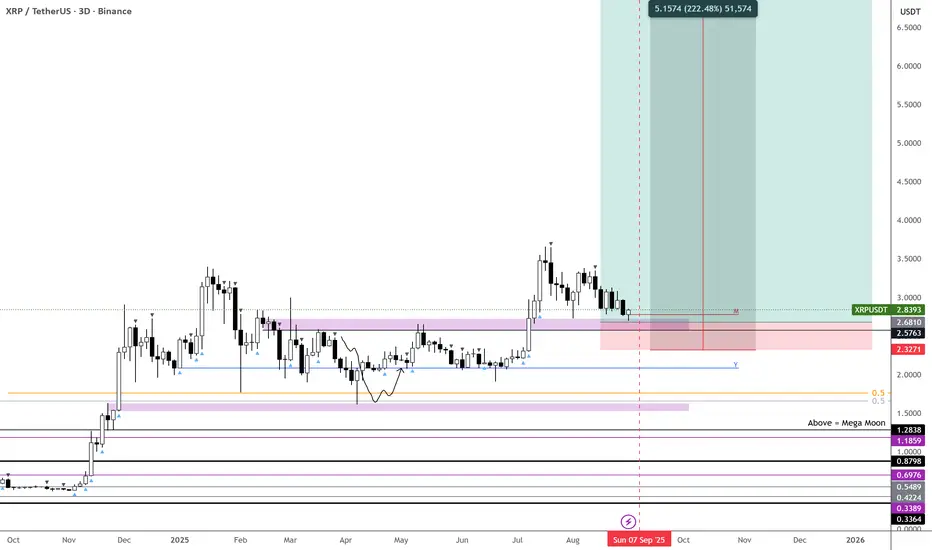
XRP — $2.5 Liquidity Zone Could Trigger the Next RallyAfter hitting a new all-time high (ATH) on 18th July, XRP failed to hold the previous ATH ($3.40) as support. This breakdown led to a –25% drop, finding support at the 0.5 Fib retracement of the $1.90 → $3.66 move, followed by a solid +24% bounce back to the pATH (200B MC at $3.36) and 0.702 Fib retracement → an ideal short opportunity.
Now XRP has been trending in a descending triangle pattern for 50 days, with $3 acting as the key resistance. This level is the Point of Control (POC) of the last 75-day trading range, adding weight to its importance. On top of that, the anchored VWAP (~$3.035) is currently reinforcing $3 as additional resistance.
🧩 Confluence Support Zone ($2.665–$2.45)
Liquidity cluster: many stop-losses reside here
Anchored VWAP (support): ~$2.62
Yearly anchored VWAP: $2.59 → strong support level
Golden Pocket (0.618–0.666): $2.5777–$2.4936
21 EMA ($2.665) / 21 SMA ($2.576) (weekly): dynamic HTF support
233 EMA ($2.44) / 233 SMA ($2.53) (daily): strong moving average cluster
Market Cap Support: $2.52 aligns with the $150B level
1.0 Trend-Based Fib Extension: $2.4498 → aligning perfectly with the $2.5 support zone as a reversal point
This creates a high-probability long entry zone between $2.665–$2.45, with multiple overlapping technical factors.
🟢 Long Trade Setup
Entry Zone: $2.665–$2.45
Stop-Loss: Below $2.25 for now, to be adjusted once price action confirms a reversal.
Potential Gain: up to +60% depending on execution
Technical Insight
After 50 days of correction, XRP is approaching a major liquidity and confluence zone.
The golden pocket, VWAP, EMA/SMA clusters, market cap support, and 1.0 Fib extension all stack together at around $2.5, making it a powerful reversal point.
Meanwhile, $3 remains the key resistance, reinforced by the POC of the last 75-day range and the anchored VWAP (~$3.035). Bulls must reclaim this level to confirm bullish continuation.
Key Levels to Watch
Support: $2.665–$2.45 (reversal zone)
Resistance: $3.00
🔍 Indicators used
Multi Timeframe 8x MA Support Resistance Zones → to identify support and resistance zones such as the weekly 21 EMA/SMA.
➡️ Available for free. You can find it on my profile under “Scripts” and apply it directly to your charts for extra confluence when planning your trades.
_________________________________
💬 If you found this helpful, drop a like and comment!

XRP 8H – Fib Support Holding, Liquidity Above 3.64 in Sight?XRP is holding steady above the 0.5 retracement at 2.79, with the golden pocket zone (0.5–0.618) acting as support. If buyers can maintain control here, a push toward the 3.64 liquidity level becomes the next upside target.
Failure to hold above 2.58 would open downside risk toward the 0.786 retracement at 2.29. This golden pocket remains the key battleground between continuation higher or deeper retracement.

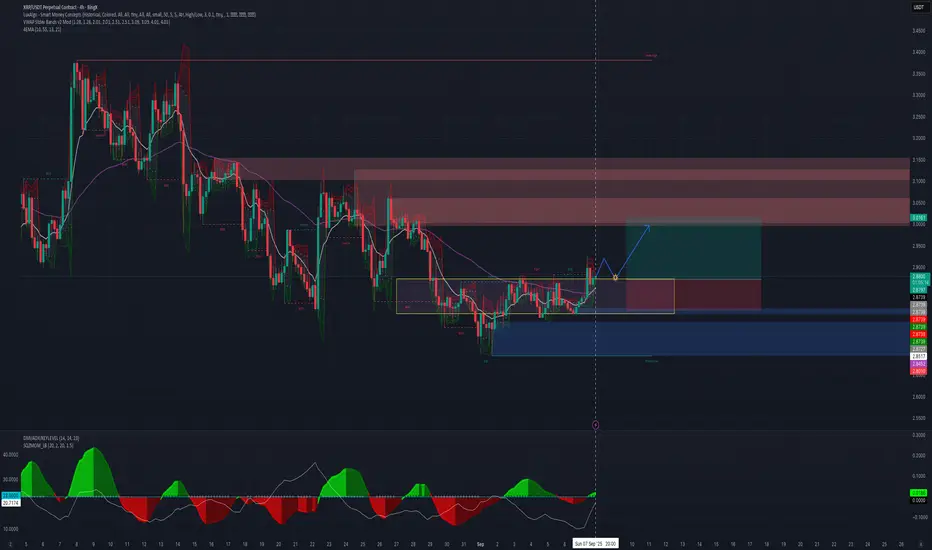
#XRPUSDT - UniverseMetta - Signal#XRPUSDT - UniverseMetta - Signal
D1 - Formation of ABC structure in continuation of the trend.
H4 - Formation of the 3rd wave + breakout of the trend line. Stop behind the minimum of the 1st wave.
Entry: 2.9004
TP: 3.2410 - 3.6414 - 4.0671 - 4.4997
Stop: 2.6697
Ripple (XRP): Looking For Explosive Movement HereXRP has now reached the zone of pressure, where buyers and sellers are both trying to take control. This compression usually doesn’t last long — we’re waiting for an explosive breakout or a sharp breakdown.
If buyers manage to reclaim the upper levels, we’ll have confirmation for a bullish continuation. If not, then the downside opens up quickly, and we’ll adapt accordingly. For now, patience is key until this range resolves.
Swallow Academy

XRP Ready? NFP Volatility+Bitcoin Rally Could Drive XRP to $3.10In today’s XRP update, we analyze the 4-hour chart as price consolidates just under key resistance. After defending $2.75, buyers have managed to push XRP back toward $2.87 and $2.93. These are the levels that will decide whether momentum shifts in favor of the bulls. If $2.93 is reclaimed, the path opens toward $3.09 and possibly higher. On the downside, supports remain at $2.81 and $2.75, with deeper zones at $2.67 and $2.65 if selling pressure increases.
This update also comes on a major day for global markets, with the U.S. Non-Farm Payrolls release driving volatility across assets. Bitcoin has already shown bullish attempts on the 4-hour chart, which I covered in detail earlier today on the channel. The big question now is whether XRP can align with that strength by breaking its own resistance barriers.
XRP Breakout Setup
XRP holding strong above breakout zone with healthy retest 🔁
Fibonacci confluence + support zone = bullish structure intact 🧱
Weekly candle showing strength — upside move likely if current momentum holds 🧨
🎯 Target: $4.67
🚀 Mid-levels: $3.00 → $3.38 → $4.00
LONG in play – structure respected, eyes on continuation 📈

XRP Price Update: Next Targets $2.93 and $3.19In today’s XRP update, we focus on the 4-hour chart where price is consolidating between $2.81 and $2.87. After defending the $2.75 level yesterday, XRP is trying to build a recovery structure. The big question now is whether buyers can reclaim $2.87 and push toward $2.93. A breakout there would open the path to $3.09, which is the key resistance on this timeframe.
On the downside, immediate support is at $2.81. If lost, pressure shifts back to $2.75, and below that the deeper buyer zones at $2.67 and $2.65 come into focus. My bias remains for upside, but confirmation comes only with resistance breakouts. Watch these levels closely as the short-term structure develops.

Daily XRP Analysis: Is XRP at an Explosion Point?As you can see on the chart, XRP is in a long-term upward trend. Recently, after a very strong upward leg, it has entered a complex correction. It has currently retraced 50% of its upward leg. We are still waiting for a trigger to activate for entry.
XRPUSDT SellXRPUSDT just broke my bullish counter trendline, I don't know long this move is going to last seeing as yesterday was a very bullish day. Hopefully, TP is hit and then they can move to where ever.

XRPusdtHi snipers. On the one-day timeframe, we are witnessing the formation of a bearish pattern. If the price breaks upward, we will probably see the price reach the specified resistances. I am learning and the analysis is not a buy or sell recommendation.

$XRP – Optimal Entry Zone
Honestly was expecting more from MARKETSCOM:RIPPLE , but it is what it is. We’re back at the second entry level — and this zone decides the next chapter.
📍 Buying zone: $2.50 – $2.70
⚠️ Invalidation: loses this level and it likely stays quiet for a while
🎯 Exit: take profits whenever it fits your plan
This is the kind of spot you want to pay attention to:
S/R flip ✅
Pivotal level ✅
Retest of breakout ✅
-30% from recent highs ✅
If you haven’t jumped into CRYPTOCAP:XRP yet, this is as good a level as it gets.
👉 Will LOL if this goes straight into $2 just to scare everyone out… only to send it into $5 on the next swing. BINANCE:XRPUSDT
XRP Setup – 200-Day EMA & 61.8% Fib ConfluenceAfter making a higher high in mid-July, XRP has been retracing to establish its higher low. The price is now approaching the 200-day EMA, the 61.80% Fibonacci retracement, and a key prior resistance zone around $2.60. This confluence creates a strong area where bulls may look to defend.
Trade Setup:
• Entry Zone: $2.50 – $2.60
• Take Profit Targets:
🥇 $3.10
🥈 $3.50
🥉 $3.80
• Stop Loss: $2.30

XRP Full Green Candle · Great News · Reaction at SupportXRP is looking great right now. There is nothing better than a good reaction at support.
Remember this support zone? The orange space on the chart.
This support zone has been tested multiple times since 2-Aug., a month ago. 30 days holding and this time we have the first bullish candle—full green—around this level and this means that the bulls are finally showing their face.
It is hard to believe that it has been already 45 days since the last high, but this is good because the retrace is running its course and as soon as it ends we get the next bullish wave.
More good news. The next major advance will be nothing like before. The last one lasted less than a month, the next one can go for 2-3 months or more. So at least twice the length of the previous one. There is still plenty of room available for growth.
Targets
These are the numbers based on the short-term. For the numbers we were using previously, more accurate, please find a previous publication. You can do so by going to @MasterAnanda and typing XRPUSDT on the search filter. Go a bit lower and you will see hundreds of charts with long-term targets and all-time high projections.
Thanks a lot for your continued support.
Namaste.

ETHUSDT SITTING AT STRONG SUPPORT + TRIANGLEThis has to be the absolute medium term support for ETH. Breaking of this support will lead to further downside, And if the Triangle is broken on the upside- expect a good rally in ETHUSDT.
We Bring you the most no-bs true to foundation old school real analysis to you everyday!
Genuine Questions and Comments are always welcomed :)

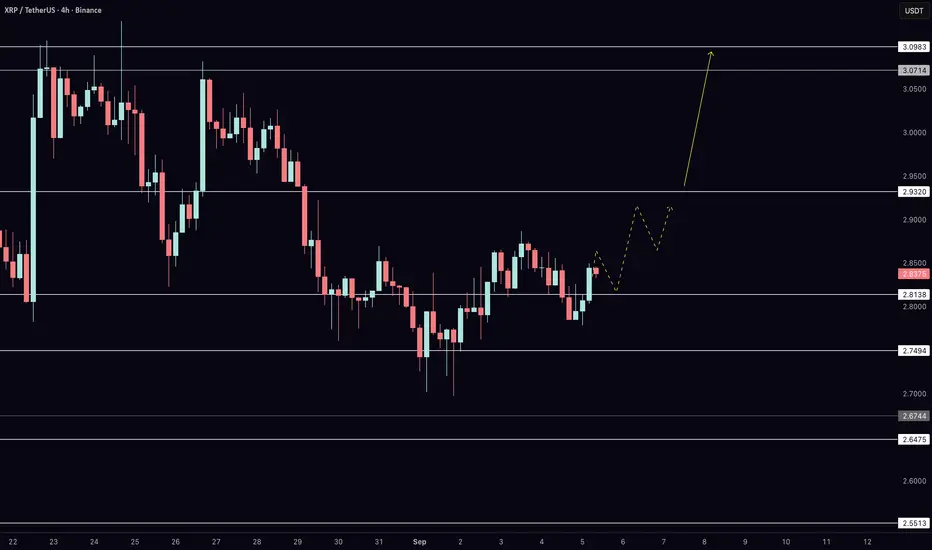
Weekly trading plan for XRPAt the moment, a bullish divergence is visible on the chart due to the recent quick update of the local low.
As long as the previous high isn’t broken, the price may continue its downward movement. However, if the 2.83 level breaks, I expect growth into the 2.99–3.07 range. It’s also important to watch the price action around 2.87 , as we could see a pullback from that level.

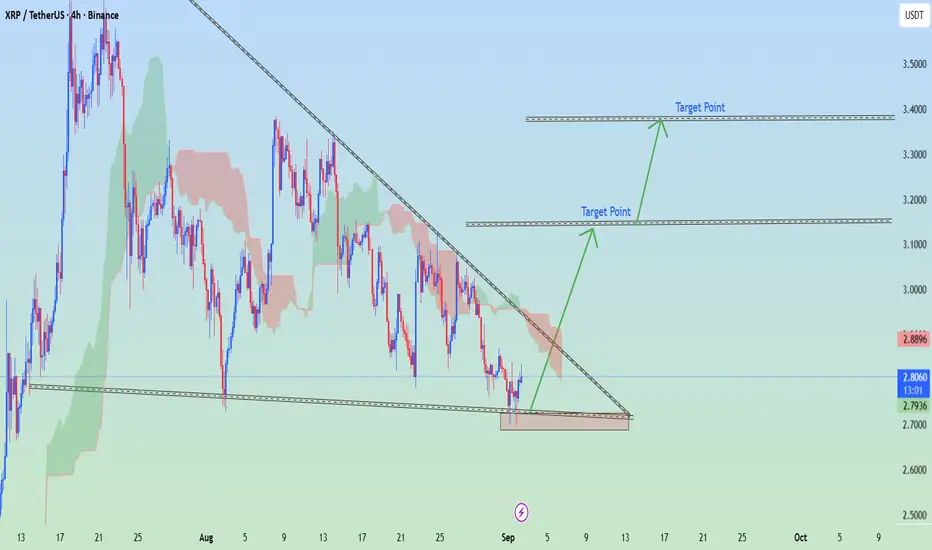
XRP/USDT on Binance (4H timeframe)XRP/USDT on Binance (4H timeframe). I drawn an ascending trendline with breakout projection arrows and labeled “Target Point”.
📌 Based on My chart setup:
Current price: around 2.28 USDT
First Target Point: ~ 3.00 USDT
Second Target Point: ~ 3.40 USDT
⚠ Key Notes:
These levels match the breakout projection my drawn.
As long as XRP stays above the rising trendline (~2.20–2.25 support zone), the bullish breakout targets remain valid.
If it breaks down below the trendline, the setup weakens and downside risk increases.