Xrp has great potential this is only the beg
Primary TP $2.3700Aligns with a major structural resistance below the 0.618 Fibonacci level on the Daily chart.
The recommended immediate protection to avoid liquidation.
SL. 2.02
Trade ideas

XRPUSDT – Up?Alright traders, the weekend ended with manipulation at its absolute finest —
pure crypto art.
But the good news?
It finally looks like the market chose a direction for the upcoming days…
and that direction might actually be UP.
(Yes, I’m shocked too.)
So here we are with another XRP trade on the table —
hopefully a winning one this time,
because XRP owes us at least one normal move this month. 😅
Nothing much to add today:
no major macro, no surprises, no chaos scheduled (yet).
Which usually means the market has room to push upward a bit.
Let’s see if XRP behaves or decides to troll us again.
Trade safe, legends! 🚀📈

XRP/USDT and ICT : Accumulation and Liquidity EngineeringHere is an objective summary of the price action for December 7, 2025, on XRP/USDT, based exclusively on institutional analysis (ICT).
1. Context: Accumulation and Liquidity Engineering
During the first part of the day, price evolved within a consolidation profile. This phase allowed for "Liquidity Engineering," building up stop orders below relative lows (Sell Side Liquidity) and above relative highs (Buy Side Liquidity).
2. The Manipulation (Judas Swing / SSL Raid)
Mid-afternoon volatility kicked in:
SSL Sweep: The market violently took out the 2.00 psychological support and the previous Major Swing Low (1.9950).
Turtle Soup: This run below the low failed to induce bearish continuation. Instead, it served to trigger early buyers' Stop Losses and trap breakout traders.
Reaction: Price reacted instantly, leaving a long lower wick, indicating heavy absorption of sell orders by smart money (Accumulation).
3. Expansion and Displacement
Following the liquidity grab, a bullish impulse move triggered, characterized by strong Displacement:
The up-close candles were large with little to no retracement, signaling clear institutional sponsorship.
Invalidation of Supply: Price sliced through the bearish OTE (Optimal Trade Entry) of the previous dealing range with zero rejection. This indicates the Bears have lost control.
4. Market Structure Shift (MSS)
The candle closes (specifically on the H1 timeframe) validated a trend reversal:
BOS/MSS: By closing above significant recent highs (notably 2.0723), the market confirmed a bullish Market Structure Shift.
Targeting Buy Side Liquidity (BSL): Price was drawn as a magnet toward the External Range Liquidity sitting above the previous range highs.
Technical Conclusion
The day can be summarized by a classic ICT "Purge & Revert" cycle:
Sweep of internal and external liquidity (below 1.9950).
Range reintegration.
Expansion toward external liquidity (above 2.0723).
The Daily Bias has flipped from neutral/bearish to bullish following the strong H1 close, suggesting the current "Draw on Liquidity" is the next major pool around the 2.10 level.

Will XRP Price Fall to $2 Again or Will This Explosion Save It?XRP is trading at $2.06 after two failed attempts to break the $2.20 resistance this week. The altcoin is now drifting toward the familiar $2.02 support level, which previously acted as a strong rebound point.
If XRP sees renewed investor confidence and a bounce from $2.02, the price could climb back to $2.20. A successful breakout above this resistance may open the door to $2.26, supported by the potential volatility surge indicated by the squeeze.
However, a breakdown remains a risk. Losing the $2.02 support would place $2.00 in immediate danger. A fall below that threshold could push XRP toward $1.94 or even $1.85, invalidating the bullish outlook and signaling deeper correction potential.

XRPUSDTENTRY:2.0623_2.0422
SL: 2.0072
TP:2.2256
**Please observe capital management. There is no responsibility for your profits or losses.**

Next Volatility Period: Around December 23rd
Hello? Hello, traders.
If you "Follow" us, you'll always get the latest information quickly.
Have a great day.
-------------------------------------
(XRPUSDT 1D Chart)
I believe the expected uptrend will continue when the price rises above 2.4810-2.6013.
Therefore, the final buy zone is the 2.4810-2.6013 zone.
If the price falls below the 1.5-19669 zone, a long-term downtrend should be considered.
Therefore, if support is found around the 1.5-19669 zone, it would be a good time to buy from a long-term perspective.
As it's difficult to determine the support level on a 1D chart alone, the StochRSI 80 and 20 indicators on the 1M chart are marked.
Therefore, the 1.8209-1.9575 range should be considered the support level for a continued uptrend.
If the price rises above the OBV High indicator and holds, further upside is likely.
However, it must break above the M-Signal indicator on the 1W chart.
-
Thank you for reading.
We wish you successful trading.
--------------------------------------------------

XRP USDT - HARMONIC GARTLEYI am observing Harmonic Gartley for XRP USDT on a weekly chart.
If it crosses death valley, it seems possible to reach 2 USDT by mid-October.
Of course, this is not investment advice , it is my personal analysis.
Good luck.

XRP Breakdown Risk: Triangle + Resistance = DropXRP( BINANCE:XRPUSDT ) is moving within a resistance zone($2.32-$2.19) and has shown notable reactions to the resistance line and the Potential Reversal Zone(PRZ) .
From a technical analysis perspective, it seems that XRP has formed a Symmetrical Triangle Pattern. If the lower line of this pattern is broken, it would align with our analysis.
Additionally, from an Elliott Wave theory standpoint, we expect the next corrective wave for XRP, and a break of that lower triangle line would confirm this expectation.
I expect that in the upcoming hours, XRP will begin a downward trend and test the support zone($2.16-$2.11). If it breaks through that support, we can expect further declines toward the next support zone($2.04-$2.00) and Cumulative Long Liquidation Leverage($2.04-$2.02).
First Target: $2.133
Second Target: $2.069
Third Target: $2.043
Stop Loss(SL): $2.330
Cumulative Short Liquidation Leverage: $2.30-$2.25
Cumulative Long Liquidation Leverage: $2.16-$2.13
💡 Please respect each other's opinions and express agreement or disagreement politely.
📌 XRP Analyze (XRPUSDT), 1-hour time frame.
🛑 Always set a Stop Loss(SL) for every position you open.
✅ This is just my idea; I’d love to see your thoughts too!
🔥 If you find it helpful, please BOOST this post and share it with your friends.


XRP 4H – Trendline Test, But Is Liquidity Next?XRP is testing a clean descending trendline that has been rejecting price since early November. Today’s move taps that same trendline while also running directly into the 50 EMA and 100 EMA — creating a tight confluence zone that historically produces strong reactions. Price is also sitting inside the 0.5–0.618 Fibonacci band, with the 0.786 level acting as the upper cap of the current retracement.
Below, the $1.8476 level remains a clear liquidity target from the November sweep, and the Stoch RSI is already stretched into overbought territory. Bulls need a decisive breakout and retest above the trendline to invalidate the downside liquidity draw. Bears are watching for another clean rejection into a move toward the purple liquidity line.
Expect volatility as XRP decides between breakout continuation or a liquidity-seeking reversal.

XRP Long from here? or not ?I'm planning to Long Altcoins here for short term & my target about Up 20% from here then Quit the Market for a month. Lets see whats happening !

XRP – Up? Maybe Asia Sends It!Can XRP pump during the Asia session?
Absolutely possible. Why not?
The whole crypto market still has some upside juice left in the tank,
momentum is there, sentiment is improving,
and XRP loves to be dramatic at the weirdest hours anyway. 😅
If the market keeps pushing up,
XRP can easily become one of the early movers —
leading the charge while everyone else is still waking up.
Nothing guaranteed (because… XRP),
but the setup looks good and the timing is perfect.
👉 Manage your risk
👉 Don’t FOMO
👉 And let Asia do its magic 😎🚀

XRP - Bullish Wedge XRP continues to form a bullish wedge at key support $2. This has a high probability of a breakout to the upside in the coming weeks.

Forecast for XRPUSDT 30th November 2025 (Updated)Decline to ~$2.10
Pump to ~$2.45
Hardcore Dump to ~$1.50
Pump to at least ~$3.60

XRPXRP – Technical Analysis Based on Market Behavior
In this analysis, the projected price pattern for XRP is drawn purely based on the market’s past behavior. The waves shown on the chart are not Elliott Waves; they are simply visual patterns inspired by how XRP has moved in previous market cycles.
The purpose of this chart is to illustrate that XRP often enters a complex consolidation phase after deep corrections, and eventually prepares for a stronger upward move.
Based on the repeated structures observed in the past, this pattern suggests the possibility of a significant bullish move if the market follows a similar path again.
This analysis reflects personal interpretation of historical price action and is not financial advice.
sajjad khoshbakht – XRP

#XRP Retest ? XRP has reached the green zone where we could see another reaction.
If the price holds strong around this area, I believe an upward move could begin.

XRP RoadMap (1D)Let's take a look at Ripple to see what fluctuations it may experience over the next month or two.
We considered the upward move in 2024 as Wave A, the following correction as Wave B, and the third rise as a terminal 5-wave structure.
The sharp downward move is considered a post-pattern terminal, and now the waves we are in are regarded as a bearish cycle, forming an expanding/diametric/symmetrical triangle.
Whatever the larger pattern is, in aggregation it seems that the price will move downward from the red zone to the short-term targets marked on the chart.
The targets are marked on the chart.
A daily candle closing above the invalidation level will invalidate this analysis
For risk management, please don't forget stop loss and capital management
When we reach the first target, save some profit and then change the stop to entry
Comment if you have any questions
Thank You

Technical Assessment of the XRP/USDT 30-min Chart (as shown)1. Market Structure
• Price has broken sharply downward from a multi-day consolidation range.
• This drop occurred directly into a green S/R zone that previously acted as demand.
• The most recent candles show a strong impulsive sell-off with little retracement, suggesting momentum remains with sellers.
2. Key Levels (From What I Can See)
• Immediate Support Zone: The highlighted green box between approximately 2.05–2.07 (visible on your chart) is being tested.
• Next Lower Supports:
• Around 2.03–2.04 (minor diagonal + previous wick area).
• Around 2.00–2.01 (lower green trendline intersection).
• Overhead Resistance:
• Cluster of descending red trendlines above the breakdown zone (around 2.10–2.12).
• The breakdown origin near 2.13–2.14 is now a potential strong resistance.
3. Trendline Dynamics
• Red Descending Trendlines: These appear to define a broader downtrend channel. Price rejected off the midline and accelerated downward.
• Green Ascending Trendlines: These are acting as structural support. Price is currently touching or very near the first green support line.
This setup resembles a bearish compression where downward pressure meets weakening upward trendline support.
4. Current Price Behavior
• The reaction wick into the S/R zone suggests some initial buying interest, but there is no meaningful bullish structure yet on the 30-min.
• The drop is steep and impulsive, not a grind—usually a sign that sellers remain committed unless a strong reversal pattern prints.
5. What to Watch Next
Bullish Reversal Criteria (if you’re looking for long confirmations):
• A bullish engulfing or strong reclaim of the 2.07+ zone.
• Break and hold above the closest red descending trendline.
• Higher low formation above the S/R zone.
Bearish Continuation Criteria:
• A 30-min or 1-hr close below the green S/R zone.
• Failure to reclaim the underside of the support.
• Continuation rejections against any of the red trendlines.
If continuation occurs, price could trend toward the next green trendline, which appears near the 2.01–2.02 region.
6. Risk Context
• Volatility is elevated on the breakdown candle.
• Liquidity likely sits below the green zone; a sweep and reclaim would be the strongest bullish signal in the current context.

why? 90% of traders buy high and sell low?Have you ever entered a trade right when everyone said it is going to the moon
Have you ever sold right before price exploded upward again
This guide is here to break that painful cycle once and for all
Hello✌️
Spend 3 minutes ⏰ reading this educational material.
🎯 Analytical Insight on xrp:
I expect a much bigger rise for Ripple than what I have shown on the chart. But we should remember that every year when the New Year approaches the market usually goes bearish. We need to wait and pass through that period to see what the final result will be.
Now , let's dive into the educational section,
🧠 Trader Psychology
When price pumps fast the brain fears missing profit
This fear forces rushed entries without any plan
During drops the brain wants to escape immediately
Emotions repeat the same losing behavior again and again
As long as emotions decide the market always wins
📉 Market Emotion Cycle
Hope and excitement start the first entries
Greed grows at the top and everyone buys with confidence
Fear suddenly appears and price collapses fast
Panic creates the worst possible exit timing
Professionals buy while panic controls the crowd
🎯 Why We Buy Tops And Sell Bottoms
We search for confirmation from the majority
The majority is usually late and wrong in timing
Crowded zones have the highest probability of traps
After attracting buyers price normally corrects downward
In the bottom panic sellers accelerate the drop
📌 Proper Entry Plan
Entries must happen in logical discounted areas
Follow the trend instead of fighting it blindly
A trade without risk reward logic is a bad trade
A clear plan neutralizes heat of the moment emotions
🛡 Real Risk Management
Stop loss must exist before entering a position
Small risk keeps the trader alive long term
Clear targets prevent emotional exits without purpose
Without stop loss the market owns your account
📊 TradingView Tools
Volume Profile shows where big money entered strongly
Auto Fib Retracement marks logical pullback zones
Fear and Greed Index shows collective emotional pressure
Horizontal levels identify probable price reaction zones
Combining these tools creates emotion free trading decisions
🏆 Professional Behavior
They never enter trades during emotional hype
They journal every decision for performance growth
They know the market always gives another chance
Mind control matters more than predicting every move
main point
Replace hype and the herd with logic and structure and the cycle of buying tops and selling bottoms ends here. Survival and profits come from mental discipline not guessing the future. Control emotions and you step into professional trading.
golden recommendations
Wait for pullbacks instead of chasing fast moving candles
When everyone feels extremely confident danger might be highest
A stop loss costs less than your pride and saves your future
✨ Need a little love!
We pour love into every post your support keeps us inspired! 💛 Don’t be shy, we’d love to hear from you on comments. Big thanks , Mad Whale 🐋
📜Please make sure to do your own research before investing, and review the disclaimer provided at the end of each post.

Ripple (XRP): Seeing Similar Setup To Form Near EMAs | BearishXRP is forming a similar setup to what we’ve seen on a few other charts — price keeps rejecting from the EMAs and struggling to gain any bullish momentum. As long as we stay under these levels, sellers keep control.
What we’re waiting for is a proper breakdown from this small consolidation. If that happens, the downside play becomes very clear. Until then, we stay patient and let the structure show us the direction.
Swallow Academy

XRP – Reversal Loading at the Demand Floor ?XRP is approaching a critical point within its descending channel, where price has tested the demand floor multiple times and continues to hold above the structural low marked with the red X. This area has acted as a major liquidity pocket, and the market is showing early signs of absorption rather than continuation to the downside.
The overall structure still respects the descending channel, but the reaction from the lower boundary suggests that sellers are weakening while buyers are gradually stepping in. This type of behaviour often precedes a mid-term trend reversal, especially when the market begins to form higher lows inside the same range.
A breakout above the internal trendline would shift momentum upward and open the door for a larger continuation move into the upper supply block. As long as price holds above the current structural low, the bullish scenario remains active.
Key Technical Notes:
• Strong demand response near the channel’s lower boundary
• Price defending the final structural low (red X)
• Potential bullish divergence forming as momentum begins to stabilise
• Break above the inner descending trendline can trigger acceleration
Simple Interpretation:
XRP is bouncing from major demand and trying to regain momentum. A breakout above the internal resistance trendline could confirm the start of a larger reversal wave.
Invalidation:
A clean breakdown below the red X level would invalidate the bullish scenario and open the way toward deeper support zones.

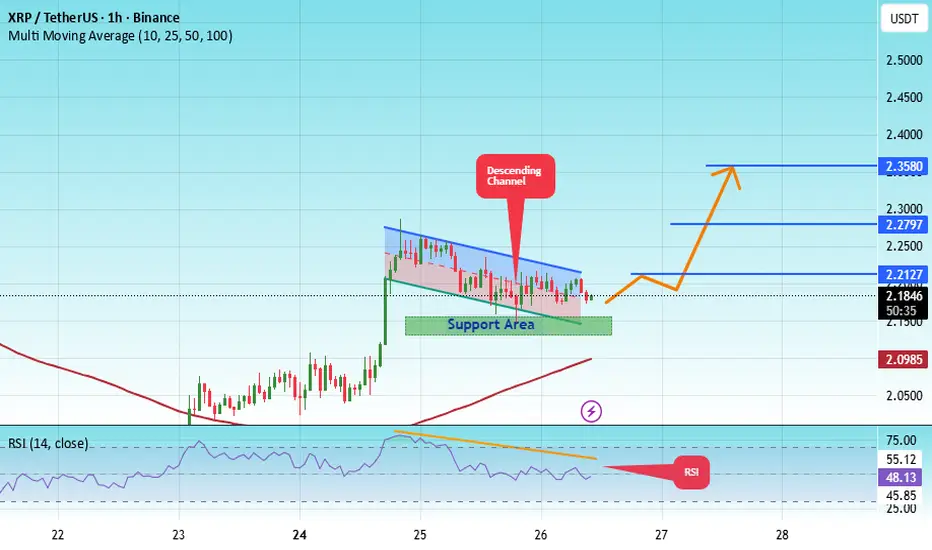
#XRP/USDT XRP (1h) (spot)#XRP
The price is moving within an ascending channel on the 1-hour timeframe and is holding well. It is poised to break out strongly and retest the channel.
We have a downtrend line on the RSI indicator that is about to break and retest, which supports the upward move.
There is a key support zone in green at the price of 2.14, representing a strong support point.
We have a trend to stabilize above the 100-period moving average.
Entry price: 2.18
First target: 2.21
Second target: 2.28
Third target: 2.35
Don't forget a simple money management rule:
Place your stop-loss order below the green support zone.
Once you reach the first target, save some money and then change your stop-loss order to an entry order.
For any questions, please leave a comment.
Thank you.
XRP/USD LONG SET UP TRADETitle: XRP/USD (RIPPLE) BUY
Asset: Crypto
Symbol: XRP/USD
Market Entry Price 1: $2.19
Stop Loss: $2.14
Take Profit 1: $2.24
Take Profit 2: $2.28 (close 25 %)
Take Profit 3: $2.34 (close 50%)
Take profit 4: $2.45
Status: ACTIVE
