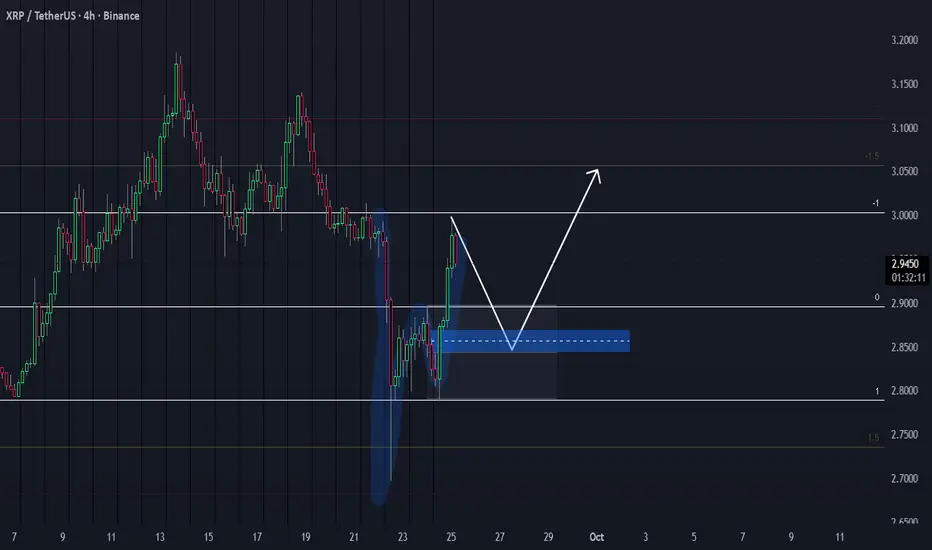
XRP Triple Bottom: Key Breakout at 2.92On the XRP chart, a triple bottom formation has appeared. At the moment, the price is attempting to rise but has already reacted from a key moving average and remains below the weekly pivot point at 2.85 .
I expect a reversal from the 2.78 – 2.81 area, but a break of 2.76 without a quick recovery would worsen the overall picture for XRP. A move below 2.69 could send the price toward the first target at 2.55 , followed by a reaction from 2.47 .
A breakout above 2.92 would invalidate the large descending triangle scenario, with the next upside target at 3.03 .
Trade ideas

Forecast for XRPUSDT 30th September 2026 (Updated)Macro forecasting XRP to ~$2.9 followed by a short sell to ~$2.5 then a large move to ~$3.1 then a huge move to the downside to ~$2.25-$2.3 then to the heavens for Q4


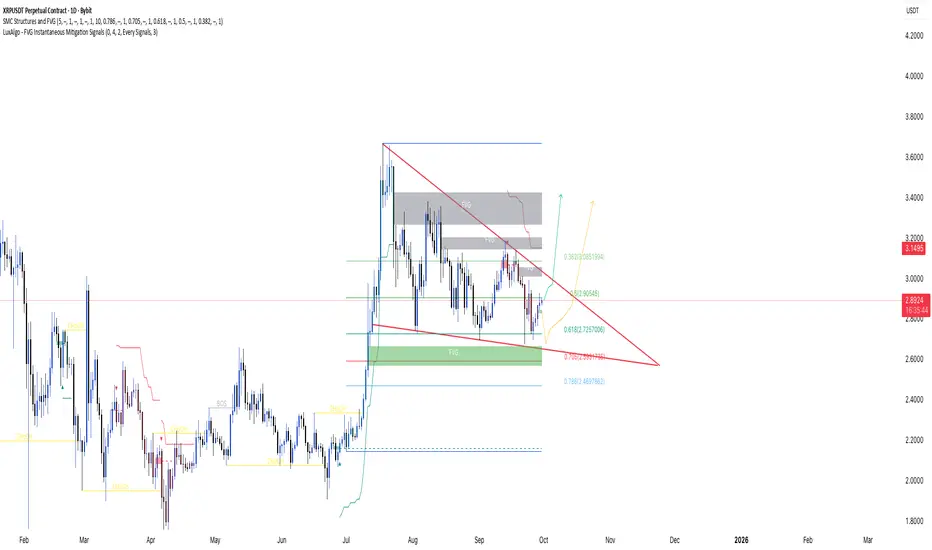
XRPUSDT 1D falling wedge coiling for breakoutPrice is compressing inside a falling wedge with demand below 2.72. A clean daily close above 2.98 opens 3.05 then 3.15.
Trend is corrective after the July impulse, printing lower highs inside a falling wedge. Internal structure is bearish-to-neutral, but compression suggests energy building for a break. Price sits mid range near the 0.5 retracement, with external liquidity resting above 3.05 to 3.15 and equal lows below 2.55 to 2.47. A daily break and hold above the wedge top would mark a change of character back to bullish; a sweep into the lower green box keeps the larger uptrend corrective.
Levels
Wedge resistance: 2.98
FVG supply ceiling: 3.15
0.5 retracement: 2.905
0.618 retracement: 2.726
Liquidity below swing lows: 2.470
Plan A
Trigger and confirmation
Wait for a daily close above 2.98 and the wedge trendline. Look for a retest that holds as a bullish order block or a higher low on 4H.
Invalidation level
A daily close back inside the wedge or below 2.86.
Targets: TP1, TP2, runner
TP1 3.05, TP2 3.15, runner 3.35 toward prior range high.
What would invalidate the idea
Failure to hold the breakout retest and sustained acceptance back under 2.90.
Plan B
If price sweeps the downside first, watch 2.72 to 2.60. Trigger on a sweep and reclaim of 2.70 with a 4H change of character.
Invalidation and targets
Invalidation on a daily close below 2.47. Targets 2.90, 3.05, 3.15.
Confluence
EMAs 20 and 50 are flattening while the 200 remains upsloping, consistent with a corrective pause. RSI is holding near 50 with mild bullish divergence versus the September swing low. Volume has compressed during the wedge, so expansion after a break should confirm. Volume profile favors 2.90 as a local point of control, with value area low near 2.70 aligning with the 0.618. Fib context places current price near the 50 level, with discount bids in the 62 to 79 zone.
Risk
Define risk at invalidation, not by feel. Size positions so a full stop hit is tolerable. Wait for confirmation instead of chasing the first spike.
Disclaimer
Educational content only and not financial advice
Forecast for XRPUSDT 30th September 2026 For the next week forecasting XRP to ~$2.9 followed by a short sell to ~$2.7 then a large move to ~$3.1 then a huge move to the downside.

XRP Shorting IDEA - Scalp-intradayJournal Entry #12.
Looking for scalp-intraday short here
Indicators showing a bearish movement.
Forecast for XRPUSDT 29th September 2026Expectation of a minimum 10%+ Move to the Upside for XRP. Explosive move suggested by BBWP Indicator. XRP often moves with relatively increased velocity and magnitude compared to other large cap altcoins, so whilst a minimum 10% move is expected, it may likely move even more.

XRP - 1D Elliott Wave Analysis - 28.09.25Welcome
We assume that the low on the 7th of April formed the green Wave 4 and we are since then working on the green Wave 5 which is the last Wave to the upside of this bullmarket for XPR.
We have already formed the blue Wave 1, 2 and most likely 3 of the green Wave 5 and we are working on the blue Wave 4. The green Wave 5 appears to be an ending diagonal.
We are still working on the blue Wave 4 which currently we count as an WXY in red of which we finished Wave W and X and are working on Y. Wave Y would unfold as ABC. The Wave 4 support area lies between the 0.5 FIB at 2.6350 USD and the 0.786 FIB at 2.1909 USD. The next targets to the downside for Y are the 2.5160 USD and the 2.3728 USD price level depending on the count and measurement. The 2.4161 USD price level is also interesting as it is the point of control of the previous price action which could function as additional support as well as the white trendline that we have going through the support area.
Thanks for reading.
NO FINANCIAL ADVICE.

Monthly Crypto Analysis: Ripple (XRPUSD) – Issue 95 The analyst believes that the price of Ripple will decrease within the time specified on the countdown timer. This prediction is based on a quantitative analysis of the price trend.
___Please note that the specified take-profit level does not imply a prediction that the price will reach that point. In this framework of analysis and trading, unlike the stop-loss, which is mandatory, setting a take-profit level is optional. Whether the price reaches the take-profit level or not is of no significance, as the results are calculated based on the start and end times. The take-profit level merely indicates the potential maximum price fluctuation within that time frame.
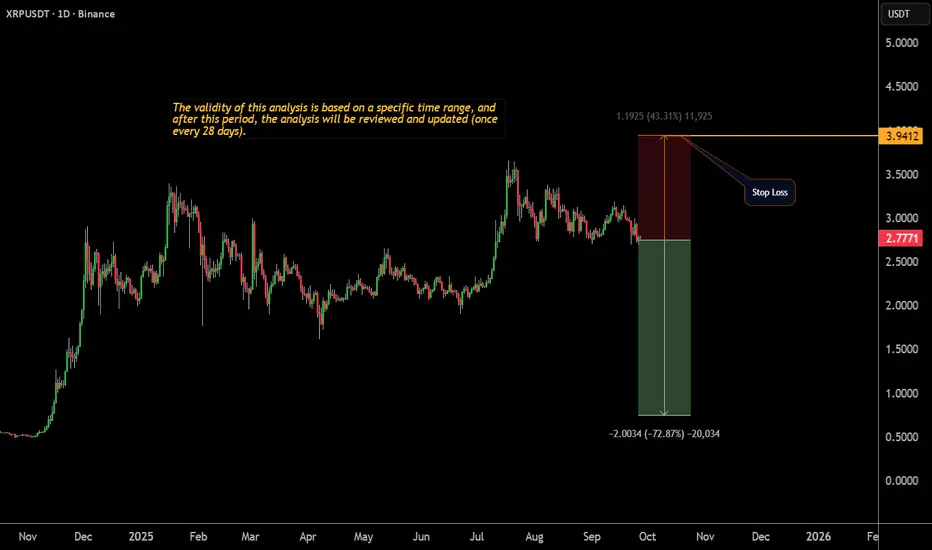
XRPUSD_1DRipple Analysis Medium and Long Term Time Elliott Wave Analysis Style The market is in an uptrend that is in a range in the medium term. Only if the price maintains above 2.7272 can it continue to rise after the range and move towards 4.0000.

EUR USD AUD NVDA MSFT AVGO S&P500 BTC XRP Weekly InsightsIn this video, we dive into the key market movements and outlooks for major financial instruments over the past week. Highlights include:
Analysis of currency pairs: EUR/USD and AUD
Trends and technical setups for leading tech stocks: NVDA, MSFT, AAPL, AVGO
The S&P 500’s performance and what it suggests about broader market direction
Developments in cryptocurrency, with a focus on BTC and XRP
Whether you’re a trader, investor, or just interested in macro markets, this video gives you a consolidated, data-driven snapshot of where things stand and what to watch next.

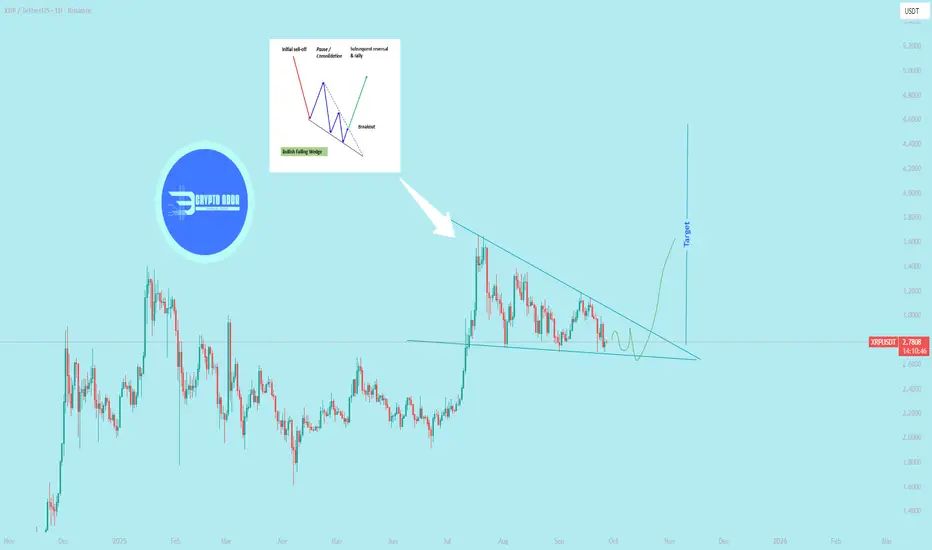
$XRP Performing falling wedge pattern in 1D
> Falling wedge as a reversal vs. continuation pattern
`As a reversal pattern`
`Location:` Occurs at the end of a prolonged downtrend.
Signal: The narrowing price action and declining volume suggest that sellers are exhausting their momentum. The pattern is completed when the price breaks above the upper resistance line, signaling a potential bullish reversal.
`As a continuation pattern`
`Location: `Appears after a strong uptrend.
Signal: The falling wedge acts as a temporary consolidation or pause in the current trend. The price then breaks out to the upside, continuing the original uptrend. @everyone
XRP | Bullish DivergenceXRP is currently trading at $2.78, with a 0.84% increase in the last 24 hours. The bullish divergence on the hourly time frame suggests that XRP's price might be poised for a potential reversal or upward movement.
*Approach to Resistance*: With the 1:1.5 and 1:2 approaches, you're likely referring to potential resistance levels. If XRP's price reaches these levels, it may face selling pressure, which could impact its upward movement.

XRP Intraday long IdeaJournal Entry #8
The chart has shown a bullish divergence and currently at its breakup/down point.
im looking for opportunities to long :)
hello UPtober?

BUY AND HOLDHello friends
You see that after the good rise we had, the price has entered a correction and it is a good opportunity to buy in a stepwise manner in the price correction with capital and risk management and move with it to the specified goals.
Ripple is a currency whose holders have a good expertise in disappointing short-term traders.
Note that the holding period is at least 3 months, so be patient and observe capital management.
*Trade safely with us*

XRP USDT Hello my friend, Ripple is currently in a triangle and is currently in a very good support area, especially since it has now reached a very good pivot at 2.7. I predict that Ripple will reach a buy price of 4.4. Thank you for reading my analysis and giving your opinion.

XRPUSDT, Ripple Bearish Short ScenarioPrice Action & Structure
• The chart clearly shows lower highs and lower lows, a classic downtrend structure.
• After the sharp sell-off around the 21st, XRP attempted a small rebound, but it stalled near the $2.99 – $3.00 resistance zone, aligning with the Fibonacci 0.5 retracement and pivot level.
• Since then, price has rejected again and is consolidating near $2.72, which is sitting close to the Fibonacci 1.618 extension. This suggests continuation pressure from sellers.
________________________________________
Fibonacci Levels & Resistance Zones
• $2.88 – $2.99 (Fib 0.382–0.5 + Pivot cluster): Heavy resistance. Sellers defended this zone aggressively, proving that bulls are weak at higher levels.
• $3.09 (Fib 0.618 + R2): Next resistance above, but price failed to even test it, further validating bearish strength.
• $2.62 (Fib support zone): First potential bearish target, as price seems to be heading in that direction.
• $2.57 – $2.50: Deeper extension support if breakdown accelerates.
________________________________________
Volume & Momentum
• The heavy red candles around the 21st–22nd show that sellers had much stronger momentum than buyers.
• Recent green candles are smaller in size and lack follow-through, which usually signals weak buying attempts in a bearish market.
• Momentum remains tilted toward the downside as long as XRP stays under $2.88–$2.99.
________________________________________
📌 Trade Setup (Bearish Bias)
• Entry: $2.72 (current levels or on a pullback to $2.85 resistance)
• Stop-Loss: $3.00 (above Fib 0.5 and pivot cluster)
• Take-Profit 1: $2.62 (Fib support)
• Take-Profit 2: $2.50 (extended bearish target)
• Risk/Reward: Approx. 1:2.
________________________________________
✅ Justification for Bearish Bias:
The trend structure is clearly bearish (lower highs/lows), XRP is failing to reclaim strong resistance zones ($2.88–$3.00), and Fibonacci + pivot confluence points confirm sellers are in control. Unless bulls break and sustain above $3.00, downside remains the path of least resistance.
________________________________________

XRPUSDT 1D#XRP is moving inside a descending triangle pattern on the daily chart — a classic pattern that usually has a bearish breakout. However, it’s currently attempting to rebound from the support zone. We need to see if it can hold the support zone or not.
For the bullish scenario, it must break above the daily SMA100 and the triangle resistance. In this case, the potential targets are:
🎯 $3.0262
🎯 $3.1277
🎯 $3.2292
🎯 $3.3738
🎯 $3.5579
On the other hand, if it breaks the triangle to the downside, you can place some buy orders around the following levels:
💰 $2.6026
💰 $2.4925
💰 $2.3452
⚠️ Always remember to use a tight stop-loss and follow proper risk management.

XRPUSDT XRP is in a corrective phase inside a downtrend channel after a sharp rally in July.
If XRP holds above 2.70 USDT and bounces, it may retest 3.0–3.2 USDT (channel midline).
If it breaks below 2.70 USDT, the next major support is near 1.95 USDT (strong demand zone).
RSI doesn’t show extreme conditions yet, so price could still drift lower before buyers step in.

$XRP Mild Bearish (September 25, 2025)BINANCE:XRPUSDT
CRYPTOCAP:XRP Mild Bearish Bias with Neutral RSI Hinting at Rebound Potential
Current Chart Analysis:
Overall Price Trend: XRP has declined from highs around 3.0 USDT earlier in the period, now at about 2.82-2.85 USDT (per chart labels). Recent candlesticks show a mix of red (bearish) with some green relief, suggesting easing selling pressure but overall downward bias. This aligns with a ~3.5% 24-hour uptick from broader data.
Ichimoku Cloud:Price is near or slightly below the cloud, a mild bearish signal indicating dominant downtrend, though the cloud is thickening slightly greenish (positive).
Tenkan-sen (red) below Kijun-sen (blue) in a bearish cross, but Chikou Span (lagging line) approaching from below offers hope for reversal. Cloud acts as resistance around 2.90.
RSI (Relative Strength Index): At 37.97 in the bottom panel—neutral, edging toward oversold (below 30). This implies slowing sells and potential short bounce, but no clear bullish divergence yet.
Volume and Momentum: High volume on red candles confirms selling, but trend lines (like green) are stabilizing. Price testing support near 2.80.
Analysis Summary: The chart leans Mildly Bearish overall, with downward momentum, but neutral RSI and recent recovery add room for temporary relief.
Here are the possible scenarios:
Base Scenario (Bearish, 60% probability): Price could test lower levels around 2.75-2.80 USDT if selling resumes (especially if cloud holds as resistance). This without a positive Ichimoku cross or strong green candle.
Alternative Scenario (Mild Bullish, 40% probability): A bounce to 2.90-2.95 USDT, if RSI rises above 50 and price breaks Kijun-sen. This would be short-lived, not altering the bigger bearish picture.
Monitor key levels: Support at 2.80, resistance at 2.90.

I was right about Xrp better to long now Strong rejection occurred alongside grabbing the sell side liquidity. Oversold in rsi indicating a strong reversal

XRP ETF Approved, But Price Hurts—Will Big Players Act?At the time of writing, XRP trades at $2.84, just under the $2.85 resistance. A flip of this barrier into support would likely signal the beginning of a reversal, strengthening bullish sentiment. Traders are closely watching this zone for confirmation.
If support from LTHs holds, XRP could climb toward $2.94 in the short term. Breaching this level would pave the way for a further rise to $3.02, signaling broader recovery potential and invalidating near-term bearish concerns.
However, if market conditions worsen or LTHs shift their strategy to selling, XRP could lose momentum. The altcoin risks sliding toward $2.75 or even deeper to $2.64, putting bullish expectations in jeopardy and prolonging the consolidation phase.

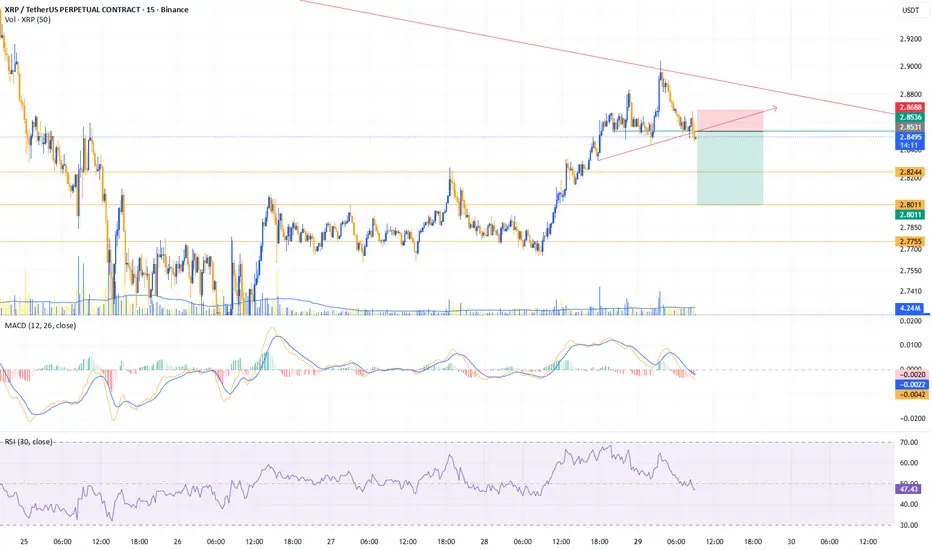
XRP 4H Flash Model, long setupFlash Model, long setup.
Price swept liquidity + broke structure. Now it’s retracing into demand.
The play is simple: If there’s a clear imbalance, target the imbalance.
Invalidation = break under demand.
All the best