Long trade Trade Journal Entry
Pair: XYOUSD
Direction: Buyside trade idea
Date: Fri 3rd Oct 2025
Time: 5.30 pm
Session: London to New York Session PM
Timeframe: 30 Min
Trade Details
Entry: 0.00947
Profit Level (TP): 0.01000 (+5.60%)
Stop Level (SL): 0.00941 (−0.63%)
Risk-Reward (RR): 8.83
Narrative
The marke
Trading activity
Transactions 104
BuysSells
5945
Volume 673USD
Buys volumeSells volume
387286
Traders 26
BuyersSellers
1313
About XYOSOL_2SMBNU.USD
Related DEX pairs

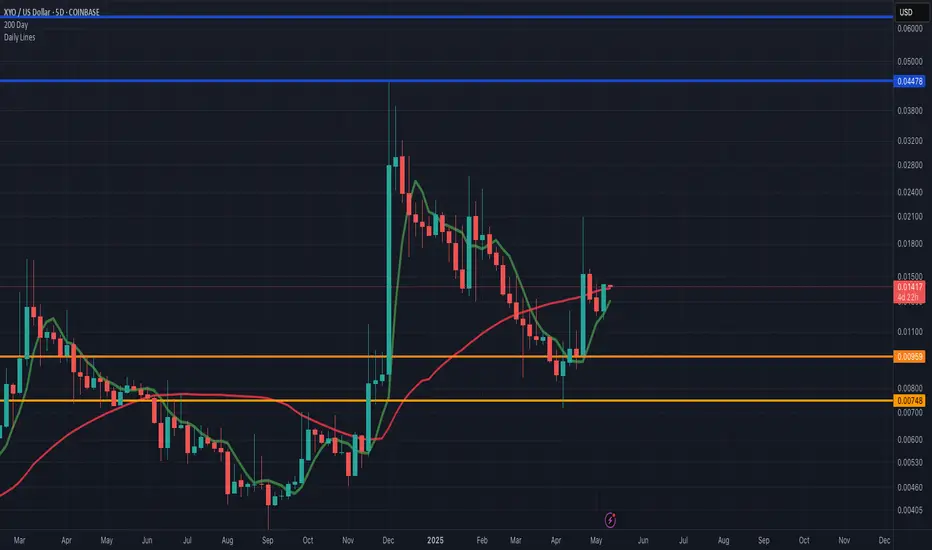
XYO OutlookXYO has so far been holding the 200 day ..using the five day chart for this one month of may looks to be a bullish month.
Geospatial Technology: A Catalyst for Modern InnovationBeyond Earth-based uses, geospatial tools are now integral to advancements in autonomous vehicles, drone technology, and even space exploration. As data becomes increasingly abundant, the ability to tie that data to a physical location adds powerful context that static information cannot provide.
G

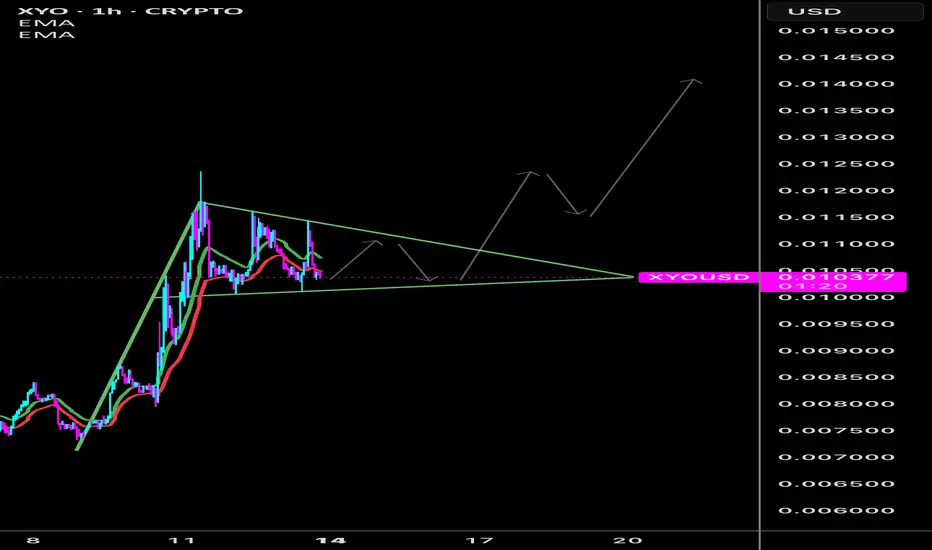
Bull Flag Pattern**XYO Bullish Flag Pattern on 1HR Chart**
**Chart Setup**: XYO/USD on the 1-hour timeframe is carving out a bullish flag pattern, a classic continuation signal for upward momentum. Following a sharp rally (flagpole), price has entered a tight, downward-sloping consolidation channel with lower highs

XYO Coin: Ready to Blast Past 3 Cents XYO is at a crossroads. If it breaks above 2.5 cents, we could see it soar to 3 cents, maybe even 10! But, if it dips under 1.9 cents, watch out for a fall.
Kris/Mindbloome Exchange
Trade Smarter Live Better

xyo (XYO) Looks like XYO is falling underneath this line I drew to represent the first big candle at the end of the year. The lack of sustaining value from XYO holders is more than disappointing. It is like these people have not seen all these other cryptocurrency make money so long as the people don't panic

$XYO Update - New Target of $0.02969 by 1/11Broke out the support zone (green box) and then failed the retest back to $0.032, got close with a bullish spike to $0.02950 then retraced back towards 23.60% Fib level.
We now see an Ascending Curve on the price with a convergence of new retest Take Profit Goal of $0.02969 before Saturday January

My Analysis and Plan for XYO/USD
Alright, let's dive into what I’m seeing on this XYO/USD daily chart. I've had a look, and here’s my perspective on this coin.
Technical Analysis:
Significant Pump and Dump: The most obvious thing on the chart is the large pump and dump that happened in November and early December. I am seeing th

XYO, possible fractal for more upward sugresThis one looks like a possible fractal appearing. The 3 lines denote very clear trend lines, which have been broken twice in previous instances. There are also two boxes that I've highlighted to show two possible fractals. Given the shape of the fractal, it could be on the cards again to play out fo

See all ideas
Summarizing what the indicators are suggesting.
Oscillators
Neutral
SellBuy
Strong sellStrong buy
Strong sellSellNeutralBuyStrong buy
Oscillators
Neutral
SellBuy
Strong sellStrong buy
Strong sellSellNeutralBuyStrong buy
Summary
Neutral
SellBuy
Strong sellStrong buy
Strong sellSellNeutralBuyStrong buy
Summary
Neutral
SellBuy
Strong sellStrong buy
Strong sellSellNeutralBuyStrong buy
Summary
Neutral
SellBuy
Strong sellStrong buy
Strong sellSellNeutralBuyStrong buy
Moving Averages
Neutral
SellBuy
Strong sellStrong buy
Strong sellSellNeutralBuyStrong buy
Moving Averages
Neutral
SellBuy
Strong sellStrong buy
Strong sellSellNeutralBuyStrong buy