Lets get that 3 StartedBigger Wave 2 seems to have been completed and we have just finished wave 2 of 3
Maybe a reason to fasten seat belts :-)
ZECRLUSD trade ideas

1980s vibes radical privacy vaporwave ZCASH TA USDThroughout the western world, new systems have risen up whose job is to constantly record and monitor the present
- and then compare that to the recorded past.
The aim is to discover patterns, coincidences and correlations, and from that, find ways of stopping change.
Keeping things the same.

bTCD short term correction ALTS might rally herewatch video for idea but we could see a cool off on BTCD causing btc and alts to push up

zec/usdactually looks interesting to me. we had a choppy falling wedge but we broke out of it and currently backtest as support... at 164 area. the target of the wedge is the top of the wedge at 194$ but watch that recent rejction area as further potential resiatnce if we do get a push back up here...

Rounded bottom pattern Nice looking move waiting to happen
Rounded bottom. Have a great weekend!
-LarenzoYouDork 💔

ZEC - Horizontal TriangleZEC could either break to the upside or downside.
It continues to sit under the yellow trend line.
RSI is showing bold strong bullish moves against the price action and currently sitting above the 50% level.
UPT:
208
227
DPT:
149
Price action is KING!
More power to all your trades, my friends!
Ron
Intrepid_Trader

Zcash rapid reverse intra-day setuplooks like sellers are getting exhausted. Barry Silbert teasing the idea of another $85,000,000 bid for more Zec
this will turn into a vicious bear trap at some point in the upcoming 5-7 days

The future of Zcash - Shock supply, halo... +60k+Not a financial advice. Just my idea.
Do your own research.
Zcash is the the most underrated coin right now. If you want to follow this idea, just buy spot and wait.
The future will reward you.

Elliot wave count in a correction wave: ZECAfter a classic accumulation phase starting in May and ending late October, ZEC had seen a breakout of nearly 75%.
Reaching a high of $300 on the 25 November, ZEC has transition into a correct wave. ZEC proves to remain very technical in its main support and resistance levels. Equally, it maintains a balanced and easily observable Elliot wave structure. By extrapolating with some key Fibonacci levels we can identity some clear areas of confluence which are observable on the chart provided.
ZEC remains bullish however if key support levels are lost we can see a rotation back into the old range. Particularly it would be important to hold the VAL so that we set up for a nice running flat.

ZEC to $600+! ZEC appears to have completed Elliot Waves 1 & 2 under the 5-Wave Elliot Theory and has begun its ascent in Elliot Wave 3. After using the Trend-Based Fib Extension to calculate potential target prices for Elliot Wave 3 based on Elliot Waves 1 & 2, you can see that ZEC recently wicked at the 0.618 Fib Level ($302.00), and then retraced exactly to the 0.382 Fib Level ($220.00). After retracing to the 0.382 Fib Level, ZEC has just formed a double bottom, which is a bullish reversal indication. Other indicators also look bullish, as the Relative Strength Index (RSI) is only around 40, and yet On Balance Volume (OBV) continues to increase each day. In addition, ZEC's move to Proof of Stake will be a huge catalyst in ZEC's price reaching new highs, as ZEC holders and miners will now be incentivized to hold their ZEC as opposed to liquidating ZEC for other cryptocurrencies.
Within the next 90 days, I expect ZEC to approach the 1.618 Fib Extension Level at $628.00. Once ZEC hits this target, I will make an updated post to predict the next potential targets for ZEC.

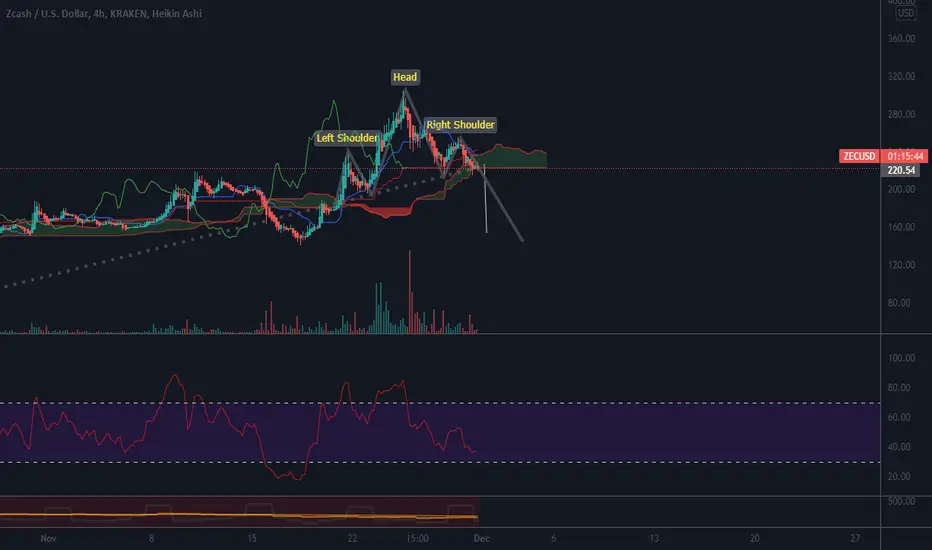
zecclinging on for dear life holding ichuchi daily cloud here but looks like a clear head and shoulders pattern if we do not hold we could see a nasty fall might be a shorting oppertunity here if this doesnt ripp hard
ZEC bounce to 230Howdy all, looking at some bullish divergence here with the RSI. Looks to be sitting at its previous low from two days ago and may be trying to put in a double bottom. Target is 230, stop close at 214.75. Just tryna get in and out quickly, especially on an hourly downtrend.

Moon Shot Odds, Zcash ATH $900 for Christmasits only possible if Bitcoin reverses out of a multi-year bear market.
macro conditions also threaten to instantly invalidate this situation
the big catalyst will be success of Halo Arc upgrade, and the mainstreaming of the value of Zero Knowledge recursive proofing as a mechanism to provide a scalable, privacy by default, work based crypto network

💡Don't miss the great buy opportunity in ZECUSD @ElectricCoinCoTrading suggestion:
". There is a possibility of temporary retracement to the suggested support line (238.09).
. if so, traders can set orders based on Price Action and expect to reach short-term targets."
Technical analysis:
. ZECUSD is in an uptrend, and the continuation of the uptrend is expected.
. The price is above the 21-Day WEMA, which acts as a dynamic support.
. The RSI is at 53.
Take Profits:
TP1= @ 253.92
TP2= @ 266.83
TP3= @ 282.22
TP4= @ 305.09
TP5= @ 330.02
SL= Break below S2
❤️ If you find this helpful and want more FREE forecasts in TradingView
. . . . . Please show your support back,
. . . . . . . . Hit the 👍 LIKE button,
. . . . . . . . . . Drop some feedback below in the comment!
❤️ Your support is very much 🙏 appreciated!❤️
💎 Want us to help you become a better Forex / Crypto trader?
Now, It's your turn!
Be sure to leave a comment; let us know how you see this opportunity and forecast.
Trade well, ❤️
ForecastCity English Support Team ❤️

💡Don't miss the great buy opportunity in ZECUSD @ElectricCoinCoTrading suggestion:
". There is a possibility of temporary retracement to the suggested support line (238.09).
. if so, traders can set orders based on Price Action and expect to reach short-term targets."
Technical analysis:
. ZECUSD is in an uptrend, and the continuation of the uptrend is expected.
. The price is above the 21-Day WEMA, which acts as a dynamic support.
. The RSI is at 53.
Take Profits:
TP1= @ 253.92
TP2= @ 266.83
TP3= @ 282.22
TP4= @ 305.09
TP5= @ 330.02
SL= Break below S2
❤️ If you find this helpful and want more FREE forecasts in TradingView
. . . . . Please show your support back,
. . . . . . . . Hit the 👍 LIKE button,
. . . . . . . . . . Drop some feedback below in the comment!
❤️ Your support is very much 🙏 appreciated! ❤️
💎 Want us to help you become a better Forex / Crypto trader ?
Now, It's your turn !
Be sure to leave a comment; let us know how you see this opportunity and forecast.
Trade well, ❤️
ForecastCity English Support Team ❤️

PROOF OF PURCHASE? Does not appear that the "order" went thru? With the promise of a "big" buy by Greyscale Illustrious leader ZEC skyrocketed by 40%

ZEC, strongerThe following content is machine translation:
This year has been in a state of increasing volume.
From a morphological point of view, it met resistance at Fibonacci 0.786 and retreated.
It is currently in the third wave of rising, and the upper resistance is near 375.
If it meets resistance near 375 and goes down for 4 waves, it steps back and rebounds near Fibonacci 0.786, which may open the 5th wave.
If the overall financial market is stable, the target is around 500

What's next for ZEC?Hello traders! Zcash has had a nice pump since my last idea that was posted on October 22nd. I wanted to update you guys on my ideas and further targets. Like I stated in my previous idea, $300 is still the first major resistance that has yet to be broken (although I believe we would have closed the weekly above it had it not been for the bitcoin dump). After $300, the next multiyear resistance is $380. I expect us to tap $380 dollars followed by a 20% correction to $300 dollars. After $300 resistance turns into support, I think we will begin to go parabolic and my first huge target is $1200. I will personally be exiting at around $1200, although it could reach much higher. This is not financial advice.

Don't count out ZECHello! A lot of traders forgot about zec and laugh whenever I say zec to 1k. The chart is developing pretty nicely, with the daily chart showing a clear double bottom structure (like most alt coins). If zec can close a daily candle above the B wave at about $185, then we can expect a massive impulse.
Not financial advice!


zCash ZECUSD Target reached! Congratulations!Congratulations traders who followed me in this trade! Target has been reached! Beautiful! Now take those profit and enjoy! Cheers!

ZECUSD finally triggers doubles bottom & reaches target.We can see the initial target for the double bottom breakout has been hit. Now the question is whether or not the higher target which is the Inverse Head and Shoulders breakout target will be hit or not. Odds are good it will be, however we may see a retrace first.

ZEC Target reached $250 What next 330?Now that my earlier target has been reached. One need to be cautious and take some profits here to cool down little more or is it attempting for next one at 300
