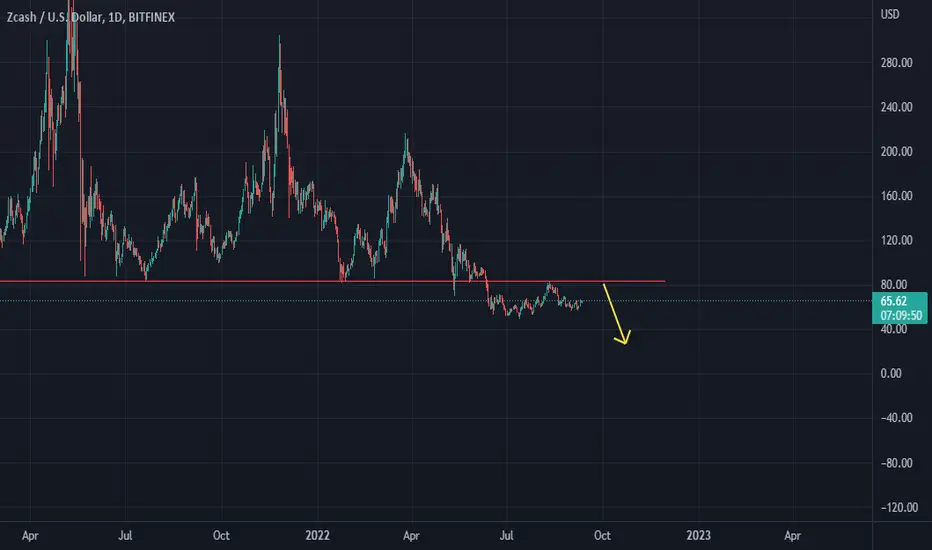
RLinda ! ZECUSD-> A strong coin in a falling marketZECUSD is showing more confidence in the coin amid yesterday's fall of the crypto market and including the fall of bitcoin. ZCash shows strength from the buyers and breaks the resistance of the main bearish trend
I expect a final consolidation above the previously broken border, or a retest of the support of the uptrend channel with further growth continuation. The coin has the potential to rise to 66.2
I expect growth from the area of 44.00-46.00 towards 52 (first target) and then towards 61.5. Medium term target is liquidity zone 66.2
Regards R. Linda!
ZECRLUSD trade ideas

Z-Cash - Channel Reversal ImminentZ-Cash price has touched the lower bound of a price channel defined back in 2021 and is getting ready for a reversal. Based on past performance, I'd say we are headed back to $100 by April 2023. Whether we exit this channel at that time or not isn't yet clear but it sure does look like a 100% gain here is in the cards.


ZEC Moon Chart.Just doodling IDK what I'm doing and this is not financial advice.
I do feel next 6-12 months is sideways chop for Crypto after that I'll be a bulliever. Fingers crossed $1,500 ZEC December 2025 (or near then).

ZECUSD & Head n' Shoulders ZEC has a Botton head and shoulders in progress. Though the volume of the formation does not follow the studies of H&Ss, but only confirmation is when neckline is penetrated with decent volume or decisive price action.

ZEC to 3k in the coming years?Similar gains have been achieved before. This is in line with ZEC/BTC going to 0.1 and above.

My analysis for ZcashThe pair is now trading in an uptrend after breaking the descending trend line and the supply zone, and is also trading above the EMA 200, which is expected to rise to 55.60 then 57.20

ZEC Either OrZEC Long from 52.3 up to 57, Short 65 down to 59. It's better to lock in a fast profit so that I can compound my account than to try to hit home runs and end up liquidated

ZECUSD Parallel Channel (ZCASH)Wait for price to close above resistance level in ZECUSD cryptocurrency market.


ZEC Short at old support/resistance82.5 area has acted as support for ZEC in the past, now flipping to resistance, I will be going limit short at 82.5, hopefully execute this week
ZcashZCASH
First chart in a long time for zcash---she was my first fiance---lol----oh well she didnt get zcash----lastly zcash last longer than my x.


ZCash H4 CHartZEC/USD Key support and resistance targets on the H4 chart.. if purple line flips as resistance, expecting approximately 20% move to the downside.

ZEC Is Ready For Another Bull RunThis chart is a Fibonacci retracement where ZCASH has formed strong support at $50. It would not surprise me to see it push to $131 very soon.

ZCASH weekly time frame analysis. Looking for the wicks to be filled during the next pump. Targeting 165 to 170.
If the wicks get filled and price doesn’t continue to the upside, 165/170 would be a lower high on the weekly time frame.
What does everyone think?

ZEC, forming a double head decline.The following content is machine translation:
In the 1-hour chart, after breaking through the 70 resistance, it pulled up and stepped back to 70 and continued to rise sharply to 82. At present, it has formed a double-headed decline near 82, and there is support at 75.
The top of the indicator macd diverged from the bearish trend and the top of the RSI indicator diverged below the neutral 50 to reach bearish territory.
Summary: The double-headed falling pattern and bearish indicators have a high probability of continuing to fall. Operationally, below 75 support and look around 70.

ZCASH: +160% BEFORE -80%?Hi guys, this is what i see on Zec comparing whith previous bear market.
Maybe will be similar maybe not, for now everything seems equal.
Let's see in the coming weeks.

ZECUSD broke above the 1D MA100, first time since April.Zcash (ZECUSD) broke today above its 1D MA100 (green trend-line) for the first time since April 29. Coupled with the emerging Bullish Cross on the 1W time-frame, this is most likely a bullish extension signal, targeting the 1D MA200 (orange trend-line) and the 0.618 Fibonacci retracement level (122.00).
It would be best to wait for a 1D candle close above the 1D MA100 to have a confirmed signal, otherwise we may get one last pull-back to the 1D MA50, presenting the best buy opportunity.
--------------------------------------------------------------------------------------------------------
Please like, subscribe and share your ideas and charts with the community!
--------------------------------------------------------------------------------------------------------


ZEC, breaking the resistance.The following content is machine translation:
In the 4-hour chart, since mid-June, it has repeatedly tested the resistance near 70 and has fallen back. It has now broken through the 70 resistance mark and is rising.
The bullish trend of the indicator macd refuses to fork, the RSI indicator reaches the overbought area, and the bulls are strong.
Summary: The pattern breaks through the resistance and the indicator is bullish. Next, it will rise and fall to the vicinity of 70 to grasp the low and more, and look at the vicinity of 80.

ZTC, is close to the previous low.The following are machine translations:
In the 4-hour chart, the front head and shoulders fell, forming a downtrend line.
Indicator macd golden fork, RSI indicator rose from the oversold zone.
Summary: The pattern rebounded from the previous low and reached the downtrend line, and the indicator was golden fork and uptrend. It is expected to break through the downtrend line, break through to do more, and fall back to the vicinity of 52 if it is blocked.
