ZEC, near support.The following content is machine translation:
The 4-hour chart stepped back to support near 158 again.
Here is where the short-term layout is empty and long.
If the rebound is supported here, the short term is bullish.
If it falls below this support, it will be bearish in the short term.
We can see if it can hold up here today.
ZECRLUSD trade ideas

ZEC rare long term opportunityIn the context of the DXY and the Bitcoin chart ( please see my posts on that ) ZEC has the potential to break a long consolidation pattern. Fundamentally it's one of the best private coins anyway. If my prediction concerning the US$ and Bitcoin is correct ZEC will outperform most of the older coins. It has the potential to reach 1/10 of the Bitcoin price within years.

I SEE ZEC PULLING DOWN TO $160 ZONE SOONlooking at my analysis, I would say ZEC has the potential of coming down to $160 zone soon.
A rally may follow this fall if all things are equal. this may happen before another rally within the triangle.
KINDLY, Like, Comment, Follow and criticize.


Zcash - ZEC Waves for Zcash, prediction, already these waves started, so, just looking at the probability here, so far, we have been following so I wanted to post this chart. Anyway, it is clear that there was a bottom, and now we are moving on our way up nicely.
Not financial advice.

$ZEC Long-term Trend = PT Sub $100?Zcash continues to reflect bearish decline in spite of the wildly volatile price action.
Trendline indicates sub $100 PT remains valid, although $240 is within reach & flirting with $260 is not unrealistic.
Solid opportunities for momentum trading long & short positions.

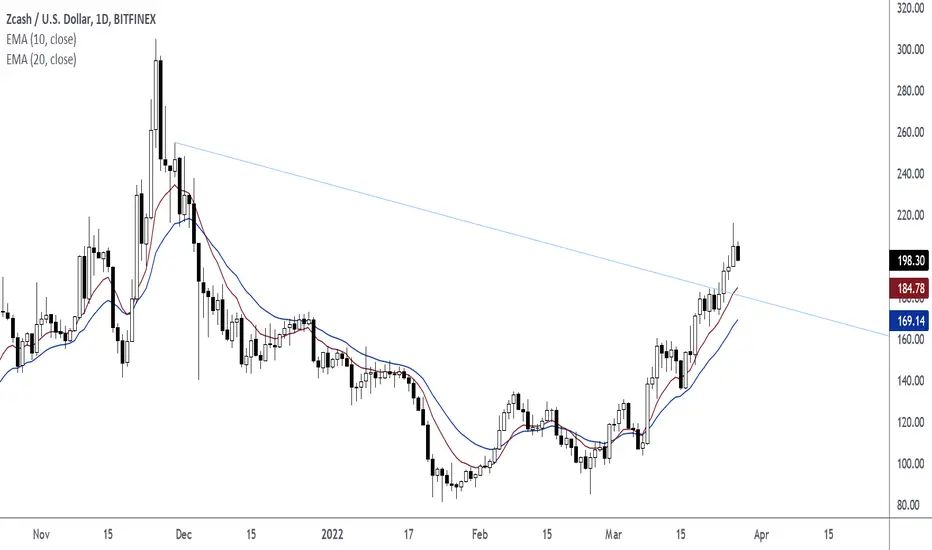
2021 November 29th Trend Line BreakWait For A Pull Back To The Trend Line, EMA 10, and EMA 20 For An Entry.
ZEC UPDATE REQUEST: Channel formationRequested TA:
Unfortunately we are heading into resistance, as you can clearly see.
2 options here, we breakout, but then fade, or we fail to break dip, and then rally.
The challenge here is now BTC as it needs to move to 55K, but with regards to ZEC, i think the trend channel, and its zones are clearly seen now.
Buy everything in Accumulation, sell everything in distribution, also when i say sell, i mean convert to BTC, or other asset that u think can hold your value well.
Overall buying ZEC here, will matter a great deal on macro, then actual price action. Since buying time was during the accumulation phase.
__REVIEW__
-------------------------------------
It is alright TA, but the fractals with the Perfect alignment is so spot on -- GOD like
---------------------------
-------------------------
Covid march strike, trend failed, solid entries were good, but not perfect - MOM was correct in a long run, heh
Bull target was executed flawlessly by those that scooped up everything in the crash.
Triangles are always dangerous and u can see why, volatile breakouts, in either directions.
-----------------------------------------------------
__FRACTALS__
APR 4, May 11, Jun 7, 23 July 1, Oct 23, May 2'2023
*LEGENDS**
BLUE = Bear/Resistance
Yellow = Bull/ Support
Vertical Lines: Fractal dates are moments of interest, where price and time collide to create oscillation.
~Explore the chart for possible scenarios of price actions - use zoom and scroll for better view.~
/*This information is not a recommendation to buy or sell. It is to be used for educational purposes only.*/
Feel free to request: your coin to be analyzed! Please keep those Stop losses in place!
Thank you,
_Ajion

ZECUSD Looking very bullish and mimicking previous move to the here I've pointed out the exact resemblance of previous move with ZEC/USD and what we can see it these are almost picture perfect from where we are at this exact moment take a look for yourself
disclaimer -- this is for educational purposes only

zec/usd update for those that have been askinghere's my mark up for ZEC/USD currently looking to continue higher here, my Swing Target of $750+ is where i will be taking about 50% of profits at this area and then looking for a potential blow off top to bring prices higher then the last crypto bull run brought Price too AND WHEN We look for where ATH (all time highs) have been registered we see different pricing but What we do all see is price has been as high as $7,000 and the low end of $3,000 on other exchanges.... SO WE ARE A LONG WAYS OFF FROM ATH.... but is that what's instore for us in this coming bull cycle?
FACTS ARE --- we are in need of Privacy when dealing with our financials so it only makes sense that this coin can and will have a real world values based off of the utility that's going to be coming mainstream to this blockchain
Disclaimer-- remember I'm just the high school drop out looking to have some fun with marking up some charts!!! and none of the information shared should be taken as financial advice because lets face it, i'm not that serious of a person :-) all jokes aside
please let me know your thoughts on this matter with ZCASH

ZECUSD Forecast: 37.29% IncreaseExpect ZCash to increase 37.29% with a take profit at 255.00.
Price closed above trend line, ema 10, and ema 20. Enter price at 185.74 which is the closing price of the candlestick.

ZECUSD attempting double bottom breakout. $196 possible target. Luna completed it’s double bottom breakout with ease, and considering we only just recently shifted back into an uptrend I’m assuming this double bottom as well as several other cryptos double bottom patterns are likely to trigger as well. Of course, as always we should wait for confirmation of a bullish breakout from this pattern, not go off assumptions, and currently the price action is finding resistance upon testing the double bottom neckline. Once it flips it to solidified support and then we see a nice impulse of bullish volume afterwards we can be more confident that it will validate the breakout. If so the target is $196. *not financial advice* Until then this idea will have to be listed as neutral despite myself having a bias towards the bullish outcome.

Zcash Reversal Rally potential on Low Time FrameA purely peer-to-peer version of electronic cash would allow online
payments to be sent directly from one party to another without going through a
financial institution.
Digital signatures provide part of the solution, but the main
benefits are lost if a trusted third party is still required to prevent double-spending.
We propose a solution to the double-spending problem using a peer-to-peer network.
The network timestamps transactions by hashing them into an ongoing chain of
hash-based proof-of-work, forming a record that cannot be changed without redoing
the proof-of-work.
The longest chain not only serves as proof of the sequence of
events witnessed, but proof that it came from the largest pool of CPU power. As
long as a majority of CPU power is controlled by nodes that are not cooperating to
attack the network, they'll generate the longest chain and outpace attackers.
The network itself requires minimal structure. Messages are broadcast on a best effort
basis, and nodes can leave and rejoin the network at will, accepting the longest
proof-of-work chain as proof of what happened while they were gone.


Zcash (ZEC) - March 23Hello?
Traders, welcome.
If you "follow", you can always get new information quickly.
Please also click "Like".
Have a good day.
-------------------------------------
(ZECUSD 1W Chart)
(Full: )
We need to see if we can break out of the two downtrend lines while maintaining the price above the 162.04 point.
A move above the 239.40 point is expected to accelerate the uptrend.
You need to see if it is moving higher than the two downtrend lines around the week that includes the 25th of April.
-------------------------------------
(ZECUSDT 1D Chart)
Resistance range: 209.6-232.7
Support section: 94.0-117.1
However, it is important to keep the price above the 163.4 point to continue the uptrend.
-------------------------------------
(ZECBTC 1W chart)
Above the 0.004341-0.005954 interval: Expect an upward trend reversal
Above 0.008700 point: Expected to create a new wave.
However, it is important to get support above the 0.003299 point in order to break out of the 0.002058-0.004650 section, which is the bottom section.
------------------------------------------------------------ -------------------------------------------
** All indicators are lagging indicators.
Therefore, it is important to be aware that the indicator moves accordingly with the movement of price and volume.
However, for convenience, we are talking in reverse for the interpretation of the indicator.
** The MRHAB-O and MRHAB-B indicators used in the chart are indicators of our channel that have not been released yet.
(Since it was not disclosed, you can use this chart without any restrictions by sharing this chart and copying and pasting the indicators.)
** The wRSI_SR indicator is an indicator created by adding settings and options to the existing Stochastic RSI indicator.
Therefore, the interpretation is the same as the traditional Stochastic RSI indicator. (K, D line -> R, S line)
** The OBV indicator was re-created by applying a formula to the DepthHouse Trading indicator, an indicator disclosed by oh92. (Thanks for this.)
** Support or resistance is based on the closing price of the 1D chart.
** All descriptions are for reference only and do not guarantee a profit or loss in investment.
(Short-term Stop Loss can be said to be a point where profit and loss can be preserved or additional entry can be made through split trading. It is a short-term investment perspective.)
---------------------------------

Bullish div & support ZEC weeklyWeekly:
Weekly bar closed high and gives us a bullish divergence, including a bounce off of support. Entry around 126 (wait for a pullback on a shorter timeframe).
A bottom has been formed and the weekly bar closed positively, showing a strong rejection of that support level and stochastic RSI came from an oversold condition, now curling up from this condition.
After the bullish divergence on the daily, see previous trade that worked out very well that downtrend seems to reverse
Entry: 126-128,5
SL: 102 (will move it up)
TP1: 177 (resistance)
TP2: 180 (1 ATR level, or higher, I'll let this remainder run probably with a trailing stop)
2022#003

ZEC/USD Main trend (part). Anonymous cryptocurrencyAnother anonymous cryptocurrency with at least some liquidity.
Main trend (part). Timeframe 1 week to understand what happens in the main trend.
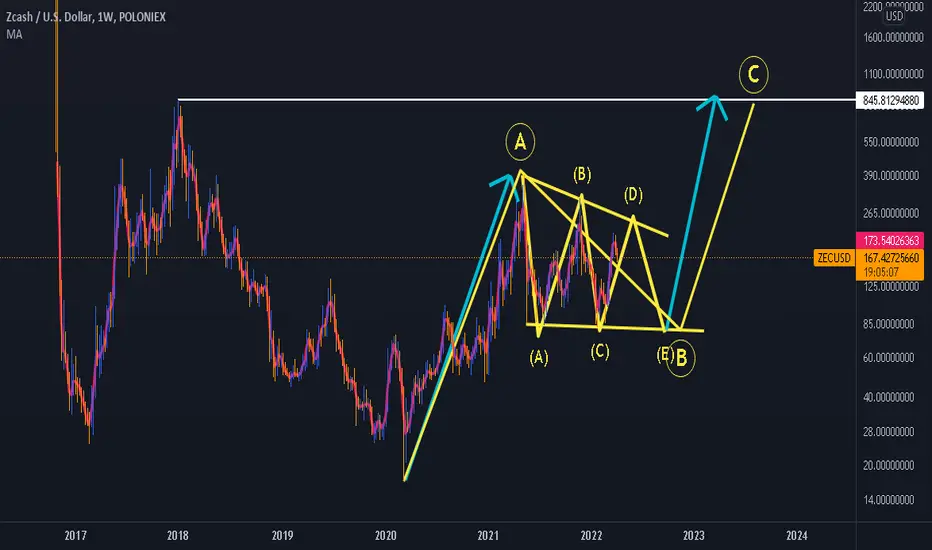
After pumping and reaching the goal of $380 (marked earlier), the pullback and the formation of a harmonious butterfly pattern. At the moment the price is in the formation of its second part. The figures marked the potential entry points, depending on your trading strategy and the market situation that arises during the development of the trend in the future.
It is rational to enter the market on the breakdown or rollback after the breakdown of the descending line of the secondary trend, which is resistance of the second part of the harmonic figure. Another option is to dial in parts from the zones of support levels by martingale. When working with this method correctly distribute the volume of potential entry in advance, remember the main thing is the average price of the set, and not to buy off the "bottom".
At a reversal on the undersized amount you can on a breakdown or rollback after the breakdown of the downtrend (if the price has not taken off considerably) to get the position by the pyramiding method, but it is not obligatory.
In very hard times, for very "fat wallets" (not cryptocurrency) like most of anonymous cryptocurrencies, it is very likely that "pumping with stick" will take place in a moment... when there will be "saving money."
Previous closed trade idea for this cryptocurrency: From and to. 51-380
ZEC/USD Main Trend. Breakout. Butterfly. Downtrend triangle
ZEC/USD Local work. Downtrend triangle. Pivot zone

Another bull flag in the making?Looks like we have another bull flag formation on the one day...... Just following this one for now... Is not trading advice please do your own research before entering any trade.


ZEC Near 16% Gains on SaturdayZcash (ZEC) was trading by over 16% higher as of writing this, as prices rose to their highest level in over three months.
After trading at a low of $748.86 yesterday, today’s high of $777.63 saw ZEC/USD break past its long-term ceiling of $772.20 in the process.
Saturday’s peak is the highest point that the price of ZEC has traded since December 9, and comes as price strength appears to be overbought.

ZEC Breakout Confirmation NeededZcash has realized a bullish reversal this week as the markets absorbed inflation reporting, the EU parliament excluded language restricting Proof-of-Work from MiCA, and the Federal Reserve clearly conveyed no substantive change to monetary policy in the immediate future.
Bullish price action likely to continue if ZEC confirms a breakout from the descending triangle with a daily close above the trendline, idealing realizing $170 support with a clean bounce.
Broader markets appear poised to enjoy bullish sentiment for next few months given midterm elections this fall.
Significant risk of further inflationary pressure resulting in a monetary policy reversal cannot be ignored.
Closely watch CPI & PPI in the coming months as these likely will see further sharp increases that will ultimately result in Central Banks reversing course.

ZEC is coming down to $150I see ZEC retracing from the recent over $178 down to $150 before any other rally may happen.
