Trade ideas

ZcashHere we have a suitable position for set buy zcash/usdt. In weekly time frame this currency broke the neck lone (head and shoulder) and we have also nice a pullback that shadows are obvious in chart that we can understand: we have buy pressure in this point. when we look closely to the chart we can see also a big double bottom. so we can set a but position here until neck line of double bottom pattern.


Zcash TO THE MOON | 75k | JBPredictionsWe're in the way of the 3rd wave.
We can buy and hold, and sell it when it reaches 75k.
We have Inverse Head And Shoulders, and it is respecting 50% fib.
Targets: 1817, 4000, 29800. 75000

ZEC Price Forecast A Gain Of 15% In Upcoming Trading SessionZcash price is at $132.13 with a gain of 4.82% in a day. The price of ZEC can encounter resistance while going upside at $170. The bounceback for Zcash can be seen from $125.ZEC price is below 50 and above 100 Days Moving Average. The 50MA (Red) line is at $137, making it temporary resistance for the price. The price is currently observing a strong bullish move and is assumed to give a positive breakout. If the price crosses above 50 MA, it would see a new high being formed.ZEC/BTC pair is seeing a consolidated move and can see a bullish momentum in the future.
Kindly comment your thoughts here

Zcash = Take out the...Crypto does not have a support, only resistances. Do what you wish.
I am not a financial advisor. Please do your own due diligence.

zeccsashhi everyone
here is an other opo if you to go long
if you felt bad because you did not bought eth or bitoin here is an other chance
do not miss it !!!!
buy heavly and hold for long
and good luck guys ..
ZECUSD on the move with a cup & handle formationTrend confirm a cup & handle formation and price rise


zcash will be worth thousands in 2021A hard close above $161 on the weekly will most likely result in a parabolic pump.
I can see ZCash reach a thousand in 2021 but easily 5 digits in the near future.


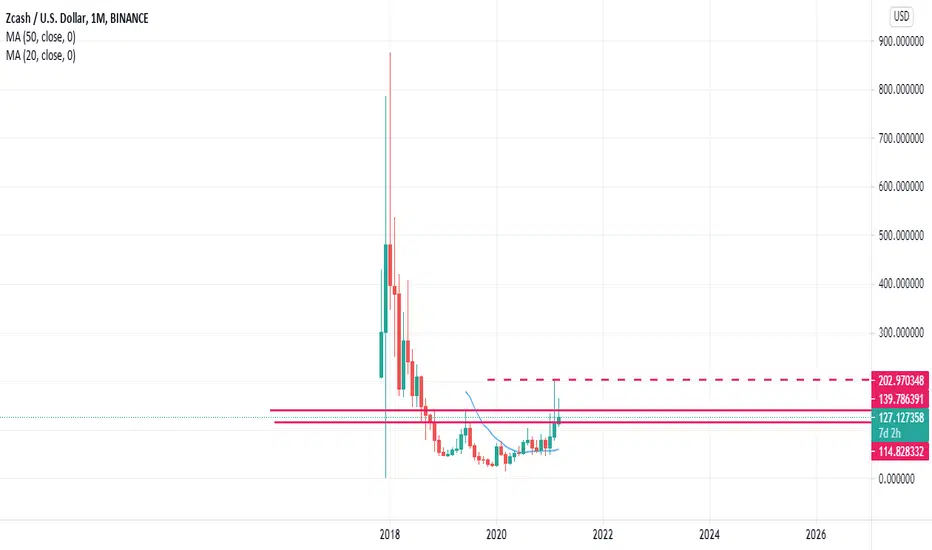
zcash chart idea possible cup and handle i think there might be a cup and handle action soon to where we maybe gain over $230 this is just an idea

OOOFI may have entered too early. We're either looking at a scamwick or an actual correction to the support of the "bigger picture" trend line. If that is so, I don't mind some zcash at ~$85, but it's so hard to give up my current position. May just hodl, or may stop out at around $120 to prevent alcoholism. Let's just hope it's a fakey and we'll see zcash nibble $300 soon. BTC is very much still influencing this price action too, but not for long as ZECBTC chart is looking fairly bullish to me. Feck BTC dominance, it's alt season.

ZCASH : PRICE ACTION IN HIGH TMF - PRICE IS GROWING ! 🔔Hello Everyone ! ! I hope you'll Appreciate our Advanced Analysis on Price Action !
Check the Link on BIO and If you LIKE this analysis, Please support our page by hitting the LIKE👍 button
Feel free to request any pair/instrument analysis or ask any questions in the comment section below.
Strategy : BULLISH CHANNEL + FIBO RETRACEMENT
Have a Good Take Profits ! ! !

Potential price action ZEC.If ZEC breaks to the upside of the Symmetrical Triangle, we may expect the price to reach the price target of 260.
Green= Support
Red= Resistance
Disclaimer: this is not trading advice, trade at your own risk.


long $ZECUSD for $715+last time I predicted a price above $100 when $zec was at $58. Now I am long on $ZEC for $715+
Super Algorithm Indicator is bullish

zcash chart idea for long term this is just an idea of mine on how zcash is gonna go looks to me we gonna have a gain soon or later just time will tell as we go


ZCash is on the verge of breaking out of an Ascending Triangle.Zcash is the one coin I don't want to chart about, I'd like it to stay cheap for a few years to accumulate, lmao.
It appears as though Zcash is about to break the red horizontal resistance of the pattern, and if not the green upward sloping support will need to hold for any validity of the pattern. Unless there's a fake-out to the downside.
On the RSI there is an Ascending Triangle pattern similar to the price, there's a series of higher lows and moderately higher highs at the horizontal resistance of the pattern. The horizontal resistance dates back into February and probably longer if I charted a longer time frame, it's possible Zcash sees some rejection.
If there is some strong resistance at the horizontal area of the pattern I have drawn a hypothetical scenario in blue.
The KST is displaying a bullish cross where I have placed the blue downward-sloping finger.

ZEC Short Term MoveSeeing zec heading towards the next major level, probably at around 260. This is a key level in the Fibonacci extension (2.618). Could be a good idea for some short-term play. Let's see how it plays out
