ZEC PERPETUAL TRADE SELL SETUP Short from $159ZEC PERPETUAL TRADE
SELL SETUP
Short from $159
Currently $159
Targeting $151 or Down
(Trading plan IF ZEC
go up to $176 will add more shorts)
Follow the notes for updates
In the event of an early exit,
this analysis will be updated.
Its not a Financial advice
ZECUSD.P trade ideas

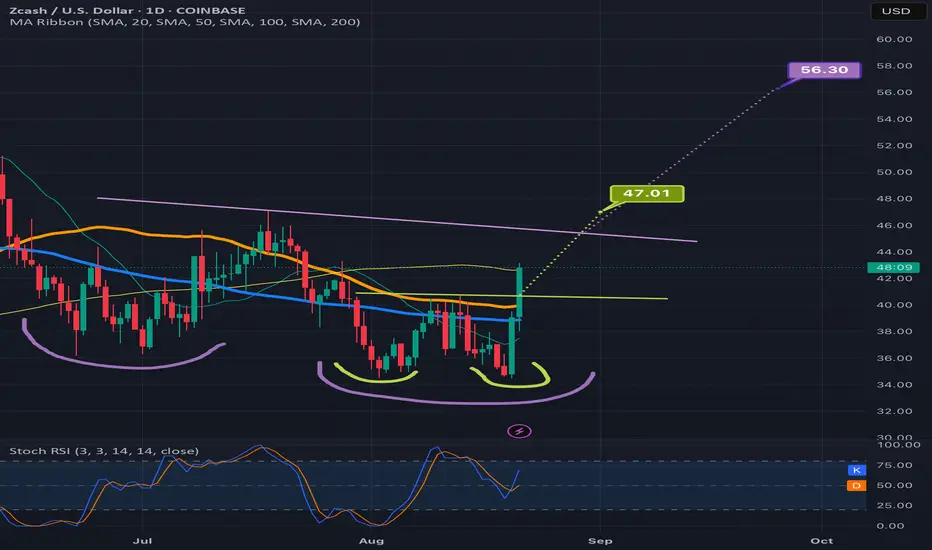
Zcash working on filling out right shoulder for next breakout Zcash appears to be forming a special inverse head and shoulders pattern I like to refer to as the sweet dreams or sleepy head inverse head and shoulders as the trendline you draw to highlight the head and shoulders take on a smile face with its eyelids closed. I anticipate even though I already drew the hypothetical length of the right shoulder fairly s that there’s a chance it could break above the neckline after forming an even shorter right shoulder based on some of the recent tiny right shoulders we’ve seen fro the likes of digibyte, atom, cardano and others. Always a chance since it’s left shoulder was tiny that the right one could buck the trend and form a regular sized right shoulder too, either way I’m confident with market conditions how they currently are theat probability favors this pattern breaking out and up eventually. *not financial advce*

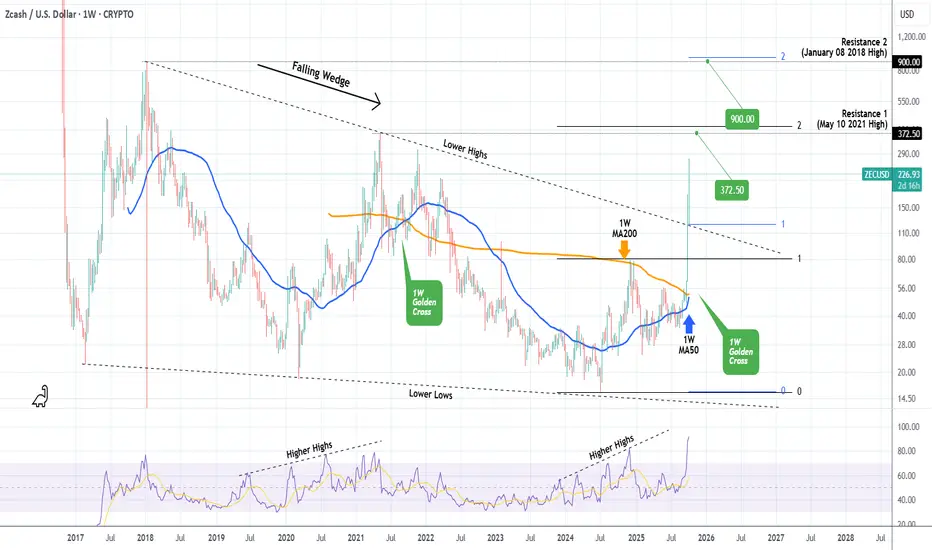
ZCASH Eyes $372.50 but might surprise us with an even higher TopZcash (ZECUSD) has been essentially trading within a multi-year Falling Wedge since the February 20 2017 Low, which effectively broke last week. This week continued equally impressively with the price currently at $239, having increased by almost +1000% since the February 2025 Low.
This Falling Wedge bullish break-out it technically targeting the 2.0 Fibonacci extension from the December 02 202 High. This falls marginally above the $372.50 Resistance (1), which is the May 10 2021 High of the previous Cycle. We expect this to get hit soon and most likely price the Top of the current Bull Cycle.
However, there is an optimistic scenario, which may push the Cycle Top to Resistance 2 (January 08 2018 High, the top of the first Cycle) at $900, which is the 2.0 Fibonacci extension (blue levels) from the Falling Wedge's break-out point. But that is assuming ZEC closes a full 1W candle above Resistance 1.
-------------------------------------------------------------------------------
** Please LIKE 👍, FOLLOW ✅, SHARE 🙌 and COMMENT ✍ if you enjoy this idea! Also share your ideas and charts in the comments section below! This is best way to keep it relevant, support us, keep the content here free and allow the idea to reach as many people as possible. **
-------------------------------------------------------------------------------
💸💸💸💸💸💸
👇 👇 👇 👇 👇 👇
Making the case for Zcash to $1000 by Christmas$1000 per Zcash in play for Christmas - possible scenario as On Balance Volume makes new all time highs

Zcash breaking away from Bitcoin shacklesZcash is beginning to break away from the trend it has shown to share with Bitcoin, a welcome sign as zcash moves closer to becoming encrypted bitcoin

ZcashUsdt?
Hi
Been on my radar. Still trending?
It had moved quite substantially.
So as per chart.
It had broken resistance. 1st
1hr ago
We'll see how it goes from here.
All the best
Not a guru

Zcash Breaks 2018 Downtrend: Confirming a Multi-Year Bull Run Zcash has just broken a trendline that had been in place since 2018. Even though the movement of the last few days might seem exaggeratedly wide, in reality, it's just the confirmation of the start of a bullish trend that will likely last for years. From both a technical and fundamental analysis perspective, it's one of the 5 most interesting coins in absolute terms. It has been undervalued for years due to fears of delisting and FUD, but institutional investors have bet heavily on it while retail investors were discouraged. That said, I wouldn't enter a position at this price, but possibly around $80-100. Personally, I've accumulated for years below $40, but on this confirmation, I'd definitely add capital. The next important resistance is the last reversal point from the previous cycle, so around $300. Dips around $100 are to be bought if they are granted. Thanks to everyone for the attention.

ZEC asic relationshipASIC release from Bitmain caused bulk supply and dumping.
Bitmain's first ASIC miner for the Zcash (ZEC) algorithm (Equihash) was the Antminer Z9 Mini, which was announced on May 3, 2018
The end.

Zcash On Balance VolumeThe Zcash Zec on balance volume has launched to new all time highs. This is the big one

Short ZEC at $173.76 I drew this line years ago at $173.76. I doubt late buyers are going to get rewarded buying ZEC after such a big week. ZEC has been around since 2016 and the fundementals have not changed significactly. What makes you think ZEC is going to make new highs? People say they love privacy but in reality, never use it. The people who actually need privacy for illegal things use XMR. You won't find any of them using ZEC. Sentitment is also very high. There's never been so much talk about ZEC.
However I'm bullish on alts in general, and I think we could eventually see $800 ZEC this cycle, but shorting this nearly decade long resistence is worth the risk/reward.

Zcash Zec Largest Weekly Handle in HistorySo Zcash just casually printed its largest weekly logarithmic candle in history. I haven't seen a blue-chip crypto move like this in a long time. Perhaps since 2013 when Bitcoin was making moves.

Zcash Wave Analysis – 30 September 2025
- Zcash broke key resistance level 76.75
- Likely to rise to resistance level 100.00
Zcash cryptocurrency recently broke above the key resistance level 76.75 (former yearly high from last year, which also reversed the price in the middle of 2022).
The breakout of the resistance level 76.75 accelerated the active intermediate impulse wave (C) of the primary ABC correction 2 from the start of 2025.
Given the multi-month uptrend and the strongly bullish sentiment seen across the cryptocurrency markets, Zcash cryptocurrency can be expected to rise to the next round resistance level 100.00.

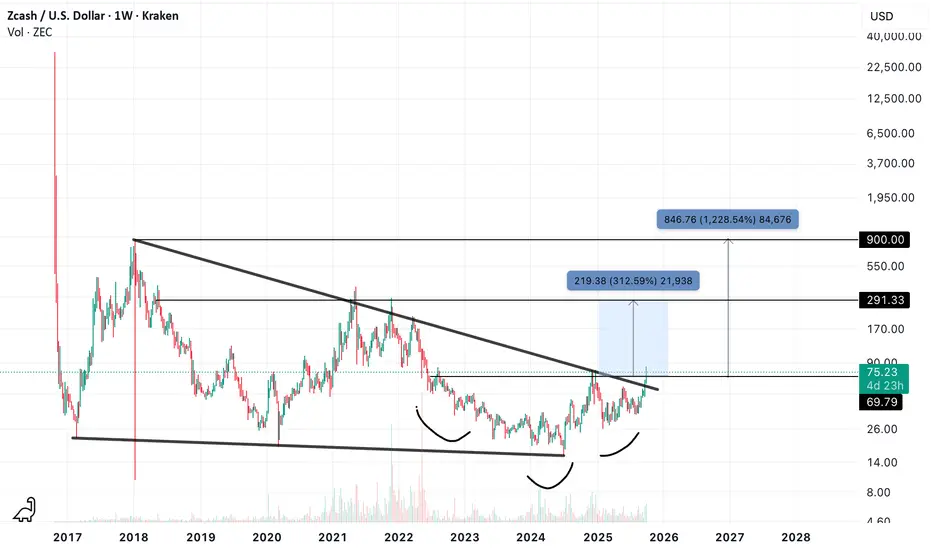
ZEC Bout to Flex and Bust Out - Targets on ChartConfirmed a close above an ascending triangle following a decade long destruction of bagholder capital.
Even the tattoo motorcycle guy probably got his ZEC tat from 2017 erased from his arm.
We also closed a substantial level in this multi year sideways chop range that just today confirmed.
280 first then 1750.
20k in the cards SEED_DONKEYDAN_MARKET_CAP:ZEC
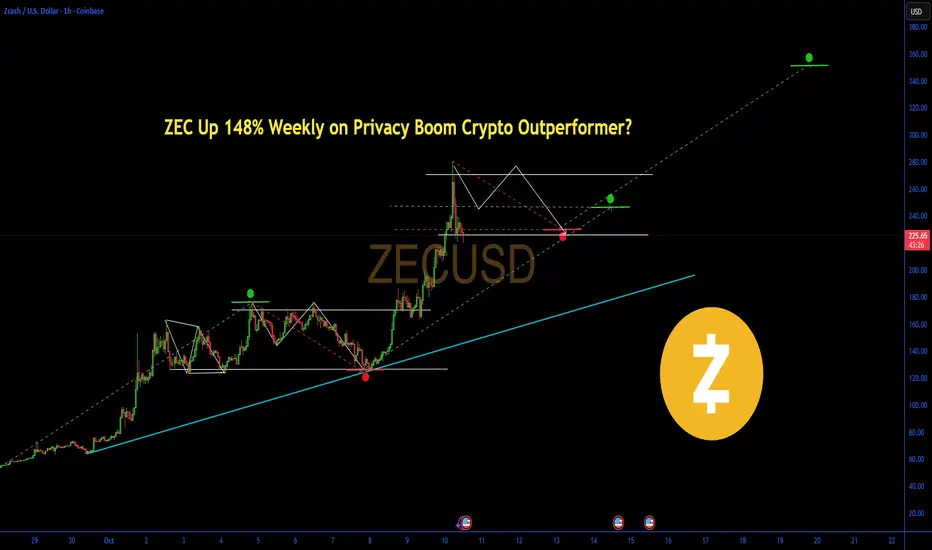
ZEC Up 148% Weekly on Privacy Boom Crypto Outperformer?ZEC – Financial Performance & SWOT Analysis
ZEC Up 148% Weekly on Privacy Boom Crypto Outperformer?
(1/9)
Good evening, folks! ZEC is surging 🚀, at $ 227.44 up 148% weekly per October 10, 2025. Privacy focus shakes up this crypto play , let’s dive in! 📊🔥 Tag a friend who needs this investing hack!
(2/9) – PRICE PERFORMANCE
• Last day: $ 227.44, up 29% daily 📈
• Weekly 2025: up 148%, outpacing market 🔄
• Recent: 390% monthly amid liquidations 🚀
This crypto stock’s volatility, privacy gains pop! 💥
(3/9) – MARKET POSITION
• Market Cap: $ 3.697B, privacy coin leader 🏆
• Avg Volume: high 24hr at $1.43B 💧
• Trend: outperformer with $700M market liquidations 👑
This asset’s dominance, holding tight! 🔒
(4/9) – KEY DEVELOPMENTS
• Price surge: 220% in two weeks on privacy hype 💰
• Liquidations: $2M shorts cleared 🏭
• Sentiment: institutional demand, Zcash ETF inflows 📈
This crypto move, privacy push! ⚡
(5/9) – RISKS IN FOCUS
• High volatility: overbought RSI 80 ⚠️
• Market corrections: liquidations spike 🆚
• Regulatory: privacy coin scrutiny 📉
This ticker’s exposure, watch these twists! ⚠️🔄
(6/9) – SWOT: STRENGTHS
• Privacy tech (shielded tx.): demand driver 🌟
• Institutional inflows (ETFs.): growth boost 🤖
• Liquidations edge (short squeezes.): momentum 👥
This asset’s edge, built tough! 💪
(7/9) – SWOT: WEAKNESSES & OPPORTUNITIES
• Weaknesses: regulatory risks, volatility ⚖️
• Opportunities: privacy coin mania, AI integration 🌍
Can this ticker beat the odds? 🎲 Reply with your take!
(8/9) – POLL TIME!
ZEC’s $ 227.44 surge, your vibe?
• Bullish: $300+ soon, privacy beats 📈🚀
• Neutral: Steady, risks balanced ⚖️🛡️
• Bearish: $200 looms, corrections hit 📉⚠️
Chime in below! 💬 Tag a friend for this poll!
(9/9) – FINAL TAKEAWAY
ZEC’s $ 227.44 climb shows resilience 💪, privacy fuels it ⚡. Risks bite 🦈, yet dips are DCA gold 💎. We grab ‘em low, climb like pros! Gem or bust? not advice, just our spin!
#ZEC #Investing #Markets #Trading #Finance #ETF #Commodities #DCA #Trends
ZEC is trending as of October 10, 2025, at $ 227.44, up 148% weekly per Yahoo Finance. Privacy gains shape its path in the crypto space. Here’s a factual financial and strategic breakdown.
**Financial Performance**
Price Movement: Weekly at $ 227.44, up 148%. Broader period shows 390% monthly surge. Daily adds upside, up 29%.
Volume & Market Cap: 24hr volume $1.43B. Market cap at $ 3.697B.
Key Metric: Circulating supply 16.26M, max supply not capped.
**SWOT Analysis**
Strengths:
- Privacy-focused tech driving demand.
- Institutional inflows and ETF hype.
- Short liquidations fueling rallies.
Weaknesses:
- High volatility and overbought signals.
- Regulatory scrutiny on privacy coins.
- Market-wide liquidations exposure.
Opportunities:
- Privacy coin boom amid transparency concerns.
- AI and tech integrations.
- Continued short squeezes.
Threats:
- Market corrections post-surge.
- Competition from other privacy coins.
- Broader crypto volatility.
**ZEC vs. SPY: Key Comparisons**
| Aspect | ZEC | SPY |
|--------|------|-----|
| Purpose & Scope | Privacy crypto focus | Broad market index tracking |
| Dynamics | High volatility vs. lower 1.00 | Steady benchmark |
| Market Position | Up 148% weekly, outperformer vs. S&P gains | Stable exposure |
**Investor Considerations: DCA**
Dollar Cost Averaging: ZEC’s volatility suits dip-buying. At $ 227.44, $10,000 buys ~44 units; a 10% dip to $ 205 nets ~49 units.
**Outlook & Risks**
ZEC’s $ 227.44 position shows privacy edge, with gains. Regulations loom, yet dip grabs turn volatility into gains. Boom or liquidations could sway it, but time’s our edge. Gem or fade? Depends on privacy demand.
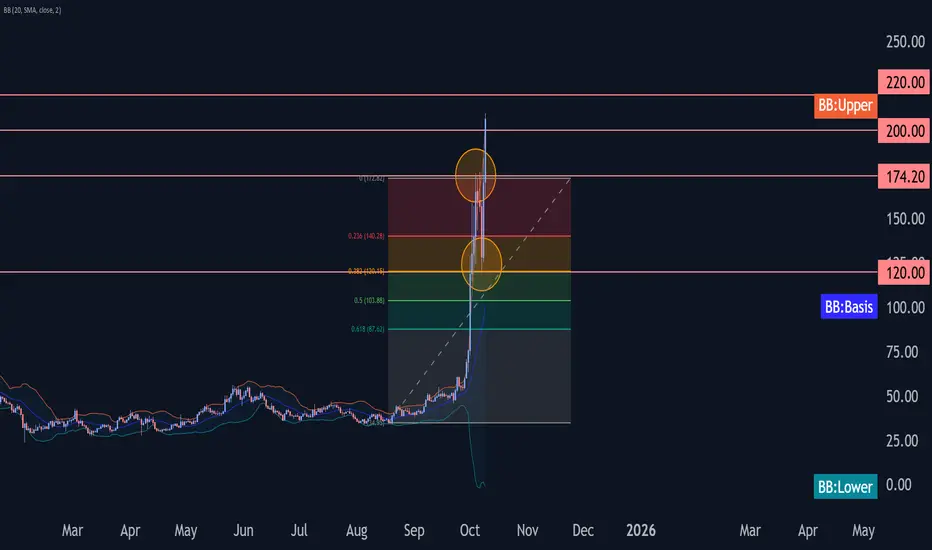
ZCASH Wave Analysis – 9 October 2025- ZCASH broke key resistance level 174.20
- Likely to rise to resistance levels 200.00 and 220.00
ZCASH cryptocurrency recently broke above the key resistance level 174.20 (which stopped the previous minor impulse wave i at the start of this month).
The breakout of the resistance level 174.20 follows the earlier upward reversal from the support level 120.00 coinciding with the 38.2% Fibonacci correction of the upward impulse from August.
Given the clear daily uptrend, ZCASH cryptocurrency can be expected to rise to the next resistance levels 200.00 and 220.00 (target price for the completion of the active impulse wave (C)).
ZECUSD long 2024Covid lows
Demand
Crypto run
Bullish
ZECUSD is a crypto that has yet to start its bullish run yet, a few days ago it just hit Covid lows and I’m taking advantage of this opportunity

Zcash may be ready to trigger a double double bottomPrice is firmly above the smaller lime green neckline at the moment and likely to trigger the breakout, the ful target of which would send price action above the neckline of the larger double bottom pattern. *not financial adviice*
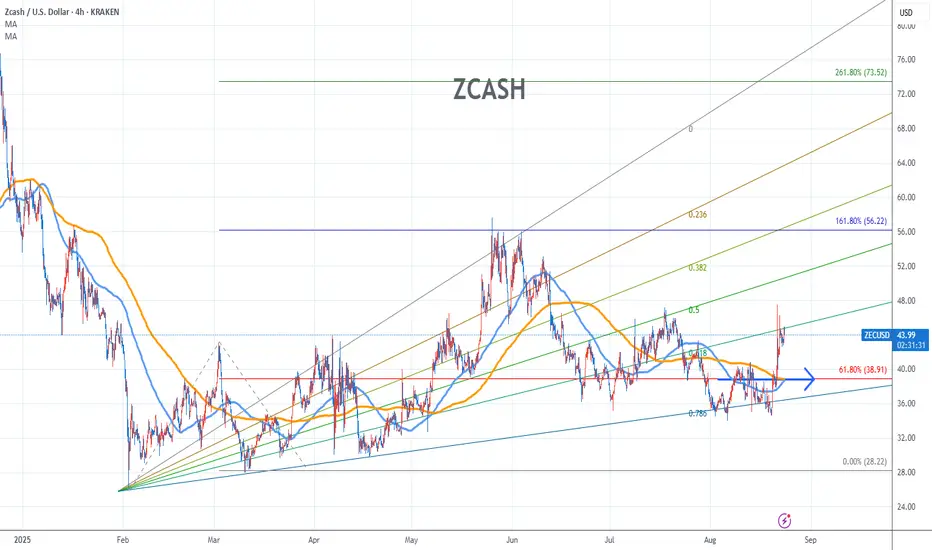
Mr.Zecash Loves 61.8Zcash has provided us with a very rare pattern
its 3 cup and handles inside one another.
we now know that it loves to hold support at the 61.8 % fib level on the previous 2
retracements.
so we have to wait and respect its wishes and join it at the 61.8 % fib level.
the target on this move is pretty decent .

ZECUSD is testing crucial support at $22.50 after breaking belowZECUSD is testing crucial support at $22.50 after breaking below its 200-day moving average. Daily chart shows a descending triangle formation with volume declining consistently, indicating weakening bullish momentum. The next key support level awaits at $21.80, which coincides with the March 2023 low.
RSI sits at 38, approaching oversold territory but not yet signaling reversal. MACD lines remain below zero with bearish divergence, though the histogram shows minor convergence, suggesting selling pressure may be moderating. Immediate resistance appears at $24.20 (previous support turned resistance), with stronger resistance at $25.80.
The privacy coin sector continues facing regulatory headwinds, particularly affecting ZEC's institutional adoption prospects. Trading volume remains below average for the third consecutive week, reflecting lack of conviction. A break below $21.80 could trigger accelerated selling toward $20.00 psychological level.

Zcash Stock Chart Fibonacci Analysis 082225Trading Idea
1) Find a FIBO slingshot
2) Check FIBO 61.80% level
3) Entry Point > 38.9/61.80%
Chart time frame:B
A) 15 min(1W-3M)
B) 1 hr(3M-6M)
C) 4 hr(6M-1year)
D) 1 day(1-3years)
Stock progress:C
A) Keep rising over 61.80% resistance
B) 61.80% resistance
C) 61.80% support
D) Hit the bottom
E) Hit the top
Stocks rise as they rise from support and fall from resistance. Our goal is to find a low support point and enter. It can be referred to as buying at the pullback point. The pullback point can be found with a Fibonacci extension of 61.80%. This is a step to find entry level. 1) Find a triangle (Fibonacci Speed Fan Line) that connects the high (resistance) and low (support) points of the stock in progress, where it is continuously expressed as a Slingshot, 2) and create a Fibonacci extension level for the first rising wave from the start point of slingshot pattern.
When the current price goes over 61.80% level , that can be a good entry point, especially if the SMA 100 and 200 curves are gathered together at 61.80%, it is a very good entry point.
As a great help, tradingview provides these Fibonacci speed fan lines and extension levels with ease. So if you use the Fibonacci fan line, the extension level, and the SMA 100/200 curve well, you can find an entry point for the stock market. At least you have to enter at this low point to avoid trading failure, and if you are skilled at entering this low point, with fibonacci6180 technique, your reading skill to chart will be greatly improved.
If you want to do day trading, please set the time frame to 5 minutes or 15 minutes, and you will see many of the low point of rising stocks.
If you want to prefer long term range trading, you can set the time frame to 1 hr or 1 day
Zcash Stock Chart Fibonacci Analysis 062325Trading Idea
1) Find a FIBO slingshot
2) Check FIBO 61.80% level
3) Entry Point > 38.3/61.80%
Chart time frame:C
A) 15 min(1W-3M)
B) 1 hr(3M-6M)
C) 4 hr(6M-1year)
D) 1 day(1-3years)
Stock progress:A
A) Keep rising over 61.80% resistance
B) 61.80% resistance
C) 61.80% support
D) Hit the bottom
E) Hit the top
Stocks rise as they rise from support and fall from resistance. Our goal is to find a low support point and enter. It can be referred to as buying at the pullback point. The pullback point can be found with a Fibonacci extension of 61.80%. This is a step to find entry level. 1) Find a triangle (Fibonacci Speed Fan Line) that connects the high (resistance) and low (support) points of the stock in progress, where it is continuously expressed as a Slingshot, 2) and create a Fibonacci extension level for the first rising wave from the start point of slingshot pattern.
When the current price goes over 61.80% level , that can be a good entry point, especially if the SMA 100 and 200 curves are gathered together at 61.80%, it is a very good entry point.
As a great help, tradingview provides these Fibonacci speed fan lines and extension levels with ease. So if you use the Fibonacci fan line, the extension level, and the SMA 100/200 curve well, you can find an entry point for the stock market. At least you have to enter at this low point to avoid trading failure, and if you are skilled at entering this low point, with fibonacci6180 technique, your reading skill to chart will be greatly improved.
If you want to do day trading, please set the time frame to 5 minutes or 15 minutes, and you will see many of the low point of rising stocks.
If want to prefer long term range trading, you can set the time frame to 1 hr or 1 day.


ZEC: The Binance Drama#Zcash withdrawals on the ZEC network have been suspended on Binance for weeks, raising concerns especially with also it being in their monitoring list.
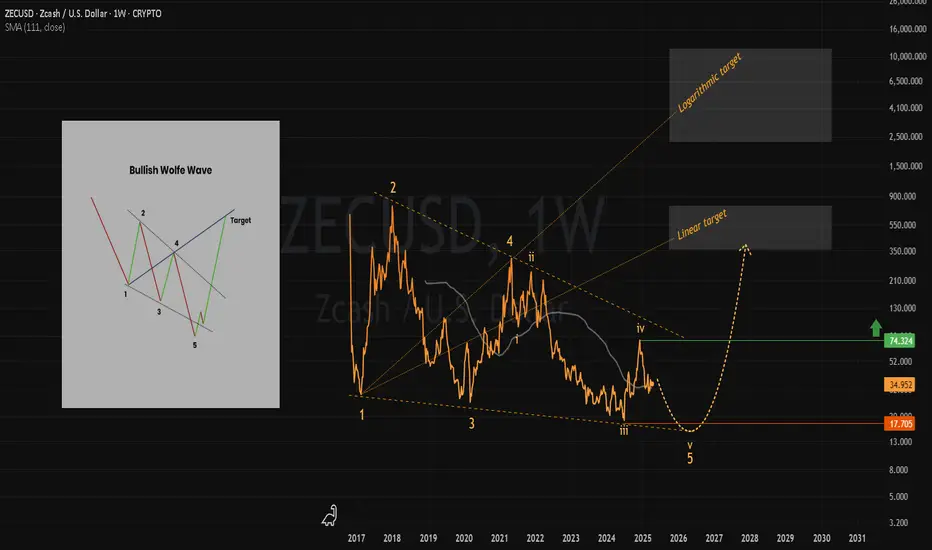
Technically, ZEC remains weak below $74.4. A drop below $17.7 to a new ATL could come before a major bullish reversal.