Careful what you wish for ZCASHConfirmed to have exited the yellow channel and turning into green for acceleration.
Already triggered 1.886 to continue higher with minimum target 2.618 90$.
This could quickly beam zec up to the upper green boundary around 125$ with a good chance to overshoot to 8.236 level at 170$
To be monitored while sitting back and enjoying the ride
Hold my beer pls
----
No financial advice, do your own research, don't be stupid
ZECUSDT trade ideas

ZEC the way to make $$ZECUSDT is prepping to go rally. You can see the bullish piercing from legit support. The way to make 2X profit is clear.
Disclaimer- Trade on your own risk and follow mandatory risk management rules while trading.


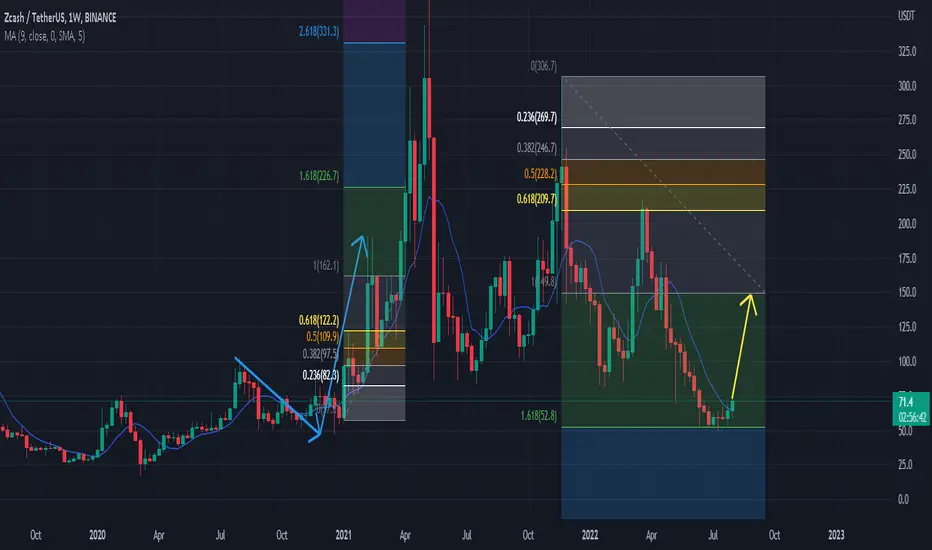
ZEC in acceleration modePicturing simply that big triagnle ZCASH has printed is crazy. After sweeping the lows below, it has finished a corrective pattern with perfect 5 wave structure in the end.
From the low we have started the yellow trend which is now being left for an accelerted green channel and blasting through first resistance in red.
Next hudle will be the bottom of the triangle, once taking, expect the upper boundary to be tested pretty soon giving a nice 50-80% rally which could mark the top for a possible 1st wave of the next impulse up to insane price ranges with 4 digits
Hold my beer pls
----
No financial advice, do your own research, don't be stupid

ZECThe price forms a cup and handle pattern. Wait for a correction to form a handle, then the uptrend will continue until the next EMA

ZEC/USDT BUYING SETUPZEC/USDT BUYING SETUP (Swing)
$ZEC valid retesting for continue upward movement Daily volume very high . Buy with money management
Entry : 70.9 - 66 - 60
Target : 78.32 - 85.04 - 92.79 - 101.42 - 110
Stop : 57

ZECUSDT look for long with a stop levelZEC look also us grow 2x, let we see within a month... Looks like all alts will grow twice (correction?)
ZECThe price rose to the upper boundary of the wedge. Several bearish divergences have formed. There is a high probability that the price will fall to the lower border of the wedge.

ZECUSDT Breakout With High Volume!ZECUSDT Technical analysis update
After 55 days of consolidation ZEC breakout with high volume and 100 and 200 EMA cross over in 4h chart.
Buy zone: $70.50 - $72.50
Stop loss : $62.50
Target 1 : $81.00
Target 2 : $91.00
Target 3 : $100
Always keep stop

Zec | Bullish opportunity.I found a beautiful curve. For more than 50 days, ZEC rose and fell in this bow. The $68 barrier looks very strong.
But if it can break through it, ZEC has a chance to go to $86.5.
If you like and support our analysis, please give us a like and leave your comment.😘
Good luck~☘

zec possible scenariohello traders ZEC has o stronge supply zone , if ZECbreakup that zone i expect this escenario for ZEC,comment below your idea ...PEACE

#ZEC/USDTThe price forms a lot of bearish divergences. The indicated trendline can create a ceiling for this bullish momentum and a correction can begin

ZECThe price forms a lot of bearish divergences. The indicated trendline can create a ceiling for this bullish momentum and a correction can begin.

ZECUSDT | WHICH WAY?ZECUSDT has taken support after retracing 0.786 fib level. The coin has also broke the parallel channel on the upside so we can expect a bullish move towards 60 levels. Its tricky here though since we have the Fed news upcoming sooner!!


ZEC Potential LongThe above trade idea is based on symbol ZECUSDT - Binance.
An alert has been set for the entry price.
Risk Management is always important. Let the trade come to you.
Stoploss(SL) 1% above entry. Take Profits(TP) at 1% increments.
First TP1 will have a higher percentage of take profit.
Do Techincal Analysis(TA) stick to your plan, let the trade come to you, and don't FOMO, if your plan does not come to fruition (not hit) then you have not lost any money, have a SL to ensure best practice so you can continue trading, journal your trade for self development and reflection.


ZECUSDT BAT patternBat
The Bat Pattern is a 5-point retracement structure that was discovered by Scott Carney in 2001. It has specific Fibonacci measurements for each point within its structure and it is important to note that D is not a point, but rather a zone in which price is likely to reverse, called the Potential Reversal Zone (PRZ). The B point retracement of the primary XA leg must be less than a 0.618, preferably a 0.50 or 0.382 and the PRZ consists of 3 converging harmonic levels: 1) 0.886 retracement of the primary XA leg, 2) extended AB=CD pattern, usually 1.27 AB=CD and 3) minimum BC projection is 1.618.
The first target would be the 382 retracement of AD and the second target the 618 retracement of AD. A common stop level would be behind the X-point. Conservative traders may look for additional confirmation. Bat Patterns can be bearish and bullish. TradingView has a smart XABCD Pattern drawing tool that allows users to visually identify 5-point reversal structures on a chart.


ZECUSDT making H & S. In 4H TF ZECUSDT is making Head and Shoulders pattern. Price broke the neckline and now expecting it to go on demand zone. Short from here can give profit between 8-11%. These are just my views. Not a financial advise. Do your own research. #DYOR.


ZECUSDT Analysis (Local Vision)Hello friends.
Please support my work by clicking the LIKE button👍(If you liked). Also i will appreciate for ur activity. Thank you!
Everything on the chart.
Entry: market and lower
Target: 75 and ~80
after first target reached move ur stop to breakeven
Stop: ~51 (depending of ur risk). ALWAYS follow ur RM .
Risk/Reward: 1 to 4
risk is justified
Good luck everyone!
Follow me on TRADINGView, if you don't want to miss my next analysis or signals.
It's not financial advice.
Dont Forget, always make your own research before to trade my ideas!
Open to any questions and suggestions.

zecusdtHello, dear trader, as you can see in the chart, the price is between the falling wedge. Also, there is a positive divergence, so in my opinion, you can take a long position
