ZECUSDT trade ideas

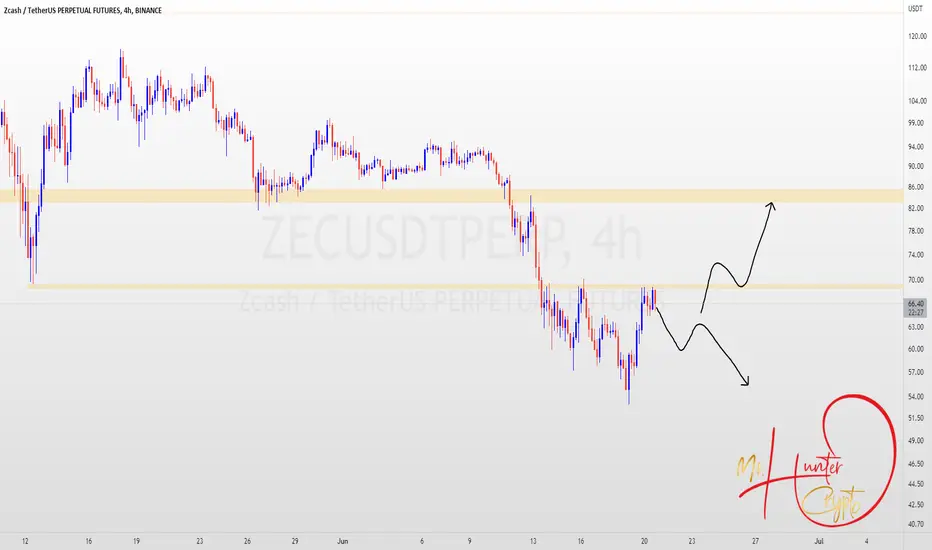
ZEC - Holders capitulating😱Reasons to take short:
⭐️ BTC bearish
⭐️ Level is 4 days long
⭐️ Price at historical lows
⭐️ Previously trapped bulls with nice-looking trendline
⭐️ Dense range
⭐️ 8th touch
⭐️ 40 ATR
⭐️ Under VWAP
Will enter when price squeezes to the level on 5m timeframe, the base will form and the tape will get faster.
Fix profit by parts:
1% - 1/3
2% - 1/3, stoploss to breakeven
What's left, hold to the maximum
What do you think of this idea? What is your opinion? Share it in the comments📄🖌
If you like the idea, please give it a like. This is the best "Thank you!" for the author 😊
P.S. Always do your own analysis before a trade. Put a stop loss. Fix profit in parts. Withdraw profits in fiat and reward yourself and your loved ones

$ZEC / USDT - 1hr - Applied GeomathTrade Idea for $ZEC - Zcash 1hr timeframe
Price Target: 93.6
Will follow up mid month on progression.


ZEC longdid some quick analysis on ZEC and look what i found
a little bit late for this trade, but still a 10% move expected.


ZECUSDT Analysis (Local Vision)Hello friends.
Please support my work by clicking the LIKE button👍(If you liked). Also i will appreciate for ur activity. Thank you!
Everything on the chart.
Entry: market and lower
Target: 80 and ~90
after first target reached move ur stop to breakeven
Stop: ~55 (depending of ur risk). ALWAYS follow ur RM .
Risk/Reward: 1 to 3.5
risk is justified
Good luck everyone!
Follow me on TRADINGView, if you don't want to miss my next analysis or signals.
It's not financial advice.
Dont Forget, always make your own research before to trade my ideas!
Open to any questions and suggestions.


ZEC definitely overbought right nowEntry point 62
Take profit at 55
Stop loss at 68
Use low leverage (3x/4x)

ZECUSDTPERPThis currency, considering that it has attacked its resistance for the second time, two scenarios can be considered for this currency: the first scenario is the price falling to the previous floor and the second scenario is the formation of a head and shoulder pattern and the price moving upwards.
ZEClong term TA .. a great pattern and strong support reached for now
my target is 600$ and this TA be failed if we close weekly under the box

ZEC/Zcash +15% to the deposit, pump!🔥🔥Subscribe to the channel, get notifications about signals!🔥
#ZEC
▪️Local uptrend, short-term deal, takeaway perspective up to $68.
💎My ideas are not a call to action, you yourself take responsibility for your actions.

ZEC/USDTZEC / USDT
Missing bottom channel support.
It is expected to drop to the $ 26 range after returning to lost support.
#ZEC #ZECUSDT #BTC #BTCUSD #LUNA #LUNC #UST

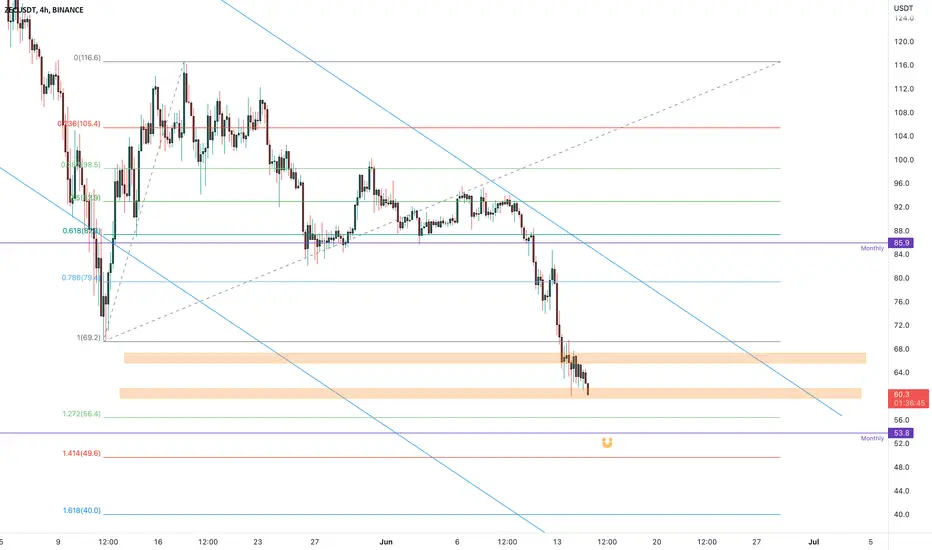
ZECUSDT wants the 1.272 Fibonacci LevelThe price list an important support on 86 (the monthly one) and after the retest the price melted until the 60$.
The market wants to retest the 1.272 Fibonacci ext above the monthly support on 53$ where the price could get new liquidity in order to try the reverse trade.
How to approach it?
IF the price is going to lose the support, According to Plancton's strategy , we can set a nice order
–––––
Keep in mind.
🟣 Purple structure -> Monthly structure.
🔴 Red structure -> Weekly structure.
🔵 Blue structure -> Daily structure.
🟡 Yellow structure -> 4h structure.
–––––
Follow the Shrimp 🦐
ZECUSDT is testing the dynamic supportThe price is testing the dynamic support above the weekly static on 87$.
The price got the rejection from the supply zone on 105 area and after a retest, It melted until the dynamic support
How to approach it?
The price needs to create a new bearish impulse and create a new breakout from the weekly level. According to Plancton's strategy , we can set a nice order
–––––
Keep in mind.
🟣 Purple structure -> Monthly structure.
🔴 Red structure -> Weekly structure.
🔵 Blue structure -> Daily structure.
🟡 Yellow structure -> 4h structure.
–––––
Follow the Shrimp 🦐

ZCASH Is Stuck between a Bearish & Bullish Trend!ZCASH is in a Symmetrical Triangle which means the Price has the chance to be Both Bullish and Bearish. No break out Has Happened yet So We Can not Determine the Trend Yet But It should Happen Soon. price in Bullish Scenario will be Reach around 140$ and in the Bearish Scenario It will reach 70$.
-ZCASH Is in a Symmetrical Triangle
-No break out
-Bullish Scenario:140$
-Bearish Scenario:70$
_ _ _ _ _ _ _ _ _ _ _ _ _ _ _ _ _ _ _ _ _ _ _ _ _ _ _ _ _ _ _ _ _
Thank you for seeing idea .
Have a nice day and Good luck


LONG ZCASH/USDTAs can be seen in the ZCASH chart, the price is near the support area at 91.2 . At the moment there is a possibility of hitting this level and returning the price upwards. Advise to LONG and put the stop loss below the support level

ZECUSDTHello Crypto Lovers,
Mars Signals team wishes you high profits.
This is a 4-hour-time frame analysis for ZECUSDT
The price is moving in an ascending channel and R2 line means a long-term resistance line and we have R1 line which used to be a support line but now it has the role of a resistance line. At the moment, the price is fluctuating below R1 and we predict a rise for the price up to R2 and then a falling trend toward S1. Also the price may lose the support at the current point and face more decline to S1, as well. But in case the price moves above R2, we will have more rise for it. Actually, due to the weakness in the trend of price, we believe more fall would happen for it.
Warning: This is just a suggestion and we do not guarantee profits. We advise you to analyze the chart before opening any positions.
Wish you luck

ZEC US leaked bill to eliminate anonymous crypto projectsA leaked copy of US draft bill proposes to eliminate anonymous crypto projects.
DAOs, DeFi and exchanges will be required to legally register in the US!
My entry area for ZEC is $69.
Looking forward to read your opinion about it.

ZECUSDT - SETUPZECUSDT's price squeezes at 89.7$ into a symmetrical triangle and reaches the apex. But the problem for Bulls is EMA21 lying at a critical resistance zone, if they succeed to break that level we may find a good upside but there is an equal probability that the price may break down to establish an undercut towards 86.0$ and then find the rhythm. Accumulation can be done in that zone. Good Luck
