ZEC USDT SHORT SIGNAL---
📢 Trade Idea: ZEC/USDT
Type: Short
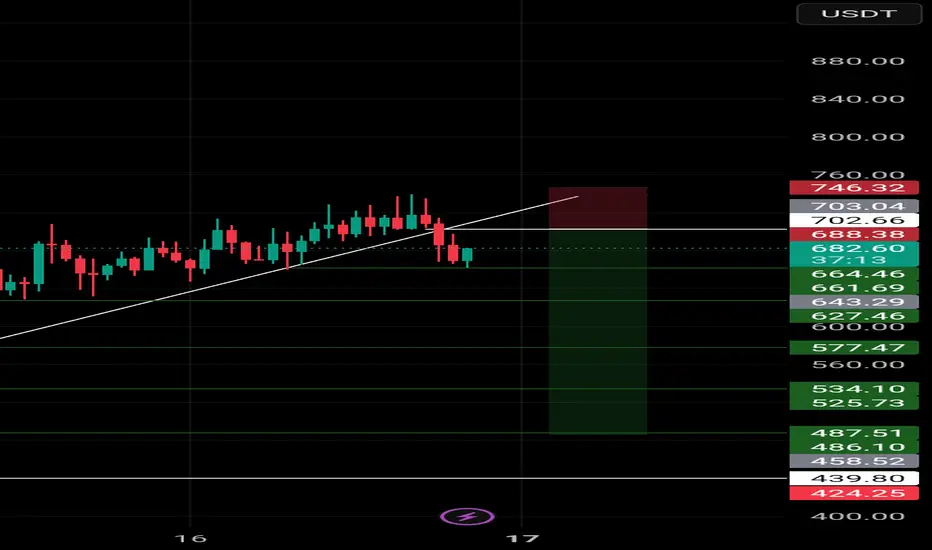
Entry: 702.62
🎯 Take-Profit Targets (Partial Exits):
• TP1 = 661.56
• TP2 = 628.10
• TP3 = 577.47
• TP4 = 534.50
• TP5 = 487.53
🛑 Stop-Loss: 747.50
⏱ Timeframe: 15m
⚖️ Risk/Reward Ratio: 5.0
💥 Suggested Leverage: 5×–10×
---
🧠 Technical Analysis Summary:
ZEC is showing strong bearish pressure after rejecting from the 740–750 resistance zone.
The price has formed a clear lower-high and is now trading below key intraday support, confirming downward continuation.
Bearish momentum indicators, including RSI and EMA structure, support a deeper correction toward the 660 and 628 zones.
If sellers maintain control below 705, the probability of reaching TP3–TP5 increases significantly.
---
⚙️ Trade Management Tips:
• Secure partial profits at TP1 and move stop to entry.
• Use trailing stop for deeper targets (TP3–TP5).
• If price closes above 710–715,
---
⚠️ Disclaimer:
This analysis is for educational purposes only and not financial advice.
Always do your own research and follow risk management.
---
📌 Hashtags for TradingView:
#ZECUSDT #CryptoSignal #ShortTrade #TradingViewIdeas
#Altcoins #FuturesTrading #TechnicalAnalysis #CryptoAnalysis
Trade ideas
Market Analysis: Zcash (ZEC) Performance and OutlookGiven the current market condition, Zcash (ZEC) is strong, especially relative to most of the rest of the market.
Next, let's consider the recent accumulation of USDT Dominance (USDT.D) over the weekend. Historically, accumulation of USDT.D often happens ahead of a period of market consolidation or possibly downside action once the trading week begins (sometimes called bloody Monday).
Considering accumulation of USDT.D ZEC could be due for a small retracement. Our target for short-term price pullback is the $525.
Key Takeaways:
Market Condition: ZEC is presently showing some relative strength.
Weekend Metric: USDT.D accumulation shows possible future market weakness.
Target: We are watching for the $525 price point as a possible temporary bottom/reversal of retracement.
I am always viewing the market in the simplest way possible.

ZECUSDT H1📈 Trade Plan
This is a Long (Buy) trade plan for *ZECUSDT* (Zcash/Tether) on the 1-hour (1h) timeframe.
The strategy being used is a *Buy on Pullback* within a potential uptrend.
1. Entry Point:
The plan is to wait for the price to pull back to the Fibonacci Retracement "Golden Zone".
The targeted entry area is between the Fib 0.5 level (453.52) and the Fib 0.618 level (451.10). This area is highlighted by the yellow box. Specifically, a **Limit Order** is placed at 455.05.
2. Take Profit (TP):
The first profit target (TP1) is clearly set at the **508.74** price level. This is marked by the yellow dotted line labeled "TP1"
.
3. Stop Loss (SL):
While there is no explicit "SL" line on the chart, the logical Stop Loss for this plan would be placed **below the entry zone**.
A common placement would be slightly below the 0.618 Fibonacci level (e.g., below 451.10) or below the previous swing low of this uptrend.
4. Supporting Analysis and Confirmation:
*Uptrend:The chart shows a short-term uptrend supported by the blue dotted trendline. This plan assumes the trend will continue.
* Stochastic RSI Indicator (Bottom):The indicator at the bottom (Stochastic RSI) is showing that the price is in the overbought territory and its lines are beginning to cross downwards. This supports the idea that a price correction (pullback) is imminent, which aligns with the plan to wait for the price to drop to the entry zone.
* Projection (Yellow Line):The dashed yellow upward-sloping line visualizes the expected price path: the price drops to the entry zone, bounces, and then continues up towards the TP1 target.
---
📋 Plan Summary
* Asset: ZECUSDT
* Position:Long (Buy)
* Entry: 451.10 - 455.05
* Take Profit 1:508.74
* Stop Loss:** Logically placed below 451.10.
**Disclaimer: This is a technical analysis interpretation of the provided chart. It is not financial advice. Trading cryptocurrencies carries a very high level of risk.

ZECASH Potential bullish price movement - long termZECASH Potential bullish price movement in the long term based in historical price data. Might be a high risk asset as a "privacy" coin.
PS: as long as regulators/exchanges accept it, it ain't true privacy

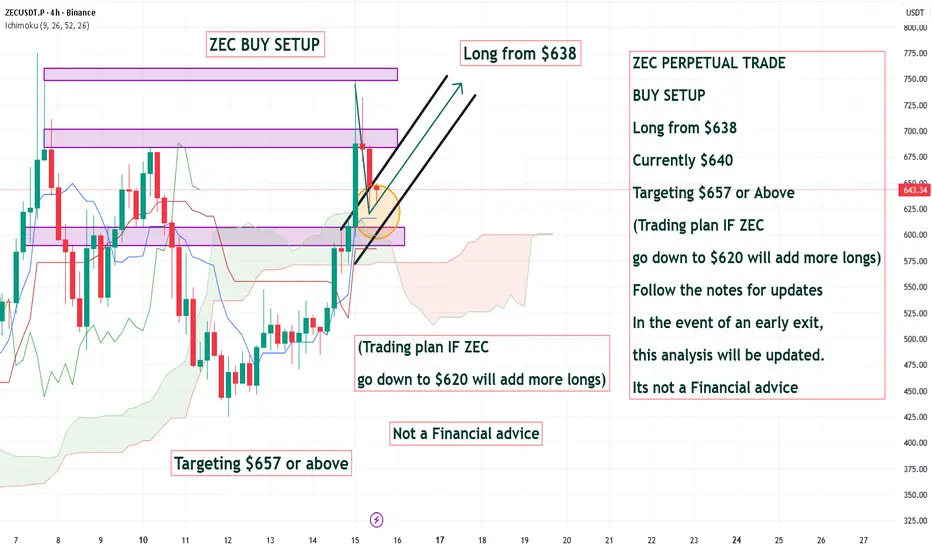
ZEC PERPETUAL TRADE BUY SETUP Long from $638ZEC PERPETUAL TRADE
BUY SETUP
Long from $638
Currently $640
Targeting $657 or Above
(Trading plan IF ZEC
go down to $620 will add more longs)
Follow the notes for updates
In the event of an early exit,
this analysis will be updated.
Its not a Financial advice
ZEC USDTopening a long and a short here would be the best risk reward. should it go down. close the long and ride the short. should it go parabolic immediately, close the short and ride the long to valhalla.
easy peasy lemon squeezy

ZEC PRIVACY ETF $1000The privacy narrative revolves around the stories, principles, and discourses that define how individuals, organizations, and societies understand and manage personal data and privacy.
The privacy narrative intersects with the ETF world through thematic ETFs that focus on companies involved in cybersecurity, data protection, and privacy technology. These ETFs allow investors to gain exposure to the growing importance of privacy and data protection in the digital age.


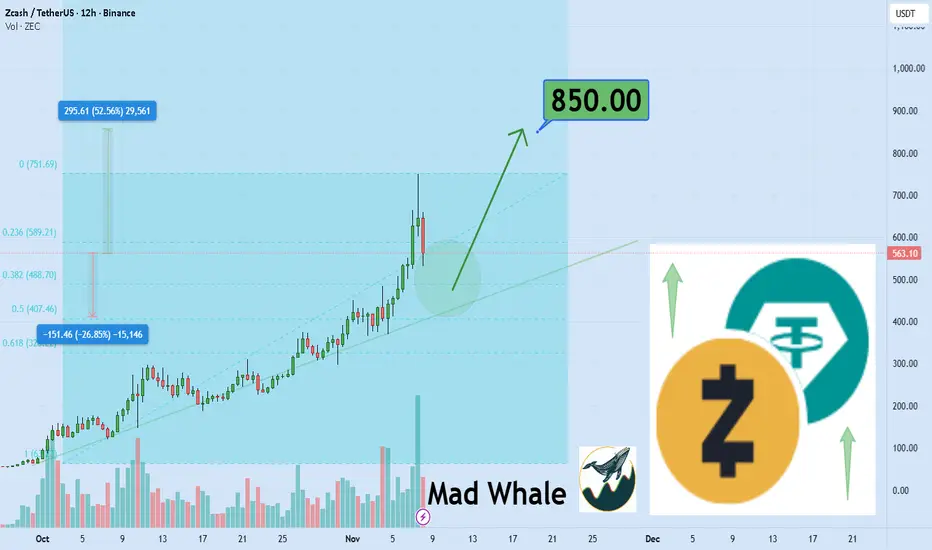
Zecusdt can hits upper target after some correction 850$ 52% Hi the support and resistances on the chart are based on the previous data and weekly candlesticks if BINANCE:ZECUSDT holds this last support the potential of 52% gain is logical toward 850$
$ZEC Update📊 CRYPTOCAP:ZEC Update
CRYPTOCAP:ZEC is testing the blue support level 🔵
If it breaks below, it could confirm a bearish setup 📉
The first short target would be the green line level 🟢

ZECUSDT 4H#ZEC failed to break the resistance, and a price correction is expected toward the following targets:
🎯 $603.47
🎯 $572.92
🎯 $542.38
🎯 $498.88
🎯 $443.48
⚠️ Always remember to use a tight stop-loss and maintain proper risk management.

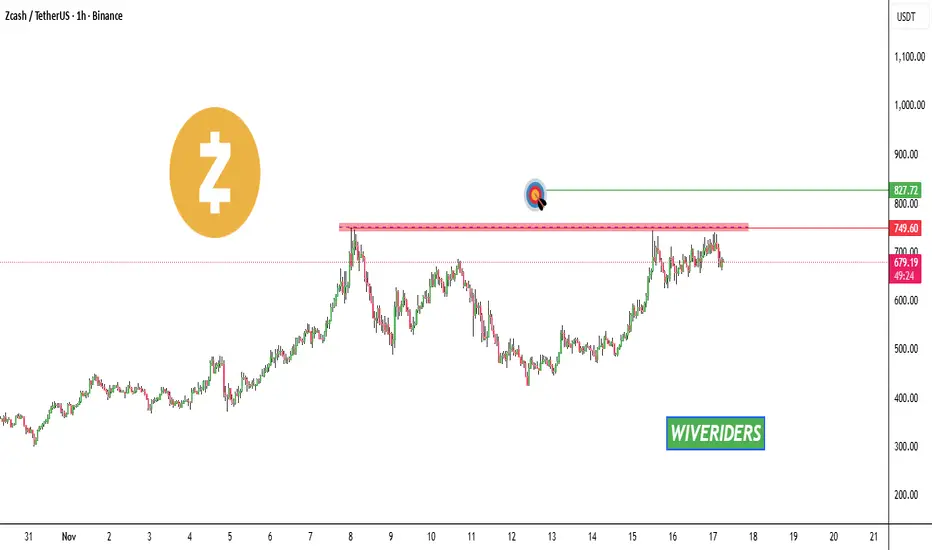
ZEC Update🚨📊 ZEC Update
ZEC has a red resistance zone 🔴 around $750,
and price failed to break out on the last attempt.
If ZEC comes back to this zone and manages a clean breakout,
the first target will be the green line level 🟢 around $827.
This resistance is the key level that must break
for bullish continuation.
ZEC 4h formed Cup & HandleCRYPTOCAP:ZEC 4H
Clear Cup structure forming with strong bullish momentum.
Price is trying to break above $715 a clean breakout targets $777 next.
Short-term support: FVG 4H at $650.
Bullish structure overall.
#ZCHASH #YodaXCalls

ZEC PERPETUAL TRADE BUY SETUP Long from $650ZEC PERPETUAL TRADE
BUY SETUP
Long from $650
Currently $650
Targeting $668 or Above
(Trading plan IF ZEC
go down to $626 will add more longs)
Follow the notes for updates
In the event of an early exit,
this analysis will be updated.
Its not a Financial advice

Watch ZEC Supports Level Next Stops? | ZECUSDT | BTCUSDT | ZCash📊 Market Update | Zcash Key Support Levels Ahead
The price action is currently hovering near the $515 zone, which coincides with the 0.618 retracement — acting as immediate minor support.
If this level fails to hold, we could see a short-term continuation toward deeper Fibonacci zones.
🔹 Support Structure:
$515 (.618 Fib) → Minor support. Losing this could trigger a quick selloff.
$482 (.706 Fib) → First strong support area; expect buyers to test momentum here.
$454 (.786 Fib) → Secondary support; deeper correction zone if sentiment weakens further.
$385 → Major support and potential reversal zone. If price reaches this area, it could mark a long-term accumulation opportunity.
🔸 Market Outlook:
Momentum remains cautious with sellers showing dominance near resistance zones. However, watch for volume spikes or bullish divergence on lower timeframes around the $482–$454 range, as that’s where potential short-term reversal setups could emerge.
As long as $515 holds, structure remains healthy for a possible bounce. A clean breakdown below it, however, would confirm weakness and open doors toward the next supports.
🧭 Strategy:
Traders may consider scaling in gradually between $482–$454 with tight risk management, or wait for a confirmed retest above $515 for a safer re-entry.

ZECUSDT may pump more and hit 950$ZECUSDT has confirmed a decisive breakout above its previous All-Time High (ATH). The chart structure and broader market sentiment are exhibiting strong bullish momentum.
This suggests a high potential for a sustained upward move. The next key projected target is set at the $950 level.
We will monitor for continuation patterns to confirm the strength of this trend.
But also we may have dump and correction to 200 to 300$ if the MM decide for that.
DISCLAIMER: ((trade based on your own decision))
<<press like👍 if you enjoy💚

TradeCityPro | ZEC: Bullish Trend & Key Resistance Levels👋 Welcome to TradeCity Pro!
In this analysis, I want to review the ZEC coin—one of the privacy coins, with a market cap of $7.12 billion, currently ranked 19th on CoinMarketCap.
⏳ 4-Hour Timeframe
This coin is moving completely independently from the market, and while Bitcoin and other altcoins are experiencing significant declines, ZEC continues its bullish trend.
🔔 Currently, the price is within a steep ascending channel, which was formed after breaking the 292 level.
✅ The resistance the price is currently facing is the 474.83 level, and I believe that if this level is broken, we can look for the next long position.
🎲 If this resistance is broken, a bullish leg towards the upper boundary of the channel could form.
💥 The RSI oscillator is moving within a box between 50 and 70, and the 50 level serves as a strong momentum support for this coin.
✨ As long as the RSI stays above 50, the bullish wave will continue, and we can open positions with broken triggers. If the 70 level breaks and enters the overbought zone, the bullish move will become even sharper.
📊 This coin is not suitable for short positions. There are plenty of altcoins that are in a downtrend and have short triggers, so it’s better to focus our attention on ZEC for long positions only.
📝 Final Thoughts
Stay calm, trade wisely, and let's capture the market's best opportunities!
This analysis reflects our opinions and is not financial advice.
Share your thoughts in the comments, and don’t forget to share this analysis with your friends! ❤️


ZEC PERPETUAL TRADE SELL SETUP Short from $638ZEC PERPETUAL TRADE
SELL SETUP
Short from $638
Currently $638
Targeting $623 or Down
(Trading plan IF ZEC
go up to $658 will add more shorts)
Follow the notes for updates
In the event of an early exit,
this analysis will be updated.
Its not a Financial advice

$ZECUSDT: at key resistance zonePrice has reached the key extension zone at 635–930, where at least a mid-term top formation is likely.
As long as price holds within or below this area, I’m watching for signs of topping and the beginning of a pullback toward the 370–235 support region.
Chart:
Macro view:

ZECWhy The Zcash Top Is Not In ... It's Trading Within A Channel
This was the original channel I had on ZEC. See points 1 and 2, which are the anchor poitns and never move, and then 3 (can be extended higher) on chart.
It took all of October and the first few days of November, finally breaking out of channel's top on November 5th full moon.
Channel top (3) can be extended. Yesterday's high coincides with an extension that is exactly 2x extension from previous channel top; we move point 3 higher, expanding channel's top, and the old point 3 becomes the new channel's mid.
Important to understand that it took over a month to break through original channel's top, and moving 2x (in channel terms) in a single day yesterday, means that it is absolutely possible to pullback that same amount in a single day. At the same time, I see this as a pullback to support at the new channel's mid, and there's no reason it can't run from mid of the new channel back up to the new channel top.

Lingrid | ZECUSDT Short-Term Pullback After Bull TrapBINANCE:ZECUSDT is pressing into the 520–525 resistance band after a strong run within the upward channel, where liquidity above prior highs could invite a quick wick. Price action shows a steady sequence of higher highs/higher lows riding the rising trendline, but fake break setup may occur. If price holds above 498–502 after any sweep, a continuation toward 523–530 remains in play; a rejection and close back below 498 would open a rotation toward 475–460. Momentum stays bullish short-term, yet proximity to a major supply cluster argues for fade-risk before continuation.
⚠️ Risks:
Broad crypto pullback or BTC dominance spike rotating capital out of mid-caps.
Loss of the 498–500 trendline cluster, invalidating the local higher-low structure.
Negative macro headlines or hot U.S. inflation prints dampening risk appetite.
If this idea resonates with you or you have your own opinion, traders, hit the comments. I’m excited to read your thoughts!

ZEC clear end of Hype . just take profit and buy BTC its just a momentum, its overhyped . the real price is still 80-100 usd.
the system is not ready and country still don't recognize and accept it.
BTC community will not support it.
Thanks me later
