#ZEC The final step of parabolic movement is the moment when the#ZEC The final step of parabolic movement is the moment when the slope becomes vertical.
We may get a couple more terrible wicks up, but we are close to the top.
Trade ideas

$ZEC/USDT on fire! From $308 to $580$ZEC/USDT on fire! 🔥 From $308 to $580. Bulls are in full control, and as long as it holds above $490–$450, this rocket could blast toward $620–$700 next. But remember, whenever privacy coins start pumping, it usually signals the market top 😂

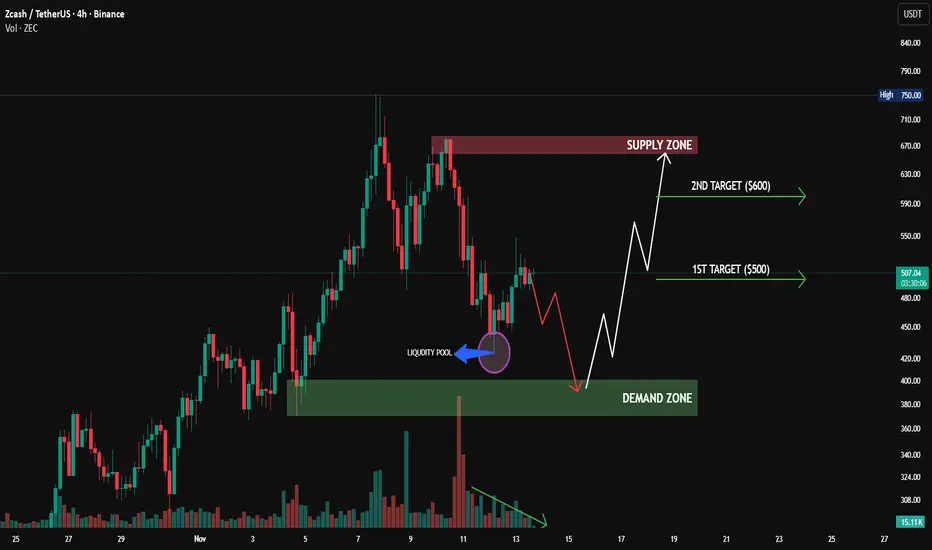
ZEC - Roadmap to $500!💪Zcash has been on fire lately, outperforming over 90% of altcoins in the market. After months of accumulation, the bulls have finally taken control, driving ZEC into a strong impulsive rally that shows no signs of exhaustion yet.
📈 From a technical perspective , ZEC is trading within a well-defined rising channel, maintaining a clean bullish structure of higher highs and higher lows. The recent breakout above the previous all-time high around $372 confirms strong bullish momentum.
🏹As long as the channel’s lower boundary continues to act as dynamic support, the next logical target for the bulls sits around the $500 round number, which aligns with the upper boundary of the channel, a major confluence zone.
In the short term, a minor pullback toward the $370–$400 region wouldn’t be surprising and could offer new long opportunities before the next bullish leg kicks in.
⚠️ Disclaimer: This is not financial advice. Always do your own research and manage risk properly.
All Strategies Are Good; If Managed Properly!
~Richard Nasr

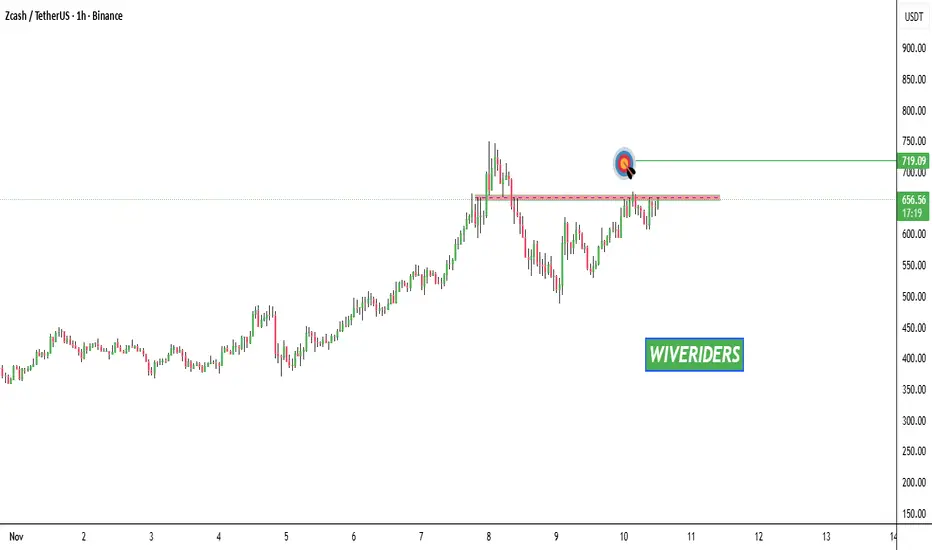
$ZEC/USDT has hit the first target at $500 with strong momentum.$ZEC/USDT has hit the first target at $500 with strong momentum. The structure still looks bullish as long as it holds above $420–$380. If buyers maintain control, the next leg could push toward $580–$620.


ZEC Update: ATH Breaker – $538 New High Amid Privacy FOMOZEC Update: ATH Breaker – $538 New High Amid Privacy FOMO, But Overbought Signals a Breath (Nov 6, 2025)
ZEC's on a tear today, smashing its 2017 ATH of ~$900 (inflation-adjusted) with a fresh peak at $538 (+20% 24h, +57% 7d, +10x monthly per 99Bitcoins), trading around $535-539 as of late EST. Volume exploded to $1.97B (2x avg), fueled by whale inflows (+0.21 Chaikin Money Flow), post-halving scarcity (supply issuance down 50%), and Q4 roadmap hype: ECC's Nov 1 drop adds ephemeral addresses for auto-privacy swaps and Keystone wallet fixes, per CoinDesk. Privacy narrative's Q4 king—CBDC tracing fears + Galaxy Digital's "cypherpunk BTC alt" nod—spillover from your ZEC long (that $229 entry? Now 2.3x green). BTC's $103K recovery (+4%) drags alts up, but ZEC decouples with 63% green days. On-chain: Shielded tx +65% to 35% of total, Grayscale +$600M YTD. X echo: @MorrisChen calls "$550 say WHAT" on BTC whale rotations; sentiment 80% bullish, but "dino coin pump at cycle end" warnings (TradingView). RSI at 81 (overbought, per CoinCodex) flags pullback risk—your chart's Darvas boxes (T1 $545, T2 $565) align perfectly for a measured move, but yellow MFI divergence hints exhaustion. Bull intact: $600+ EOW if holds $500, but trail stops.
Quick Metrics Snapshot (Nov 6, 2025)
| Metric | Value | Change (24h/7d) |
|--------|-------|-----------------|
| Price | $535-539 | +20% / +57% |
| Market Cap | ~$8.3B (top 20) | +18% / +52% |
| 24h Volume | $1.97B | +120% |
| RSI (14) | 81 (overbought) | - |
| Fear & Greed | 23 (Extreme Fear, contrarian buy) | - |
| ATH | $538 (today) | - |
Technical Ties to Your TradingView Chart
Your 1H perp chart screams continuation in the blue ascending channel (lower ~$500 now post-pump, upper $620 projection), with green candles rejecting the red descending TL at $510. Key overlays:
- Darvas Boxes: Box 5 breakout at $487 (your green vol spike) targets T1 $545 (Fib 1.618 from Oct low), T2 $565 (channel top)—watch $546 resistance for squeeze.
- Trendlines: Blue upTL from $380 low holds as support; red downTL flip at $510 confirms bull—break $546 eyes $620 (2.0 Fib).
- Indicators: RSI 75 (your panel) cooling from 85, but bull cross intact; SMACD histogram yellowing (divergence on highs), MFI overbought—expect 10% dip to $480 before rip. VIX-like vol bands wide on greens.
Supports: $500-510 (channel low, prior ATH flip); $480 (50-day EMA). Resistances: $546 (pivot R1); $565-600 (Darvas T2, psych round).
Short-Term Targets (Next 1-3 Days, Through Nov 10)
Momentum's parabolic (19/30 green days), but overbought RSI >80 risks shakeout. Path: Test $546, consolidate, then FOMO leg. CoinCodex: +8% to $529 base, but X bulls eye $550+.
- Base Case: $545-555 (2-4% upside). Measured Darvas add $10-20 from $535; high prob if vol >$2B.
- Bull Case: $565-600 (5-12% upside). Channel top + 2.618 Fib; privacy tx +10% catalyst. Weex: $540 today, scaling to $567.
- Stretch: $620 (15% upside). If MACD holds bull, but RSI dip <70 first.
Trade idea: Scale 20% out at $545 (your T1); trail stop to $510. Long bias above $520.
Long-Term Outlook (EOY 2025)
Q4 roadmap + halving echo ZEC's "ZODL" potential—Coinpedia: $360 conservative (wait, no—ATH push to $594), but models avg $722 by Dec (CoinCodex +47%). If shielded vol hits $300B, 2-3x from here.
- Base: $600-650 (12-20% from now). EMA stack bullish.
- Bull: $700-800 (30-50% upside). 1% BTC mcap slice.
- Moon: $1,000+ (85%+). If ETF whispers.

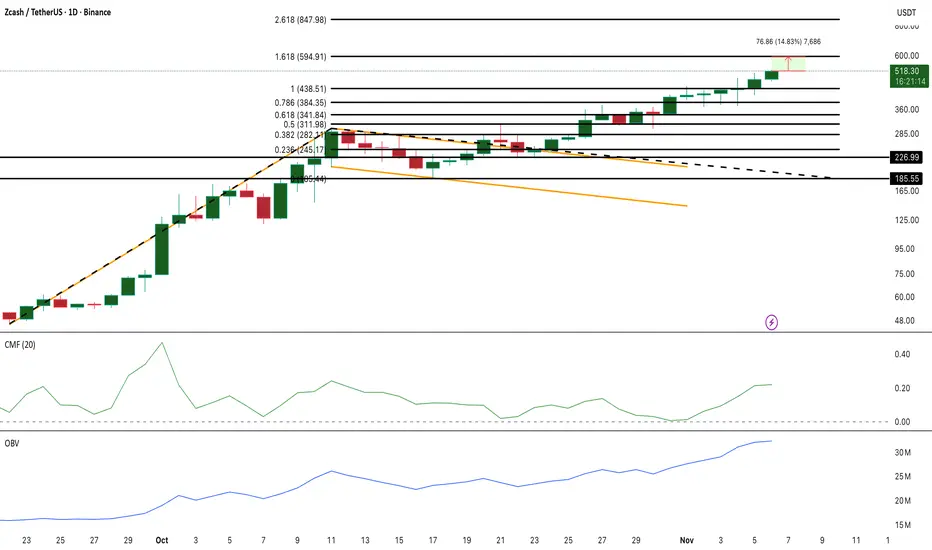
Zcash Extends Rally as Volume and Money Flow Stay StrongBINANCE:ZECUSDT (ZEC) continues its powerful uptrend, trading near $518 after breaking out of a flag pattern on October 24. The structure remains bullish, with the Chaikin Money Flow (CMF) holding above +0.20, confirming strong inflows from large wallets. Meanwhile, On-Balance Volume (OBV) keeps climbing above its October trendline, showing that the rally is backed by steady accumulation rather than speculation.
Key resistance for BINANCE:ZECUSDT now sits at $594, aligning with the 1.618 Fibonacci extension. A breakout above that level could open the way toward $847, the 2.618 target. On the downside, $384 remains the strongest support, having absorbed every pullback since November 1.
Spot inflows have dropped by more than 90% since early November, signaling reduced retail selling pressure. With volume confirming the move, BINANCE:ZECUSDT ’s uptrend still shows no clear signs of slowing.
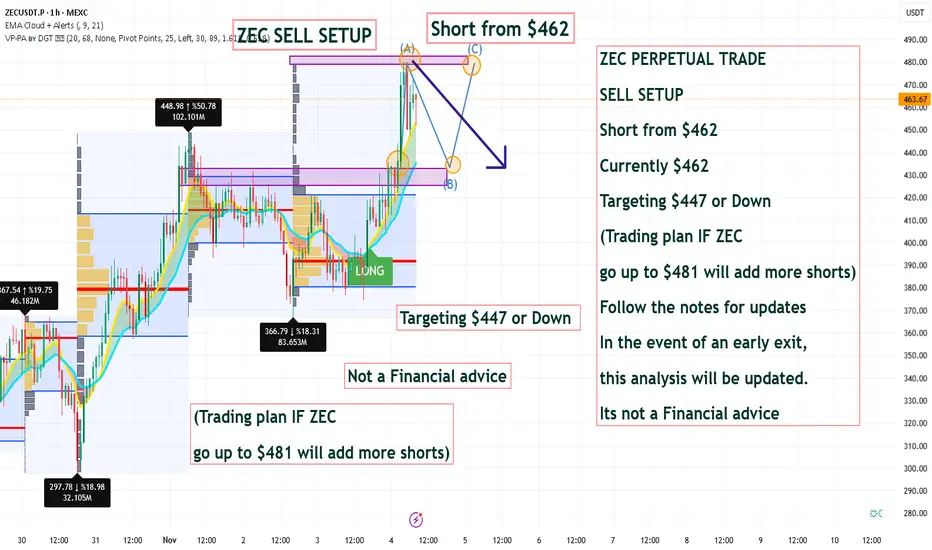
ZEC PERPETUAL TRADE SELL SETUP Short from $462ZEC PERPETUAL TRADE
SELL SETUP
Short from $462
Currently $462
Targeting $447 or Down
(Trading plan IF ZEC
go up to $481 will add more shorts)
Follow the notes for updates
In the event of an early exit,
this analysis will be updated.
Its not a Financial advice
ZEC USDT SHORT SIGNAL---
⚠️ Disclaimer:
This analysis reflects personal technical opinion only and is not a buy or sell signal.
Please analyze the chart carefully and apply strict risk management before entering any position.
---
📢 Signal Alert
🔹 Pair: ZEC / USDT
📉 Trade Type: Short
💰 Entry: 465.83
🎯 Take-Profit Targets:
TP1 = 425.24
TP2 = 390.95
TP3 = 364.00
🛑 Stop-Loss: 485.54
📊 Timeframe: 1H
⚖️ Risk/Reward Ratio: 5.19
📌 Suggested Leverage: 3x–5x
🔄 After reaching TP1, move Stop-Loss to Entry to secure profits.
---
🧠 Technical Analysis Summary:
ZEC is showing bearish momentum continuation, following rejection from a key resistance zone near 480–485 USD.
The structure has shifted to lower highs and lower lows, signaling that sellers are in control.
Price is currently trading below EMA50, confirming downside pressure, while the RSI has broken below the midline (50), suggesting continuation of the downtrend.
The entry level (465.83) aligns with a minor retest of the broken support, providing an optimal short opportunity with strong R/R.
The targets are based on previous demand zones and volume gaps, while the stop-loss is placed safely above the last swing high to protect against false breakouts.
⚙️ Trade Management Tip:
Wait for a bearish confirmation candle (e.g., 1H engulfing or strong rejection wick) before entering.
Trail your stop-loss downward after each TP to lock in profits as price continues to fall.
---
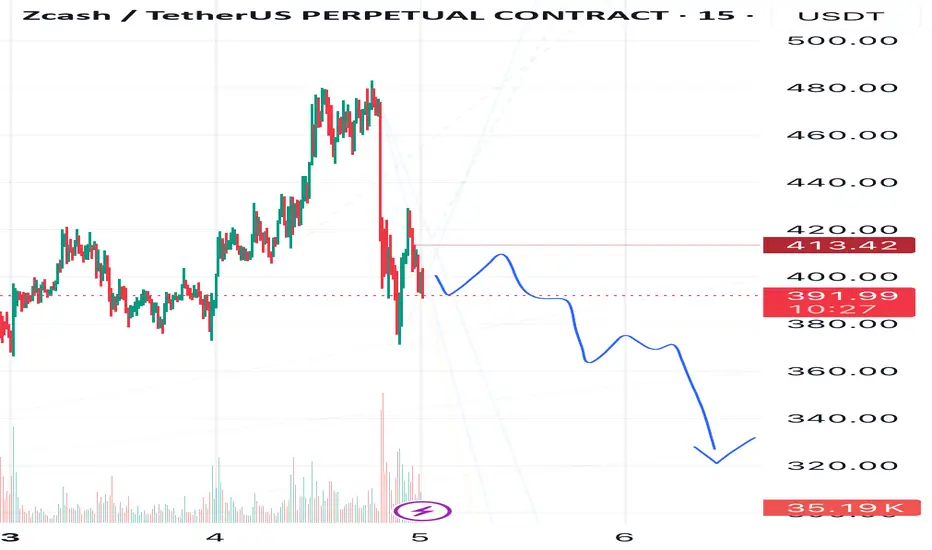
ZEC on Deck — Time to CorrectZEC finally decided to correct after its unstoppable rally.
I’m expecting it to reach 330 and lower — time to cool down before the next leg up 😌
ZEC also looks ready for a correction since Bitcoin still looks bearish globally, which could put additional pressure on altcoins.
❌ Plan invalidation level: 413.42
⚠️ Disclaimer:
This is not financial advice or a trading signal.
Always make your own decisions and never trade without a stop-loss.
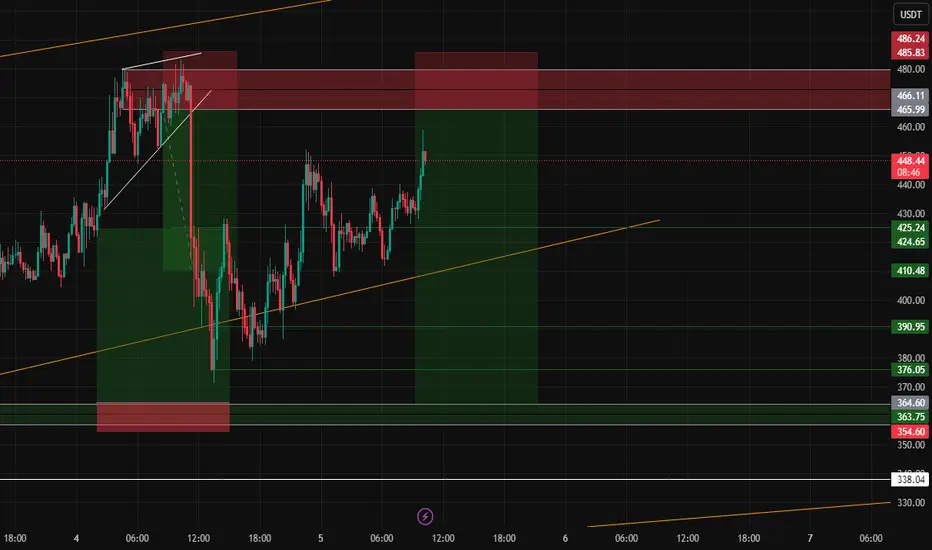
ZEC USDT SHORT SIGNAL---
⚠️ Disclaimer:
This analysis reflects my personal view only and is not financial advice or a buy/sell signal.
Please analyze the chart carefully and use strict risk management before taking any position.
📢 Signal Alert
🔹 Pair: ZEC / USDT
📉 Trade Type: Short
💰 Entry Price: 466.20
🎯 Take-Profit Targets:
TP1 = 450.32
TP2 = 435.07
TP3 = 410.48
🛑 Stop-Loss: 481.76
📊 Timeframe: 1H
⚖️ Risk/Reward Ratio: 3.58
📌 Suggested Leverage: 10x
🔄 After TP1 is reached, move Stop-Loss to Entry to secure profits.
---
🧠 Technical Analysis Explanation:
ZEC is showing bearish momentum after multiple failed attempts to break above the 470–475 resistance zone, indicating strong selling pressure.
The price has formed a lower high structure on the 1H timeframe, confirming a potential trend reversal toward the downside.
The RSI is trending below the 50-level and showing bearish divergence, while the EMA 20 and EMA 50 have formed a bearish crossover, suggesting continuation of downward momentum.
The entry level at 466.20 aligns with a supply zone where sellers previously dominated.
Take-profit levels are set based on Fibonacci retracement zones and previous demand areas, providing logical exit points.
The stop-loss at 481.76 sits just above the recent swing high to protect against false breakouts.
⚙️ Trade Management Tip:
Wait for a bearish confirmation candle (like a strong 1H rejection or engulfing pattern) before entry.
Once TP1 is hit, shift SL to entry and secure profits progressively.

ZECUSDT — One More Move Lower Before We Go Higher?Alright, it’s Monday morning…
The market is moving slower than me before my first coffee, and we’re all just waiting for NY to open so someone finally decides where the price should go.
But honestly?
It still looks like we’ve got room to move lower — not just on ZEC, but across the whole crypto zoo. 🐒📉
Don’t get me wrong, I’m bullish as hell, but smart money is clearly out here doing smart-money things…
aka pushing prices down so they can load up cheaper.
After that October liquidation festival, I thought we might recover nicely — but nope.
Crypto heard I was optimistic and said:
“Let me just fill these wicks real quick.”
This doesn’t look like only a ZEC thing — a lot of alts look like they’re begging for one more dip before any real bounce.
Where’s the bottom?
Somewhere between “soon” and “please stop.”
Until BTC or ETH breaks something major, it’s safer to lean bearish on intraday moves — but hey, it’s day trading, so prepare for a full crypto rollercoaster today anyway. 🎢
No major events in the calendar, so technicals are driving the bus today.
Good luck, legends — and PLEASE use proper risk management before ZEC uses you as liquidity. 😅🔥📉
ZEC UPDATEZEC played out perfectly. 666$ was a scary spirituel target especially if you conisder the background of the coin. Cards will fall. XMR will go on a massive pump when zcash loses its ground.

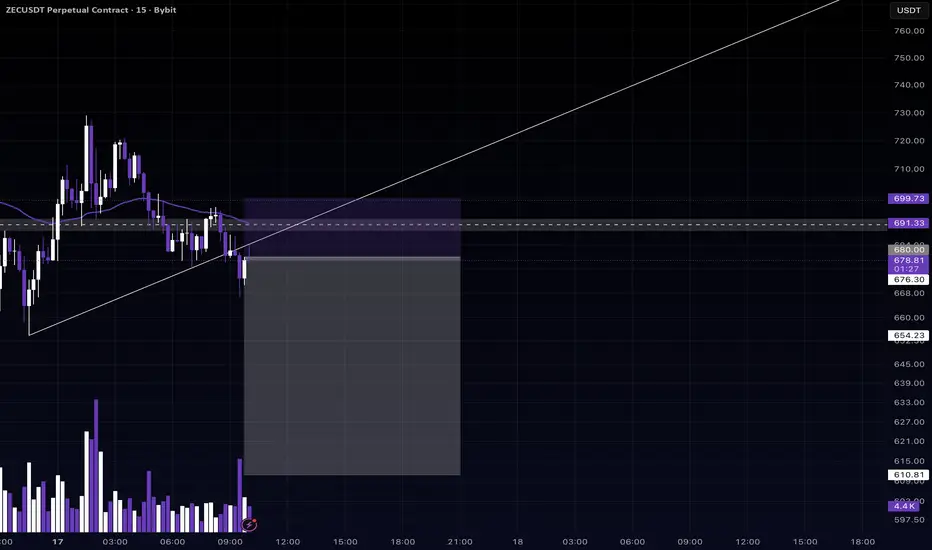
ZEC / USDT (4H Timeframe)Pattern: Liquidity Sweep & Demand Zone Reversal Setup
The chart shows ZEC forming a clear liquidity pool below recent lows, with volume steadily decreasing, indicating weak buying pressure. This setup suggests a possible liquidity sweep before a reversal from the demand zone, potentially fueling a move toward higher targets.
Key Observations
🔹 Liquidity Pool: Formed just below recent lows, signaling potential liquidity grab before reversal.
🔹 Volume Decline: buyers weakening momentum — confirming accumulation interest at lower levels.
🔹 Demand Zone: $400–$370 — key area where price could react and reverse upward.
🔹 Structure: Price expected to sweep liquidity, tap the demand zone, and resume upward momentum.
🔹 Supply Zone: $660–$680 — strong resistance where previous rejections occurred.
🔹 Market Context: Current structure aligns with a smart money-style liquidity sweep and demand zone play.
Potential Move
If ZEC sweeps the liquidity and holds above the $400–$440 demand zone, the next upside targets are:
🎯 Target 1: $500
🎯 Target 2: $600
A 4H candle close below $370 would invalidate this bullish scenario.
Summary:
ZEC has formed a liquidity pool below key lows with declining volume, hinting at a potential liquidity grab before reversal. A successful tap into the $400–$370 demand zone could trigger a move toward $500 and $600 respectively. Holding above demand keeps the bullish recovery setup intact.
#coinpediamarkets #ZEC #ZECUSDT #CryptoAnalysis
$ZEC (4-HOUR): PRICE DISCOVERY phase - finished or not?A lot of people have gotten trapped in CRYPTOCAP:ZEC - I can see it clearly on the LIQUIDATION HEATMAP (attached). Is this the end of the price discovery phase already?
The DAILY chart still shows a BULLISH market structure, but it also looks like a textbook blow-off top following a parabolic rally - long rejection wicks and a clear BEARISH ENGULFING candlestick pattern. Based on the daily setup, the price could have another leg up (WAVE 5), so there’s still some hopium left.
Zooming in on the 4-HOUR chart makes the outlook much more BEARISH - a DOUBLE TOP breakdown below the neckline (targeting roughly $350, right where the 200 MA is sitting), with huge selling volumes on that second top (counting candle closes, not wicks). The price is also trading below the 50 MA (yellow line at $537).
#zcash has now made a LOWER LOW following a LOWER HIGH (also visible on the 6H/12H timeframes), confirming a DOWNTREND.
EW-wise, similar to the DAILY chart, this #PrivacyCoin (not as private as people believe) could be in a WAVE 4 correction targeting $450 or $378 (the 2021 ATH and key ‘price discovery phase support’). That could still set up a potential WAVE 5 rally.
I don’t have any positions here - I don’t trust this asset. I wanted to SHORT it last week but didn’t get a solid setup. My plan now is to wait and see if it bounces off the lower SUPPORT levels mentioned earlier. It’s too early with the DOUBLE TOP breakdown still active.
Alert set at $380 - on my WATCHLIST since I still believe the #Privacy narrative will stay relevant in crypto for longer.
For the BULLISH scenario: CRYPTOCAP:ZEC needs to reclaim the BREAKDOWN point ($510) and the 50 MA first, and then show some BULLISH divergences to work with.
👽💙

$ZEC Update📊 CRYPTOCAP:ZEC Update
CRYPTOCAP:ZEC is testing the red resistance zone 🔴
If it breaks out above, it could confirm a bullish setup 📈
The first target would be the green line level 🟢
TransDevil Pattern The ZEC transdevil pattern idea has played out and we hit the key resistance now. Will ZEC end here?

ZEC USDT SHORT SIGNAL---
📢 Signal Alert
🔹 Pair: ZEC / USDT
📉 Trade Type: Short
💰 Entry: 593.22
🎯 Take-Profit Targets:
TP1 = 549.85
TP2 = 515.55
TP3 = 486.30
TP4 = 442.37
🛑 Stop-Loss: 633.60
📊 Timeframe: 1H
⚖️ Risk/Reward Ratio: 3.82
📌 Suggested Leverage: 3x – 5x
⚠️ Capital management is mandatory.
Please analyze the chart before entering the trade.
---
🧠 Technical Analysis Summary:
ZEC is showing strong bearish momentum after multiple rejections near the 600–605 resistance zone.
The market structure has shifted bearish, with a Lower High (LH) and Break of Structure (BOS) confirmation on the 1H timeframe.
🔸 Key points:
Sellers are dominating after liquidity grab above 600.
RSI divergence indicates weakening buyer strength.
The setup aligns with a clean supply zone retest.
Volume confirms increased sell pressure at the entry zone.
The stop-loss is placed above the latest swing high to avoid fakeouts, while targets are positioned at key demand zones with high liquidity potential.
---
⚙️ Trade Management Tip:
After TP1 is hit, move SL to Entry to secure profits and let the rest run toward TP3–TP4 for maximum reward.
---
⚠️ Disclaimer:
This analysis is for educational purposes only and does not constitute financial advice.
Always DYOR (Do Your Own Research) and use proper risk management.
---

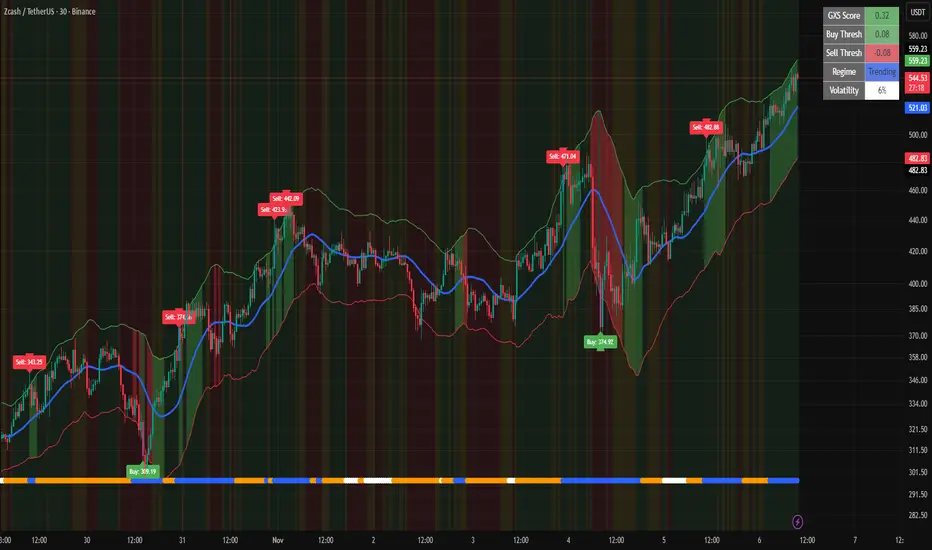
ZEC - Grok GXS , Grok SADX Monster!Grok GXS and GROK SADX indicators have been absolutely crushing the trades on ZEC in almost every time frame! ZEC is a monster and trades with a marketcap that is 238 times less than bitcoin's marketcap. ZEC is a fork of Bitcoin and is faster with cheaper transactions and optional privacy! It's time has come!

$ZEC (4-HOUR): PRICE DISCOVERY phase, HIDDEN BULL RSI divergenceCRYPTOCAP:ZEC keeps exceeding expectations, what a beast. Not many saw that coming. I did NOT, at least.
PRICE DISCOVERY phase, basically, the 2021 ATH resistance level ($372) has now been flipped into our main SUPPORT with the 50 MA directly below ($368.5).
So the horizontal SUPPORT + 50 MA, this is what I will be watching, a close below and a correction is guaranteed, almost.
We can see HIDDEN BULL divergences on most HIGHER LOWS, and there was another one yesterday, which means that the RSI is cooled down and the price action is potentially going for higher levels.
The ongoing WAVE is either an extended WAVE 5, or a WAVE A corrective move to the downside ($356, most likely).
Really tough for me to time this coin, and it won't get any easier during this unpredictable PHASE of PRICE DISCOVERY.
Oh well, there will be easier entries elsewhere.
👽💙
#zcash

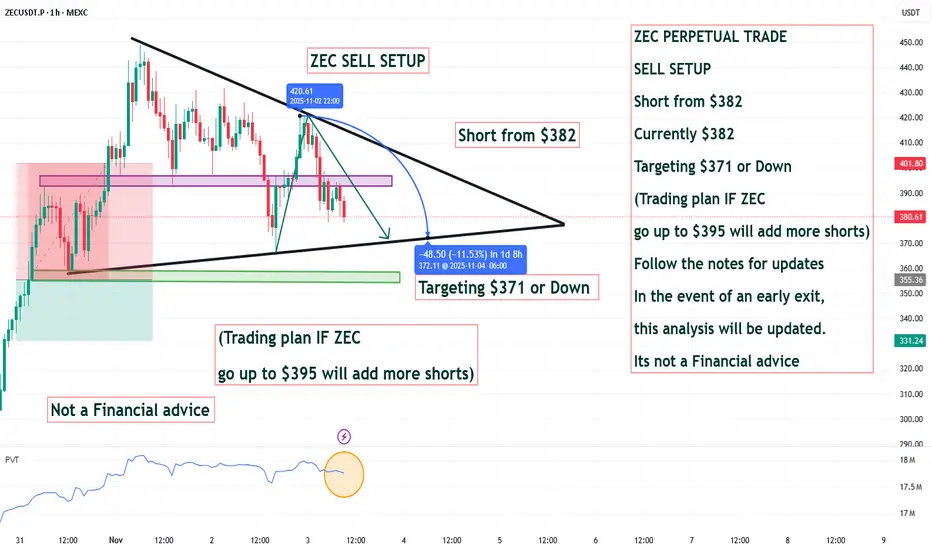
ZEC PERPETUAL TRADE SELL SETUP Short from $382ZEC PERPETUAL TRADE
SELL SETUP
Short from $382
Currently $382
Targeting $371 or Down
(Trading plan IF ZEC
go up to $395 will add more shorts)
Follow the notes for updates
In the event of an early exit,
this analysis will be updated.
Its not a Financial advice
Zec can se more gain 40% gain toward370$Hi
the support and resistances on the chart are based on the previous data and weekly candlesticks if BINANCE:ZECUSDT holds this last support the potential of 40% gain is logical toward 370$
