ZEC road map (4h)The way ZEC is growing, I think its alt season has already started before other alts, and it can easily break its previous high and see significant growth.
Trade ideas
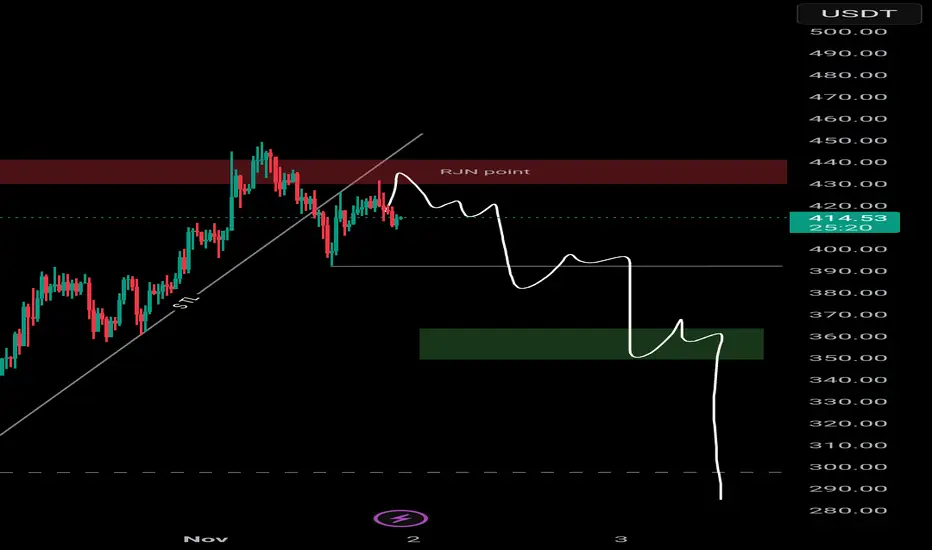
Shorted again near $430, expecting 20%+ pullbackCRYPTOCAP:ZEC 𝗦𝗵𝗼𝗿𝘁𝗲𝗱 𝗮𝗴𝗮𝗶𝗻 𝗻𝗲𝗮𝗿 $𝟰𝟯𝟬, 𝗲𝘅𝗽𝗲𝗰𝘁𝗶𝗻𝗴 𝟮𝟬%+ 𝗽𝘂𝗹𝗹𝗯𝗮𝗰𝗸🩸🔴
CRYPTOCAP:ZEC just slammed into the $450 resistance — looks like the party’s over for late FOMO buyers! 😈
I’ve stacked shorts around $430, expecting a sharp 15% - 20%+ correction as momentum fades out.
Next big buy zone on my radar: $300–$280, where I’ll watch for the next major bounce setup! ⚡
ZEC - BEARISH SETUP For me CRYPTOCAP:ZEC hitted the top here, and the FOMO wave is likely over! 🔴
I expect to see a 20%+ bearish correction from the 440$ resistance! 📉
After the beautifull setup shared this morning , I shorted the 420$ area again!
I keep an eye on the 280 - 290$ level as potential next bottom! 🍿
#ZEC #DYOR 📉

ZECUSDTRisk warning, disclaimer: the above is a personal market judgment based on published information and historical chart data on Tradingview, all analysis is only subjective. Hope investors consider, that I am not responsible for your investment decision.
Thank you.
Good luck

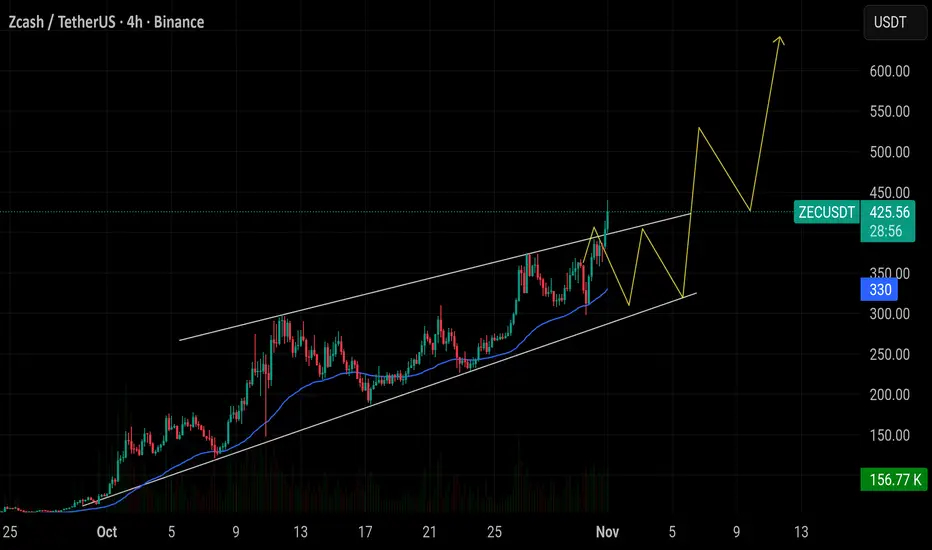
$ZEC/USDT successfully retested the $308 zone at the 50 EMA. $ZEC/USDT successfully retested the $308 zone at the 50 EMA and bounced strongly upward. The breakout above $400 confirms a clear bullish continuation pattern. With the retest already completed, momentum now favors further upside. As long as the price holds above $400, ZEC remains in a strong uptrend. The next target zone is between $500 and $600.
Bull flagPerfect setup. It's knocking on heaven's door. Will likely reject and dance within its parameters. But when it punches through, next stop is $420.69.

ZEC/USDTI believe the price will remain sideways with slight dips until news emerges regarding whether the PCE report will be released today or postponed due to the government shutdown. If reliable news of a postponement emerges, we should sell immediately. If the report releases positive results, we should expect significant gains, which will be updated on the chart. If we decline due to the negative impact of the report's postponement, our first buy order will be at 325. However, I cannot currently pinpoint the upper limit for a sell order because we anticipate very large figures due to the Federal Reserve's shift from monetary tightening to monetary easing. Therefore, I believe we are expecting substantial figures.
Note that the continuation of the government shutdown makes us uneasy.

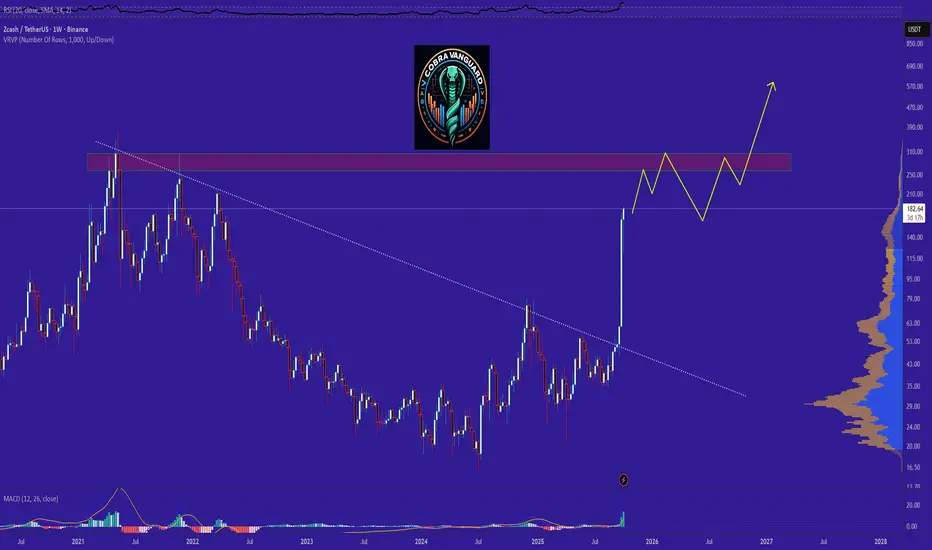
ZcashIt looks like Zcash is having altseason right now. For now it has shown a growth which equals to 6 triangle length. Let's see if it can do more.

ZEC/USDT spot Buy Bullish news: stop monetary tightening
and we are in dip so the best timing to buy then sell part in 336 and 355 or you can only sell in 355 if there will not be bearish news

ZEC/USDT spot sellNow we'll see bearish candles, or we'll rise slightly until we reach a strong order block, but I'm not interested in this weak rise that will be followed by a drop. Therefore, I think it's better to exit now until we see if the news about the PCE comes out or not. If it does, it's a good boost for the markets, and if the expectations are positive, the boost will be even bigger. If the result is weaker than expected, the price will fall, and if the result is better than expected, we'll continue with a very strong upward trend. However, if the report doesn't come out due to the government shutdown, it will be very negative again, just like what happened with the GDP news.
Be wary of the fluctuations that will occur from now on, as there may be a surprise positive or negative announcement.

#ZECUSDT #1D (ByBit) Rising wedge near breakdownZcash had a great bull run but looks exhausted right now on daily TF.
It's printing a bearish divergence between price and volume + RSI, a retracement seems likely.
⚡️⚡️ #ZEC/USDT ⚡️⚡️
Exchanges: Bitget Futures
Signal Type: Regular (Short)
Leverage: Isolated (3.0X)
Amount: 3.9%
Current Price:
353.99
Entry Zone:
355.71 - 392.39
Take-Profit Targets:
1) 298.48
2) 241.58
3) 184.67
Stop Targets:
1) 437.28
Published By: @Zblaba
CRYPTOCAP:ZEC BYBIT:ZECUSDT.P #1D #Zcash #Privacy z.cash
Risk/Reward= 1:1.2 | 1:2.1 | 1:3.0
Expected Profit= +60.6% | +106.2% | +151.9%
Possible Loss= -50.7%
Estimated Gaintime= 1-2 months

ZcashDon't believe the selling is justified. It's an overreaction to Trump-Xi meeting, which was an objective success. That means things are mispriced right now. Zcash no exception. If you aren't in position this is an excellent opportunity to buy.

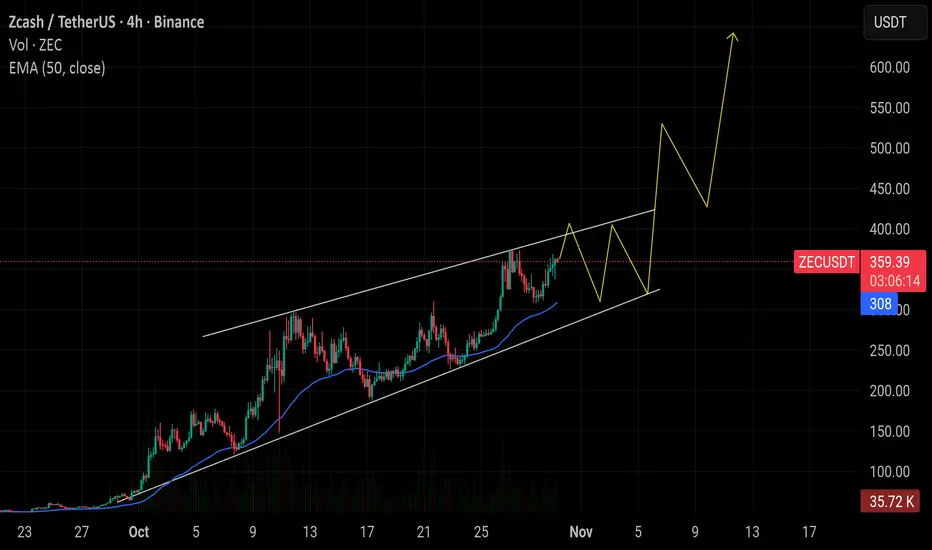
$ZEC/USDT is showing a clear bullish structure$ZEC/USDT is showing a clear bullish structure, climbing steadily inside an ascending channel with solid 50EMA support and growing buyer strength. The main breakout zone sits around $400, where a decisive move above could open the path toward $500–$600 in the next leg up. Price continues to hold higher lows, which keeps the momentum firmly in the bulls’ favor. Immediate supports lie near $308 and $290, both key levels where buyers have stepped in previously. As long as ZEC respects these zones and maintains its upward channel, the trend remains intact. A clean breakout and retest of $400 could confirm the next major rally phase.
ZECUSDT.P - October 30, 2025My personally developed minimalist buy-and-sell signal indicator generated a buy signal on ZECUSDT.P prior to a 791% price increase.
Disclaimer: This tool is for personal use only. It is not an advertisement or promotion. For educational purposes only.

$ZEC (4-HOUR): DEAD CAT BOUNCE (WAVE B) has completed?24 hours from my post last night, when CRYPTOCAP:ZEC was trading at $315, a full DEAD CAT bounce has been completed, it would seem, after hitting a LOWER HIGH (for now) at $363.
Apart from the upcoming WAVE B (a.k.a. the DEAD CAT), I also made another call — that a new ATH isn’t coming anytime soon. Now I’m not that confident anymore after clocking a HIDDEN BULLISH RSI divergence.
This might go higher, although the momentum seems to be diminishing after hitting overheated levels on the way up.
If #ZEC doesn’t continue the current surge upwards, then a WAVE C correction is next.
By the way, the limit buys I published in my previous analyses, between $282 and $304, missed by an inch and never got triggered. Annoying, but also a normal part of trading, especially under the circumstances.
Nothing to long here, imo — shorting is also too risky without any bearish divergences, so I’ll focus on CRYPTOCAP:XMR until a proper correction happens.
💙👽

ZEC - SAME SETUPCRYPTOCAP:ZEC - Similar view, uptrend channel still holding.
I expect to see a final pump to grab liquidities higher, likely toward 390 - 400$.
Then we could see a strong rejection following by a double top (monthly basis).

ZEC PERPETUAL TRADE SELL SETUP Short from $322ZEC PERPETUAL TRADE
SELL SETUP
Short from $322
Currently $322
Targeting $311 or Down
(Trading plan IF ZEC
go up to $333 will add more shorts)
Follow the notes for updates
In the event of an early exit,
this analysis will be updated.
Its not a Financial advice

ZEC LMMFAO THIS COIN ALWAYS DISAPOINTS BUT WE BALLZcash is a privacy-focused cryptocurrency which is based on Bitcoin's codebase. It shares many similarities, such as a fixed total supply of 21 million unitsZcash is a privacy-focused cryptocurrency which is based on Bitcoin's codebase. It shares many similarities, such as a fixed total supply of 21 million units

$ZEC (4-HOUR): DEAD CAT bounce next, BUYING the dip?CRYPTOCAP:ZEC has dipped 10% in value since my warning post from last night, it was no magic, just decent TA, perhaps. Or maybe luck, who knows.
Jokes aside, 16% down from the ATH made last Monday night ($275), so let me go on a limb and say that another ATH will not happen anytime soon.
No guesswork, I'm basing this thesis on the ELLIOT'S WAVES count, which is pretty clear in #zcash case. The last impulsive wave upwards completed at ATH (that was WAVE 5), I even got a STRONG SELL signal yesterday, and the correction has begun.
So, once the current WAVE A is complete, a WAVE B to the upside is next. Unlikely to break an all-time record again, but could be a good opportunity to LONG.
I'm sticking to my strategy published last night (and quoted here), and watching smaller timeframes. $282 - $304 zone is the most likely area for a reversal back to the upside.
My priority over #zec is #Monero as far as privacy coins go. The narrative is powerful and likely to stay in crypto for a bit.
💙👽
#PrivacyMatters

Scalp Short – ZEC💎 Scalp Short – ZEC
Higher timeframes show overbought conditions, while trading volume is weakening.
Price action signals a potential correction phase after recent strength.
🎯 Plan:
→ Enter after confirmation of rejection from resistance.
→ TP: 355.9 | SL: 374.58 | RR: 1 : 1.85
Momentum favors short setups.
Keep positions light, trail SL as price drops.
Stay patient — wait for clear confirmation before entry.

Healthy correctionWe had a double top. Then the volume petered out and a dead cat bounce. The VWMA is now acting as cloud, which is healthy during a correction. My target to buy more is $275-$280. That is where I believe we see major volume pour back in.
This is giving me 2016 CRYPTOCAP:BTC vibes. It makes sense to ztack and zield as much as you are comfortable with holding through the inevitable bumpy road to price discovery.

ZCASH Short IDEAThe thesis
If daily close is broken we may see quite a dump.
Also, currently the price is below the 21 EMA 1 hour

How to Find the Next 19X in crypto Like ZcashEver wondered what makes some coins suddenly explode in price?
If I told you that the same patterns keep repeating, would you believe it?
Let’s learn how to read the market’s mind, not just its charts.
Hello✌️
Spend 2 minutes ⏰ reading this educational material.
🎯 Analytical Insight on Zcash:
I still see at least another 20% potential upside for Zcash before the whales who bought it at the bottom start taking profits. However, investing in it right now is highly risky and should be considered a short-term trade with a strict stop loss and, even more importantly, a clear take-profit target.
Now , let's dive into the educational section,
💭 The Fear and Greed Cycle That Controls Every Market
Crypto markets always move between fear and greed.
When everyone feels greedy, prices are already high.
When fear dominates, the best setups quietly form.
Smart traders don’t react to emotion; they read it like a signal.
🔍 Spotting Early Signs Before the Big Move
Before every major rally, something small changes first.
Watch for strong volume at key support zones when price still looks weak.
If buyers appear while price moves sideways, it often means accumulation.
The earlier you notice this, the higher your edge becomes.
🧠 Mastering the Trader’s Mindset
Winning traders are not those who never lose, but those who stay calm.
They understand that every panic or hype wave is just a part of the game.
Confidence in process beats confidence in prediction every single time.
Emotional control is the most underrated trading skill.
💡 Combining Technical and Mental Strength
Charts can tell you what’s happening, but your mindset decides what you do next.
Many traders use indicators but still fail because they can’t control reactions.
When you plan your move before emotions hit, you become consistent.
Think of trading as a test of patience, not just analysis.
🧩 How Smart Money Leaves Clues
Smart investors never chase green candles.
They build positions when the market is silent and boring.
You’ll see higher volume with almost no price change, that’s the clue.
Once price breaks out, they’re already in and the crowd comes late.
📊 TradingView Tools to Catch the Next 19x Setup
Use the Volume Profile to see where the strongest trading activity happens.
When the highest volume appears near lows, accumulation might be active.
Next, check RSI Divergence.
If price makes new lows but RSI doesn’t, momentum is shifting quietly.
Third, study On-Balance Volume (OBV).
A rising OBV with flat price often signals hidden buying pressure.
Finally, the Moving Average Ribbon helps confirm a trend flip.
When short MAs like 20 and 50 cross above the 200 MA, bullish energy starts to build.
Combine these four tools in one TradingView layout and track five low-cap coins.
This simple routine can reveal early-stage moves that later become 19x rallies.
🧾Summary
Finding the next big crypto gem isn’t luck, it’s patience, structure, and awareness.
Every breakout begins when fear dominates and attention disappears.
Train your eye to see what others ignore, that’s where profits grow.
Golden Tips
Watch how volume reacts, not just how price moves.
When the market feels boring, opportunity is quietly forming.
Write your strategy down and follow it, discipline beats emotion every time.
✨ Need a little love!
We pour love into every post your support keeps us inspired! 💛 Don’t be shy, we’d love to hear from you on comments. Big thanks , Mad Whale 🐋
📜Please make sure to do your own research before investing, and review the disclaimer provided at the end of each post.
