ZEC DWEB Node Trends DWEB Indicator on ZEC
When you align the Gann fans with the provided node trends, more time than not, you get future trends that are meaningful. The next step is using multiple fans and identifying intersections for additional data.
It's hard to say this is gonna stay this bullish but I will say that it's still in a healthy zone for the time being. Buying tops is not my thing, but knowing when to reduce is always important. There are many lower levels that just were past on the way up. They are gaps that should always be considered possible. Long-term, I have always liked Zcash as an investment.
The long game = investment : buy mega dips, solid supports and retests. Have a R/R goal and zero emotion. You may want to find the next ZEC and hedge on that a bit.
The short game = trading : Stop limits, limit orders, be patient! You may want to find the next ZEC and let this one do it's thing. Margin trading the peaks, on hot coins, can crush you.
Trade ideas
ZEC (12-HOUR): BLOW-OFF TOP? MY BUY-THE-DIP levelsCRYPTOCAP:ZEC has set a new RECORD price at $375 after a HIDDEN BULLISH RSI divergence predicted the extension of this face-melting WAVE 5 rally.
All good things must come to an end, or at least to WAVE A and WAVE C corrective moves to the downside.
I obviously don't intend to LONG before my WAVE A correction is complete, right now it would be stupid to enter with overbought RSI and actually after a long-term rejection.
$372 was the MAY 2021 ATH, so now a resistance area has been established.
The only strategy that makes sense in my mind is to LONG when signs of a reversal start flashing during the inevitable CORRECTION.
And one potentially strong area of support I found has been on my radar.
$298 - $303, this is my zone of interest. Confluence of horizontal, rising diagonal levels + Fib 0.382 retracement of the current/recent rally (WAVE 5).
Alternatively, a level lower (fib 0.5), $281, in confluence with 50 MA on the 4-HOUR chart for dynamic support, and obviously the lower boundary of a RISING wedge.
So. Simply a strategy of not aping in late, and patiently waiting for a strong BUY-THE-DIP opportunity. Simple game, zero drama here.
👽💙

ZCASH 1HZCASH / USDT – 1H Analysis
ZEC is forming a Double Top pattern with strong resistance around the $355–360 zone.
After breaking below the neckline and confirming a potential retest, price could continue to drop toward the FVG 4H zone ($320–330) and possibly extend lower to the FVG 1H zone ($275–285).
Key insights:
Bearish structure confirmed after failing to reclaim resistance
MACD showing weakening momentum
Short-term targets: $320 → $280
If price reclaims $360+, the bearish scenario may be invalidated.
#YodaXCalls

ZCASH Breaks 3-Year Accumulation!$ZCASH has finally broken above its 2021 high after spending over three years in a long accumulation phase. This breakout above the major resistance zone signals a clear shift in momentum and could mark the start of a strong bullish cycle.
As long as the price holds above the breakout zone, the structure remains solid, any retest toward $240–$260 could offer a healthy entry point before the next leg higher. Momentum looks powerful here.
DYOR, NFA

Zcash (ZEC/USDT): Bullish Reversal Confirmed from QML ZoneHi!
Zcash is currently showing a potential bullish structure following the completion of a QML (Quasimodo Level) pattern around the $220–$230 demand zone.
After the previous high was engulfed, the price retraced deeply into the QML zone, forming a higher low and respecting the ascending structure highlighted by the trendline. This indicates that buyers are gradually regaining control.
The recent bullish impulse from the QML zone aligns with the ascending channel, suggesting that as long as the price remains above the lower boundary, the short-term bias stays bullish.
If the momentum continues, the next key resistance levels to watch are:
$280–$300 → mid-channel resistance and previous supply area
$340–$360 → upper boundary of the channel and extended target
On the other hand, a break below $230 (QML invalidation) would signal weakness and could trigger a deeper correction toward the $190–$200 demand zone.

ZECUSDT may dump and test 200$ before hitting 400$As the chart illustrates, the asset has experienced a significant bullish impulse over recent trading sessions, advancing strongly into a technically overbought territory near a perceived market top. While this suggests a potential exhaustion point, the underlying bullish momentum remains a dominant factor that cannot be disregarded. The possibility of a final parabolic move or a continuation pattern forming should be integrated into any comprehensive analysis.
In the immediate term, a technical pullback toward the key support zone at $200 appears to be a probable scenario. This would represent a healthy correction within a broader uptrend, allowing the market to consolidate its recent gains.
The market's subsequent trajectory will be critically determined by the price action at this $200 level:
Scenario 1 (Bullish Continuation) : A successful defense of the $200 support, followed by a strong bullish reversal candle, would reaffirm underlying demand. This would establish a new higher low and could project a further advance toward the next significant resistance target in the $400 range.
Scenario 2 (Trend Reversal) : Conversely, a decisive breakdown and sustained close below the $200 support level would constitute a significant bearish signal. Such a move would likely invalidate the near-term bullish structure, suggesting a potential completion of the bull run and exposing the asset to a more profound corrective decline.
DISCLAIMER: ((trade based on your own decision))
<<press like👍 if you enjoy💚

Zecusdt trading opportunityZECUSDT has shown a bullish divergence, indicating potential upward momentum. The major demand zone remains a critical support area to monitor for immediate buying opportunities. Increased volatility is expected if the price breaks above the immediate resistance level. The projected target is towards the significant supply zone, suggesting substantial potential gains.

ZECUSDT - another leg up ahead!Keep your eyes on it — just like I told you before. Its target was $250–$280, and it actually hit $298 exactly. It then entered a temporary corrective phase, forming a falling wedge pattern.
This coin is an ideal pick for the current phase, and don’t worry — its bullish run isn’t over yet.
Next target: $360. I’ll keep posting updates about it regularly.
Best regards:
Ceciliones🎯

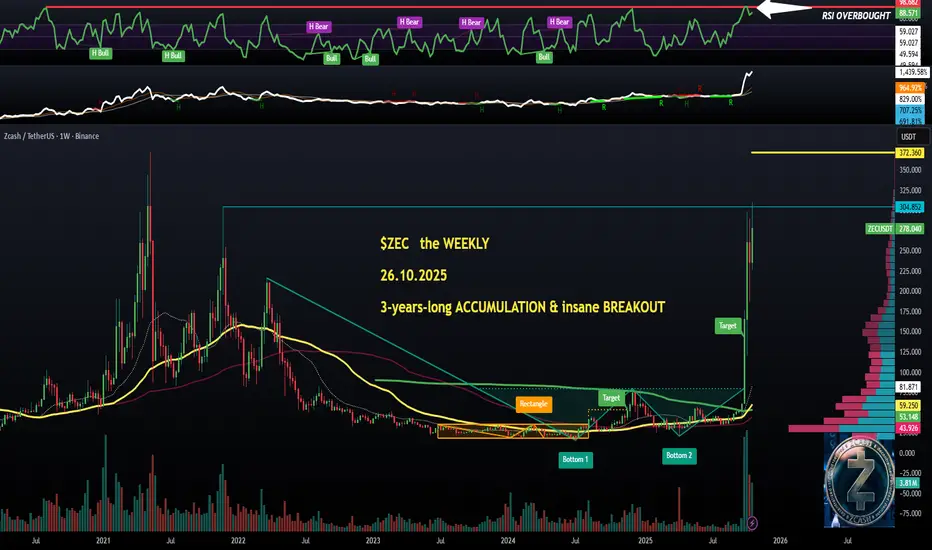
$ZEC (WEEKLY): cycle-long ACCUMULATION followed by huge BREAKOUTCRYPTOCAP:ZEC has been doing absolutely insane moves over the last 4 weeks, 500%+. Is it too late to hop on this money train? I definitely think so.
First of all, what a beautiful example of that classic piece of trading wisdom, 'the longer the acculumation, the greater a breakout'.
It was nearly 4 years of absolutely nothing in terms of patterns, just pure bottom-shaping. Sideways, chop-chop, no trend whatsoever.
And then, once the 200 MA was broken, total madness. I love the 200 MA, super pivotal. But that was one, EXTREME case of it.
Right now, it's extremely overbought after hitting $310 this week, still no ATH (May 2021 - $372).
And people will be aping in just based on the fact that it is yet to break the record price.
Possibly, it might easily continue upwards, but the WEEKLY has been screaming CAUTION (it has for a while, to be fair).
I have caught up with my #zcash research a bit today, there obviously are NO UNLOCKS to worry about, just the regular EMMISIONS from mining (like CRYPTOCAP:BTC with the HALVINGS every 4 years).
Tokenomics-wise, each DAY roughly 2-3 thousand tokens enters circulation. That's a substantial $ amount, betweem $600k and $900k in freshly minted coins, per day.
I am definitely going to try and find a SHORT position on this, just give me some time. Too late to do anything else, and that LIQUIDATIONS cluster just above $200 looks tasty in the MARKET MAKER eyes, no doubt.
👽💙
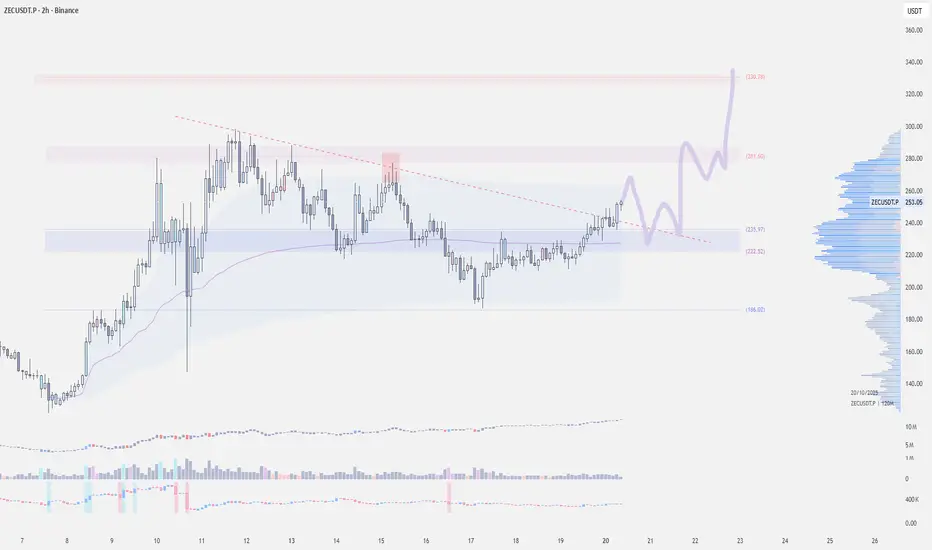
ZEC / USDT – Retesting Support Trendline, Preparing for BreakoutZEC is currently retesting a key ascending trendline that has acted as strong support since early October. The price has been forming higher lows, indicating continued bullish structure on the 4H chart.
After multiple rejections around the $290–$300 resistance zone, ZEC is consolidating near $255 and showing signs of accumulation. If the trendline support holds, a potential breakout above $300 could trigger a strong bullish continuation toward $340 and $360.
Key Levels:
- Support: $240–$250
- Resistance: $290–$300
- Targets: $340 / $360
Invalidation: A 4H close below $235 would invalidate this bullish setup.
Overall, ZEC remains in an ascending structure, and a confirmed breakout above the horizontal resistance could mark the start of the next leg up.

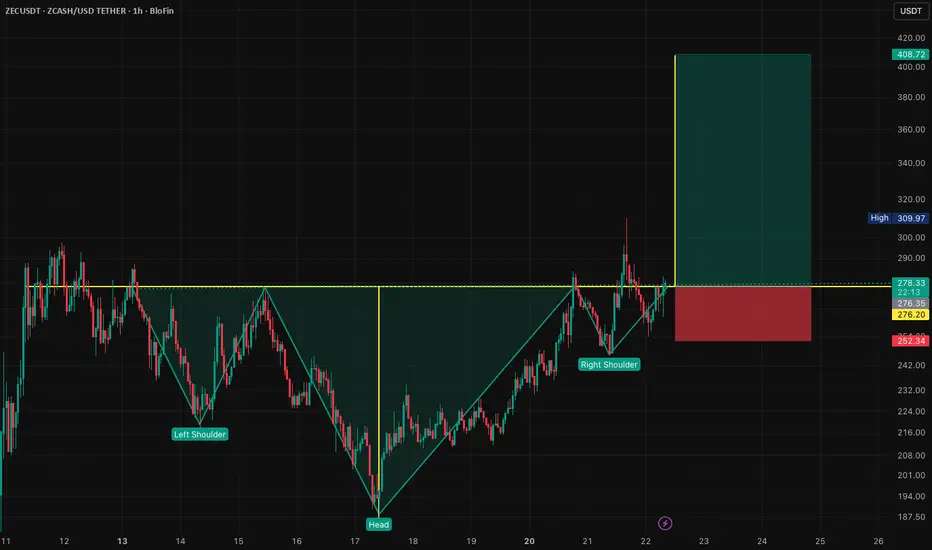
ZECUSDT Breakdown Incoming? Don’t Get Caught Long!Yello, Paradisers! Have you been paying attention to what’s happening on ZECUSDT lately? If not, now’s the time to look closely—because the signs of an incoming bearish move are stacking up fast, and getting caught on the wrong side could be costly.
💎Right now, ZECUSDT is reacting directly from a key 4H resistance zone, and the price structure is showing some serious warning signals. We’re seeing the formation of a clear Head & Shoulders pattern, which is one of the most reliable bearish reversal setups. On top of that, there’s bearish divergence showing up—indicating that upside momentum is fading, even as price attempts to push higher.
💎This kind of setup is what experienced traders wait for. For aggressive traders, there’s already a potential short opportunity from current levels. However, if you're more conservative (as you should be in this kind of uncertain environment), it's smarter to wait for a pullback and then look for a clear bearish candlestick formation. That confirmation will not only improve the probability of success but also provide a much more favorable risk-to-reward ratio.
💎But caution is key here. If price breaks and closes above the resistance zone, this whole bearish idea becomes invalid. In that case, the best move is to stay patient and wait for clearer price action before making any decisions. Jumping in early without confirmation is what wrecks most traders.
🎖Strive for consistency, not quick profits. Treat the market as a businessman, not as a gambler.
MyCryptoParadise
iFeel the success🌴

ZEC Head & Shoulders Breakdown – Dead Cat Bounce Setup?ZEC has broken down after completing a fairly large head-and-shoulders pattern, which typically signals bearish momentum. The neckline break triggered a sharp sell-off, putting pressure on support zones. Price action suggests that a rebound may be in play soon as the market searches for a local bottom.
👀 Key Zone to Watch: The $215–$210 range is the ideal bounce zone, where buyers may step in for a classic dead cat bounce. This area has confluence with prior structure and should attract tactical entries. A strong reaction here could open the door for a smart pump.
🎯 Trade Plan:
Entry Zone: $215–$210
Take Profits: $235 / $250 / $270
Stop Loss: Close below $207

ZEC on Deck — Correction CheckI expect a correction on ZECUSDT.
My downside targets are:
1️⃣ 210
2️⃣ 188
3️⃣ 156
The invalidation zone is marked in red on the chart.

TradeCityPro | ZEC: Bullish Structure Holding Strong👋 Welcome to TradeCity Pro!
In this analysis, I want to review the ZEC coin for you — one of the Privacy and Layer 1 projects, ranked 28th on CoinMarketCap with a market cap of $4.42 billion.
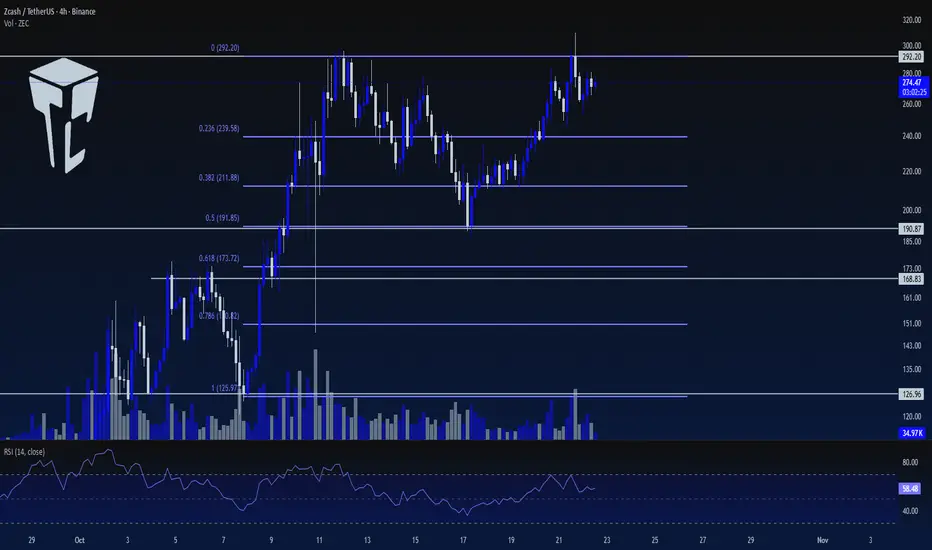
⏳ 4-Hour Timeframe
This coin has a bullish trend on the 4-hour timeframe and, after its upward movement, has now entered a corrective phase.
🔍 This correction has reached the 0.5 Fibonacci level of the previous wave, and the price has now returned to the 292.20 zone, having already reacted to it once.
✔️ Breaking the 292.2 level could mark the beginning of the next bullish wave. From a momentum standpoint, the bullish trend is very strong, and with the breakout of 292.2, the momentum will likely continue.
⚡️ Currently, the volume favors buyers, and as the price approaches the 292.2 zone, buying volume is increasing, which raises the probability of breaking this resistance.
💥 The break of level 70 and the RSI entering Overbuy are strong momentum triggers for a long position.
📊 For a short position on this coin, I’ll wait until a bearish structure forms. The current structure is very bullish, so I’d rather open short positions on other coins.
⭐ We’ll get the confirmation of a bearish reversal only after the price stabilizes below 190.87.
📝 Final Thoughts
Stay calm, trade wisely, and let's capture the market's best opportunities!
This analysis reflects our opinions and is not financial advice.
Share your thoughts in the comments, and don’t forget to share this analysis with your friends! ❤️
Potential ZEC H&S when USDT.D Drops?ZEC has seen strong momentum as the privacy narrative gathers pace.
Market Makers currently playing with the crypto bros so could see some consolidation here. However, many large caps are distributing. Follow the money.
Global Macro has seen capital favour PMs and could we now see a rotation as they consolidate - fast money may favour Crypto again and flow into the space looking for strength.
NFA obvs
MacroCrypto
Bull Case for ZEC: Privacy's Comeback This summary is from grok
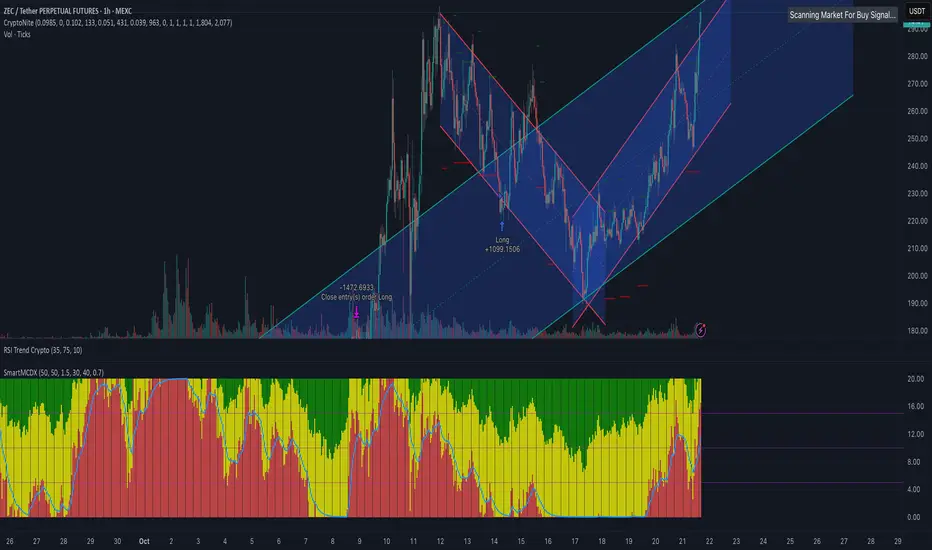
Zcash (ZEC) isn't just another privacy coin—it's the original zk-SNARK pioneer, birthing the zero-knowledge tech that powers everything from Bitcoin rollups to Ethereum's zk-rollups. In October 2025, ZEC has exploded ~250% from its monthly lows, breaking an 8-year downtrend and trading around $252 (as of October 21). This rally isn't hype; it's fueled by real catalysts: the September Zashi CrossPay upgrade enabling seamless shielded cross-chain swaps, surging shielded transaction volumes (up 40% month-over-month), Grayscale's Zcash Trust premium expansion, and positioning ahead of the November halving that slashes block rewards from 3.125 to 1.5625 ZEC. With global privacy demand spiking amid CBDC rollouts and regulatory scrutiny (e.g., MIT research highlighting ZEC's edge over Monero), ZEC is capturing institutional flows—exchanges are even nudging users from XMR to ZEC for compliance. On-chain metrics scream accumulation: smart money loaded at $40-60, and retail inflows hit $250M in the last week alone. Technicals align too—bullish divergences on 4H charts, MACD crossovers, and RSI at 68 (neutral, not overbought). In a bull market where privacy is the ultimate hedge against fiat and surveillance, ZEC could 2-5x by year-end, outpacing BTC's grind.
#### Key Support and Resistance Levels
From the chart you shared, ZEC's ascending channel (blue trendlines) shows price bouncing off the lower boundary (~$229, recent low and 20-day EMA) with a higher low formation, confirming buyer control. The upper channel line caps near $298 (recent high), but volume spikes on greens suggest a breakout push. Here's a breakdown of pivotal levels based on Fibonacci extensions, EMAs, and pivot points:
Strong Support $235-240
Minor Support $225-230
Key Resistance $275-280
Major Resistance $298-300
These levels tie into your chart: the long entry near $229 (green arrow) held as support, while the red descending line (~$275) is the immediate hurdle before the blue upper trendline.
Short-Term Targets (Next 1-4 Weeks, Through November Halving)
Momentum is explosive—ZEC's 63% green days in the last 30 and buyer dominance in spot/futures (per Cumulative Volume Delta) point to continuation. With RSI steady at 58-68 and overbought risks fading post-dip, expect a halving-fueled squeeze. Path: Retest $275, consolidate, then breakout.
- **Base Case: $280-300** (10-20% upside). Measured move from channel breakout adds ~$30-40 from $252; aligns with upper Bollinger Band and R1 pivot. Probability high if BTC stabilizes above $70K.
- **Bull Case: $320-350** (25-40% upside). If shorts cover (leverage ratio 3:1 favoring longs), targets 2.618 Fib at $320, then $350 (Grayscale Trust inflow catalyst). X sentiment echoes this, with calls for $300+ on halving hype.
- **Stretch: $360-382** (40-50% upside). Adam & Eve completion + MACD bull cross; CoinCodex forecasts $383 by Nov 20. Risk: Overbought RSI (if >80) could pull to $240 first.
Trade idea: Long above $255 (channel midline) with stop at $235; partial profits at $280/300.
Long-Term Targets (End of 2025 and Beyond)
ZEC's structure mirrors Gold's 2025 chart—symmetrical triangle breakout with scarcity tailwinds. Halving reduces supply issuance by 50%, while integrations like Router Protocol and Zama's FHE boost utility for shielded swaps across EVM chains. If privacy narratives dominate (e.g., 10% of offshore wealth flows in, per Grayscale thesis), ZEC could capture 0.5-1% of BTC's market cap. X bulls like @TheVladCostea eye $6K (double prior ATH), but conservative models temper this.
- **Base Case: $350-400** (40-60% from now). Averages from DigitalCoinPrice/Changelly; EMA20/50/200 stack (price >$252 >> EMAs at $204/$143/$76) supports uptrend to $388 high.
- **Bull Case: $500-600** (100-140% upside). Javon Marks' extension targets $598 post-$308 break; assumes adoption via Tachyon scaling and $250B+ privacy tx volume. Ties to your RSI trend panel—rising to 75+ signals this leg.
- **Moonshot: $1,000+** (300%+ upside). If ZEC "ZODLs" like BTC (compounding shielded pool privacy), 2030 forecasts hit $1,400. Long-term r:r justifies moon bags, but volatility (52% 30-day) demands diamond hands.
Bottom line: ZEC's bull case is structural—privacy tech + halving scarcity in a world craving anonymity. Your chart's channel holds the key: stay above $235 for the ride. DYOR, markets are wild—position small, let winners run. What's your entry?
Zcash (ZEC) Breakout, Not Rally, Stalled By Big Money BINANCE:ZECUSDT (ZEC) is trading around $250, consolidating after a strong breakout from a bull flag pattern. The structure still looks healthy, with key resistance seen at $284 and $314, while immediate support holds near $247 and $209.
The RSI shows a hidden bullish divergence — price is making higher lows while RSI trends slightly lower, hinting that momentum could soon turn upward again. A confirmed close above $284 would likely resume the rally toward $314 or even $441.
Meanwhile, the Chaikin Money Flow (CMF) has eased from 0.45 to 0.04, suggesting short-term whale profit-taking, but retail accumulation and reduced exchange flows continue to support price stability.
If $247 fails, ZEC could test $209, but holding above current support keeps the bullish bias alive for the next move higher.

Check if 224.47-260.42 can be supported
Hello, fellow traders!
If you "Follow" us, you'll always get the latest information quickly.
Have a great day.
-------------------------------------
(ZECUSDT 1M chart)
You might be wondering why it's rising, but you don't need to know why.
Because it's already rising.
It's a sharp rise, breaking above the important support and resistance area of 56.29-78.91.
The key is whether the price can hold above the Fibonacci 1.618 (338.52) level.
If not, we need to check for support near 220.20, the previous DOM (60) indicator level.
Since the chart was broken by a surge, I believe the next support period is crucial.
-
(1W chart)
The next volatility period is expected to be November 3-23, around the week of November 10.
-
(1D chart)
As mentioned earlier, since the chart was broken by a surge, I think we can calculate the next volatility period based on the next support period.
Until then, we need to see how the price moves after this volatility period, which runs around October 21 (October 20-22).
Looking at the current 1D chart, the HA-High ~ DOM(60) range is forming between 224.47 and 260.42. Therefore, we need to see if it can find support within this range and rise.
If it falls below 220.20, it could fall to around 115.72, so we should consider a response plan.
-
Thank you for reading to the end.
I wish you successful trading.
--------------------------------------------------

$ZEC: From Rebound to Breakout?ZEC’s fundamentals continue to strengthen. Its integration with Router Protocol enhances cross-chain interoperability — a step that bolsters Zcash’s long-term outlook even as privacy adoption remains niche.
Following a sharp pullback, Zcash has rebounded 37% from the $187 demand zone. The move reaffirmed support above the anchored VWAP and marked a breakout from diagonal resistance, signaling improving momentum.
Technically, the $270 zone stands as the next major resistance. A rejection there could lead to a retest of $230 but maintaining price action above $200 — where a short-term consolidation previously formed — the overall structure remains healthy.
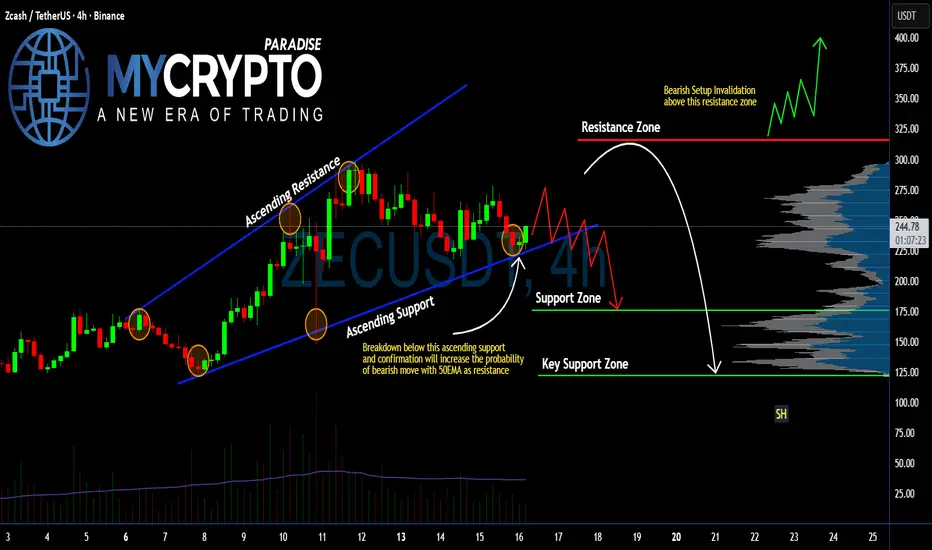
#ZEC Ready to Collapse? Breakdown Here Could Trigger Panic Sell Yello Paradisers! Are you really paying attention to what’s brewing on #ZECUSDT? Because if not, you might be blindsided by what could be a brutal move down. Let's get into the #ZEC setup:
💎#Zcash has been trading inside an Ascending channel, but the momentum is clearly fading. The last bounce off the ascending support was weak, and now we are testing that same ascending support again, but this time, with growing selling pressure.
💎Current price of #ZEC is around $242, and the situation is getting critical. A confirmed breakdown below this ascending support will flip the structure bearish and open up a clean setup toward significantly lower levels. The 50 EMA, which is now acting as dynamic support, will act as resistance. It will only accelerate the downside if this breaks.
💎If this breakdown plays out and is followed by a failed retest of the broken trendline, we could easily see price dump into the Support Zone around $175, and possibly even fall into the Key Support Zone near $121, where stronger buyers may finally step in.
💎On the flip side, the bearish setup is invalidated only if #ZECUSD breaks back above the Resistance Zone at $316. That would shift momentum in favor of the bulls and could spark a sharp rally.
Trade smart, Paradisers. This setup will reward only the disciplined.
MyCryptoParadise
iFeel the success🌴
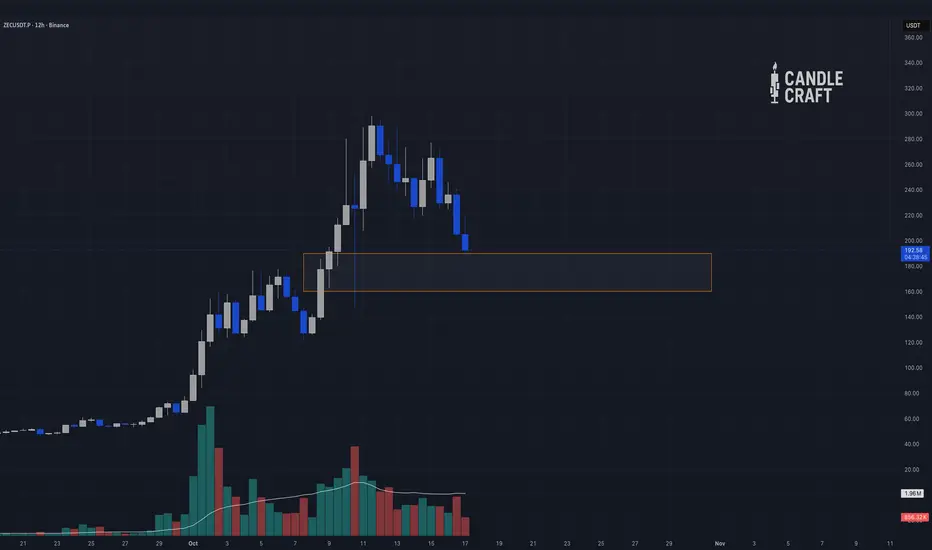
ZECUSDT — The Quiet Strength Nobody’s Talking AboutWhile other altcoins got obliterated back to dust, ZEC quietly refused to die.
Look closer. That massive pump wasn’t random hype — it built on a deep multi-year base, then finally broke through all historical supply like butter. Now we’re simply retesting that breakout zone, not collapsing.
What looks scary on the 12H chart is, on the macro view, just a controlled pullback into a region that’s both structurally sound and psychologically loaded — the orange box between ≈170–190 USDT.
This is the same area where breakout traders took profits and patient hands are now waiting to reload.
This isn’t a dead project gasping for air; it’s one of the few survivors from multiple bear cycles that still holds its macro structure.
While other charts scream exhaustion, this one whispers continuation — if the market holds.
🧩 Our logic:
→ The 2-day and weekly candles both confirm the first proper retest of a long-term breakout.
→ If Bitcoin doesn’t nuke the entire field, ZEC has a clean path to re-establish strength from this base.
→ Ideal strategy: Spot accumulation or ≤5× leverage entries inside the orange box.
Patience is the edge here.
ZEC doesn’t need hype — it just needs time.
And when this thing wakes up again, most traders won’t even realize it’s already halfway gone.
Candle Craft | Signal. Structure. Execution.
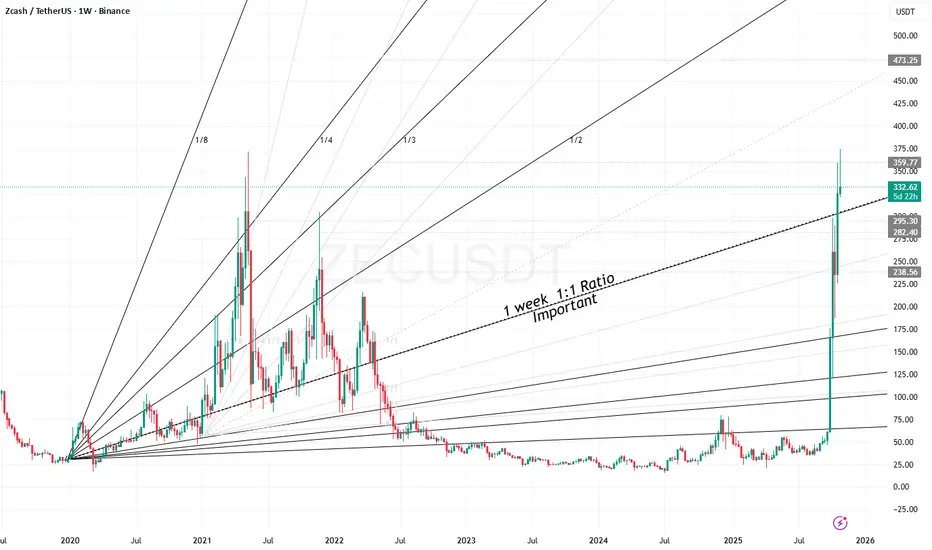
ZEC breakout of multi years resistance !ZEC / USDT
We noticed a Strong move this week
Price broke multi-years resistance line (2024/2022/2020) which is a huge breakout for this coin !
Simple thing , Holding above line = bullish
Invalidation: candle close below it

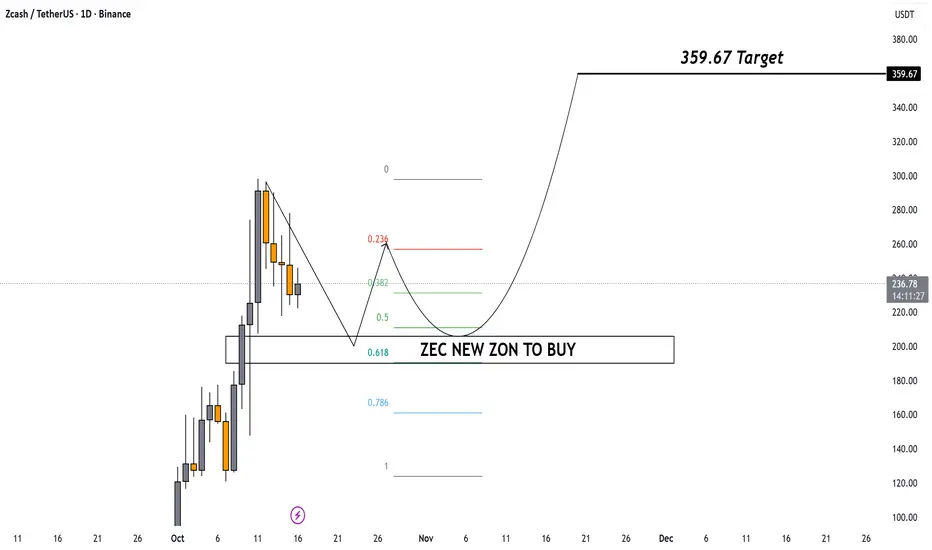
ZEC Strong Bullish Setup Loading
After a sharp rally, ZEC is cooling off — and a perfect buy zone is forming near the 0.5–0.618 Fibonacci levels 👇
🟦 ZEC NEW ZONE TO BUY = Prime entry opportunity before next leg up🚀
Cup & handle structure forming — breakout brewing!
🎯 Target: $359.67