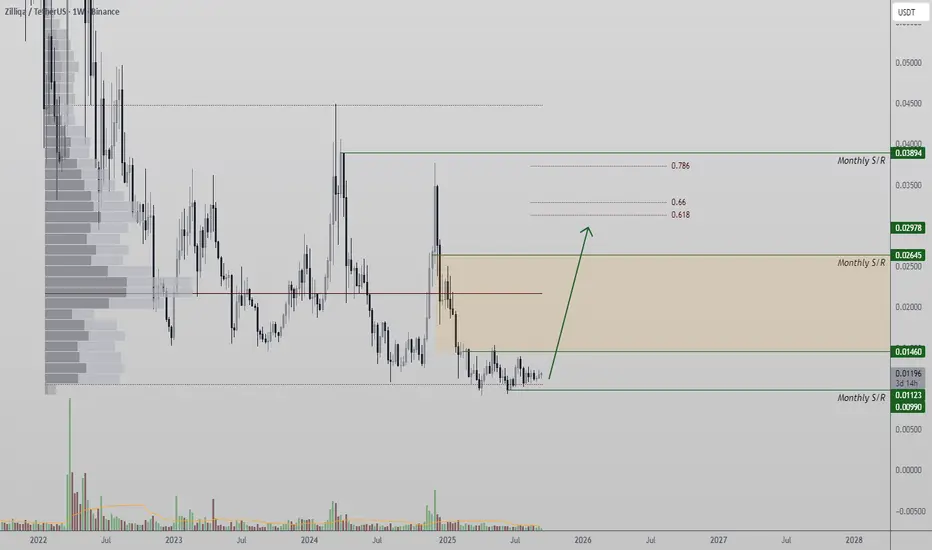
Zilliqa Defends Value Area Low, Accumulation Suggests BreakoutZilliqa has been consolidating around its value area low for a considerable amount of time, repeatedly defending this level. The extended accumulation suggests a potential breakout if supported by bullish volume inflows.
Zilliqa’s price action has remained rangebound but notably resilient. The value area low has acted as a key level of defense, with buyers consistently stepping in to absorb supply. At the same time, the monthly SIP support has been respected, adding further weight to the bullish case.
Key Technical Points
- Value Area Low: Tested and defended multiple times.
- Monthly Support: Strong base for accumulation.
- Explosive Potential: Historical reversals from this level have led to sharp rallies.
Analysis
The repeated defense of support signals accumulation. Buyers appear comfortable absorbing sell pressure at these levels, preventing the market from breaking lower toward deeper supports. This accumulation often precedes strong directional moves, particularly when reinforced by high trading volume.
Zilliqa’s historical price behavior shows that once reversal signals form near this support, price tends to accelerate rapidly. A breakout backed by bullish inflows would likely target higher resistance levels quickly. The volume profile highlights the importance of demand nodes materializing, as without sustained volume, price risks falling back into consolidation.
What to Expect
Zilliqa is poised for an explosive move if accumulation transitions into expansion. Traders should watch for a surge in volume and a confirmed breakout above monthly support, which would validate the bullish setup.
ZILUSDT.P trade ideas
Zilliqa Price Coils as Bollinger Bands Signal Explosive BreakoutZilliqa (ZIL) is consolidating tightly on the weekly timeframe, with compressing Bollinger Bands suggesting an imminent volatility expansion. Bulls are watching for volume confirmation to trigger a move toward the 0.61 Fibonacci retracement zone and higher.
Zilliqa has spent several weeks trading in a narrow consolidation zone, reflecting indecision between buyers and sellers. This sideways structure has resulted in a squeeze on the Bollinger Bands — a classic signal that volatility is set to expand. While momentum has not yet shifted decisively, the technical landscape suggests that an explosive breakout could be imminent.
Key Technical Points
- Weekly Consolidation: ZIL remains range-bound between support and resistance.
- Bollinger Band Squeeze: Tight compression indicates an impending volatility breakout.
- Target at 0.61 Fibonacci: A bullish break may lead toward this key retracement level.
Zilliqa’s current price action is marked by prolonged consolidation on the higher timeframe. The sideways nature of trading reflects the market’s equilibrium phase, where neither bulls nor bears have established dominance. This equilibrium is underscored by the visible compression of the Bollinger Bands, a pattern often followed by sharp expansions.
Historically, Bollinger Band squeezes precede strong directional moves. While the expansion could break either way, the structural bias leans bullish given the underlying support base and broader market resilience. For this move to materialize, however, ZIL requires confirmation through volume — an element that has been notably absent in recent sessions.
Volume has been steadily declining as the consolidation deepens. This lack of participation suggests traders are waiting for a decisive move before committing capital. To confirm a bullish continuation, ZIL will need to attract bullish influxes of volume that sustain momentum. Without this confirmation, any initial breakout risks becoming a false move, trapping traders and forcing a return into consolidation.
The next major technical objective lies around the 0.61 Fibonacci retracement zone. This level represents not only a structural resistance but also a psychological checkpoint where traders will look for continuation or rejection. A clean break toward this zone, backed by volume, could open the door for further upside exploration and a potential change in market sentiment around ZIL.
What to Expect in the Coming Price Action
If ZIL breaks out of its Bollinger Band squeeze with strong volume support, a move toward the 0.61 Fibonacci retracement zone is the most likely scenario. Until then, price may continue to consolidate, but the narrowing volatility window suggests that a decisive move is approaching sooner rather than later.

Ziliqa 1w Zilliqa on the general chart is in a downward trend, but it is clear that we are at the end of the downward trend and the basis for changing the trend to an upward one has begun to form. I believe that it will target the upper leg of the bearish reversal pattern at the $0.03/$0.032 levels, and if it is broken upwards, this means that the trend change has been confirmed and it will target distant targets. It may reach the historical peak or exceed it.

zilusdt short trade just take this trade hope it will hit tp
this is my trade not your trade do your own considerations

#ZIL/USDT#ZIL
The price is moving within an ascending channel on the 1-hour frame, adhering well to it, and is poised to break it strongly upwards and retest it.
We have support from the lower boundary of the ascending channel, at 0.01020.
We have a downtrend on the RSI indicator that is about to break and retest, supporting the upward move.
There is a key support area (in green) at 0.01000, which represents a strong basis for the upward move.
Don't forget one simple thing: ease and capital.
When you reach the first target, save some money and then change your stop-loss order to an entry order.
For inquiries, please leave a comment.
We have a trend of stability above the Moving Average 100.
Entry price: 0.01086
First target: 0.01107
Second target: 0.01137
Third target: 0.01175
Don't forget one simple thing: ease and capital.
When you reach the first target, save some money and then change your stop-loss order to an entry order.
For inquiries, please leave a comment.
Thank you.

#ZIL/USDT Descending channel ?#ZIL
The price is moving within a descending channel on the 1-hour frame and is expected to break and continue upward.
We have a trend to stabilize above the 100 moving average once again.
We have a downtrend on the RSI indicator that supports the upward break.
We have a support area at the lower boundary of the channel at 0.01022, acting as strong support from which the price can rebound.
We have a major support area in green that pushed the price upward at 0.01010.
Entry price: 0.01034
First target: 0.01061
Second target: 0.01097
Third target: 0.01135
To manage risk, don't forget stop loss and capital management.
When you reach the first target, save some profits and then change the stop order to an entry order.
For inquiries, please comment.
Thank you.

Here's the technical analysis of the ZILUSDT 4H chart📈 Possible Scenarios:
🔽 Bearish Scenario (More Likely)
If price pulls back to mid FVG and rejects:
Expect breakdown below SSL (0.01000)
Next target would be LP zone (0.00940)
Potential bullish bounce from this lower level
🔼 Short-Term Bullish Pullback
If price bounces slightly from current level:
Might revisit mid FVG zone (0.01070–0.01090)
But likely to reject again and resume downtrend
✅ Trading Plan
Setup - Entry Zone Target(s) Stop Loss
🔸Short/Sell : Enty zone : 0.01070–0.01090
Tp : 0.01000 → 0.00940
Sl: 0.01110.
🔸Long/Buy: Enty: 0.00940 (LP support)
Tp: 0.01020 → 0.01060
Sl :0.00920
✅ Market is in a clear bearish trend.
Price might aim to collect liquidity below SSL and LP before any major move.
FVG rejection zones are critical; watch price reaction there closely.Patience is key – wait for clean rejection or confirmation.

ZILUSDT 1W Analysis ZIL ~ 1W Analysis
#ZIL If you still have confidence in this coin, maybe you can consider this support to start buying back from here with a short-term target of at least 20%++

#ZIL/USDT#ZIL
The price is moving within a descending channel on the 1-hour frame, adhering well to it, and is on its way to breaking it strongly upwards and retesting it.
We are seeing a bounce from the lower boundary of the descending channel, which is support at 0.01200.
We have a downtrend on the RSI indicator that is about to break and retest, supporting the upward trend.
We are looking for stability above the 100 moving average.
Entry price: 0.01258
First target: 0.01317
Second target: 0.01370
Third target: 0.01430

ZILUSDT: The Sleeping Giant Awakens with a 20% Surge!
📊 Chart Breakdown:
- Current Price: $0.0144
- Volume: 51.96M (Growing interest! 🐋)
- Key Levels:
- Support: $0.014 (Recent bounce zone!)
- Resistance: $0.020 → $0.025 → $0.060 (ATH retest!)
🔥 Creative Analysis:
ZIL just shocked traders with a 20%+ pump, breaking out from its long-term accumulation zone. The 51.96M volume spike suggests this could be the start of a bigger move.
🎯 Big Idea:
"The ZIL Quantum Leap" ⚛️
- Entry: $0.0144 (Aggressive) or $0.0120 (Safe pullback)
- Targets: $0.020 → $0.025 → $0.035 (Mid-term) → $0.06 (ATH retest!)
- Stop Loss: Below $0.0091 (Only for risk-takers!)
💡 Why This Works:
- Oversold Bounce: From $0.0091 to $0.0144 (+58% from lows!)
- Volume Confirmation: 51.96M volume = Real buying pressure
- Narrative Potential: ZIL's tech is undervalued in 2025's blockchain landscape
🚨 Meme-Worthy Twist:
"ZIL isn't just waking up - it's entering HYPERSPACE! 🌠 Miss this launch and you'll be watching from Earth."
📌 Final Thought:
This could be ZIL's comeback story. If it holds $0.014, we might see 2-4x in the coming weeks. The risk/reward here is stellar!
👍 Like & Follow for more high-potential setups! #ZIL #SleepingGiant #AltSeason2025
---
DYOR – this isn't financial advice, it's cosmic-level opportunity spotting! 🪐

ZILUSDT 1D AnalysisZIL ~ 1D Analysis
#ZIL Buy when re -testing this support block or buy after successfully penetrating this resistant line with a short -term target of at least 10%+.

Zilliqa: Your Altcoin Choice (S2)The growth face starts now. Look at it this way, ZILUSDT produced a low in September 2023, less than a year old and this led to a bullish wave. Then in August 2024 there was another major low, 11 months old and this too led to a bullish wave.
We are now in April 2025 and last week ZILUSDT produced another low, this time 8 months old and this one will not lead to a bullish wave. This major low, a new All-Time Low, signals the start of the 2025 bull market. Maximum growth starting today.
A full bullish cycle can take months to develop and sometimes years. That is to say that the market can take its time to grow. At first, we will see some big green candles followed by some retraces that end in a higher low. After 1-2 months, there will be a strong advance and then a correction of medium size, followed by additional growth.
The correction that started in early December 2024 is already over. After a correction, what follows is a bullish impulse. This means long-term growth.
Get ready and be prepared. Prices are good now, the best possible. Buy when prices are low.
Get ready and be prepared because once the action starts there is no going back. Once the first jump is in, low prices will be no more. Look at the STRAXUSDT and GASUSDT publications in my profile for additional information.
» Rest easy and be certain that your Altcoin Choice will grow. Zilliqa is going up. Patience is key, but doubt is zero. 100% certainty.
Thanks a lot for your support.
I hope you enjoy the analysis.
Namaste.

#ZIL/USDT#ZIL
The price is moving within a descending channel on the 1-hour frame, adhering well to it, and is heading for a strong breakout and retest.
We are seeing a bounce from the lower boundary of the descending channel, which is support at 0.00930.
We have a downtrend on the RSI indicator that is about to be broken and retested, supporting the upward trend.
We are looking for stability above the 100 moving average.
Entry price: 0.01030
First target: 0.01075
Second target: 0.01111
Third target: 0.01153

ZIL Descending channelPrice keeps grinding to the downside, forming the green channel.
A break of the channel should lead us first to a test of blue resistance, followed by gray resistance.
Price is showing divergence in smaller timeframes, but this is not enough to consider a reversal.

ZILUSDT 1WZIL ~ 1W Analysis
#ZIL Buy gradually from here if you still have a Conviction on this coin with a short -term target of at least 20%+.

$ZIL is sitting on a strong!GETTEX:ZIL is sitting on a strong long-term support line
Every touch in the past led to a solid move up.
Now back at the same zone — eyes on a potential bounce toward $0.02–$0.03.
Retweet if you're bullish!
#Altcoins #Crypto

Zilusdt swing Quick LongZilusdt is looking good for a long here .
holding the price and it can smash into the resistance and most probably hit the 0.01800.
kinda risky looking at the btc PA but taking it with a tight invalidation.
high Risk Hhigh RR
adding leveraged longs around 0.01300 DCA.
Targeting 0.01800 can be extended too if a pump happened.
tight stops at 01275-80
Note: Not a financial advice

ZILUSDT at a Breaking Point: Deeper Drop or a Surprise Reversal?Yello! Is ZILUSDT about to sink further, or are the bulls preparing for a comeback? The price action is flashing critical signals, and a major move is brewing traders, stay sharp.
💎#Zilliqa remains under heavy bearish pressure, struggling to reclaim the key $0.01503 resistance level. The price is trading below both the 50 and 200 EMAs, reinforcing the downtrend and showing that sellers are still in control. If GETTEX:ZIL fails to hold above the current trendline, it will likely retest $0.01278, where a rejection could send it lower. Until $0.01503 is reclaimed and sustained, the risk of further downside remains high.
💎The next major support sits at $0.01032, where a temporary bounce could occur. This is a crucial level, as it marks a strong historical support zone. However, if selling pressure persists, ZIL could drop further to $0.00879, a key accumulation area where bulls might step in—or where the bearish trend could deepen even further.
💎For the bulls to regain control, it must reclaim $0.01503 and break past the supply zone. A sustained push beyond this level, backed by strong buying momentum, could hint at the start of a trend reversal. However, a true shift in momentum will only be confirmed if ZIL closes above $0.01503, reclaims the 200 EMA, and invalidates the current bearish setup.
Patience is everything, traders. The biggest profits come from waiting for confirmation, not chasing every small move. Play it smart and stay disciplined only the prepared will win in the long run.
MyCryptoParadise
iFeel the success 🌴

ZIL/USDT 1W 🩸 GETTEX:ZIL ⁀➷
#Zilliqa. Macro chart Another
💯 Intermediate Target - $0.051
🚩 Macro Target 1 - $0.071
🚩 Macro Target 2 - $0.110
🚩 Macro Target 3 - $0.161
- Not financial advice, trade with caution.
#Crypto #Zilliqa #ZIL #Investment
✅ Stay updated on market news and developments that may influence the price of Zilliqa. Positive or negative news can significantly impact the cryptocurrency's value.
✅ Exercise patience and discipline when executing your trading plan. Avoid making impulsive decisions driven by emotions, and adhere to your strategy even during periods of market volatility.
✅ Remember that trading always involves risk, and there are no guarantees of profit. Conduct thorough research, analyze market conditions, and be prepared for various scenarios. Trade only with funds you can afford to lose and avoid excessive risk-taking.

ZIL: Awaits a Major MoveIn this analysis, I will be reviewing the ZIL coin, one of the Layer 1 projects primarily focused on payments.
📅 Weekly Timeframe
In the weekly timeframe, we observe a ranging box following the downtrend from the 0.01536 peak. The lower boundary of this range is at 0.01282, while the upper boundary is at 0.03472.
🔍 During Bitcoin’s last bullish move, this coin also bounced from the lower boundary and moved toward the upper boundary. However, as Bitcoin entered consolidation within its own range, this coin started to decline and has now returned to the lower boundary.
💫 If the price establishes itself below the range, we will likely see the next leg of the downtrend and a new bearish trend forming.
📊 However, if the lower boundary provides strong support and holds the price above this area, a move toward the upper boundary—and potentially a breakout—could occur.
⚡️ If the lower boundary is broken, the price target would be 0.03472, and further resistance levels at 0.06017 and 0.15361 could be tested.
📅 Daily Timeframe
In the daily timeframe, we can analyze price movements in more detail. As seen, after reaching the upper boundary of the range and getting rejected, the first bearish leg took the price down to 0.02034. Following a consolidation phase and a brief support at this level, the price broke below and completed the next bearish leg down to the lower boundary.
✨ Currently, market volume has significantly decreased, indicating that a major move is approaching. If the lower boundary is broken, the price may continue its next bearish leg downward.
🔼 For a long position, the first confirmation of a trend reversal would come after a breakout above 0.01635, though this is a high-risk trigger. The main confirmation for trend reversal currently stands at 0.02034.
💥 On the other hand, the key resistance remains at the upper boundary of the range. A breakout above this level would confirm a fully bullish trend.
📝 Final Thoughts
This analysis reflects our opinions and is not financial advice.
Share your thoughts in the comments, and don’t forget to share this analysis with your friends! ❤️

TradeCityPro | ZIL: Awaits a Major Move👋 Welcome to TradeCity Pro!
In this analysis, I will be reviewing the ZIL coin, one of the Layer 1 projects primarily focused on payments.
📅 Weekly Timeframe
In the weekly timeframe, we observe a ranging box following the downtrend from the 0.01536 peak. The lower boundary of this range is at 0.01282, while the upper boundary is at 0.03472.
🔍 During Bitcoin’s last bullish move, this coin also bounced from the lower boundary and moved toward the upper boundary. However, as Bitcoin entered consolidation within its own range, this coin started to decline and has now returned to the lower boundary.
💫 If the price establishes itself below the range, we will likely see the next leg of the downtrend and a new bearish trend forming.
📊 However, if the lower boundary provides strong support and holds the price above this area, a move toward the upper boundary—and potentially a breakout—could occur.
⚡️ If the lower boundary is broken, the price target would be 0.03472, and further resistance levels at 0.06017 and 0.15361 could be tested.
📅 Daily Timeframe
In the daily timeframe, we can analyze price movements in more detail. As seen, after reaching the upper boundary of the range and getting rejected, the first bearish leg took the price down to 0.02034. Following a consolidation phase and a brief support at this level, the price broke below and completed the next bearish leg down to the lower boundary.
✨ Currently, market volume has significantly decreased, indicating that a major move is approaching. If the lower boundary is broken, the price may continue its next bearish leg downward.
🔼 For a long position, the first confirmation of a trend reversal would come after a breakout above 0.01635, though this is a high-risk trigger. The main confirmation for trend reversal currently stands at 0.02034.
💥 On the other hand, the key resistance remains at the upper boundary of the range. A breakout above this level would confirm a fully bullish trend.
📝 Final Thoughts
This analysis reflects our opinions and is not financial advice.
Share your thoughts in the comments, and don’t forget to share this analysis with your friends! ❤️

ZILUSDT: Trend in daily time frameThe color levels are very accurate levels of support and resistance in different time frames, and we have to wait for their reaction in these areas.
So, Please pay special attention to the very accurate trend, colored levels, and you must know that SETUP is very sensitive.
Be careful
BEST
MT
