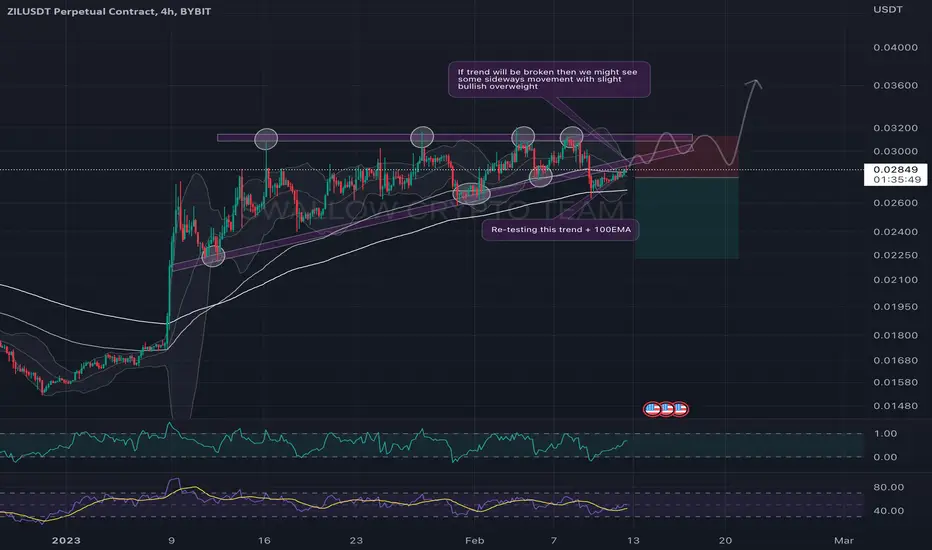
ZIL/USDT going to the retestHey, guys ✌️
ZIL/USDT has been a coin that we wanted to take a look at for some time now. Well after breaking that trend two days ago price fell until the meeting of 200EMA - from there it pushed the price back up and now we are here at the retest of the trend and 100EMA as well.
We are waiting for clean breakout or clean rejection from that trend in order to take any position here. This trend sees strong with 100EMA as a backup there as well. Let's wait and see!
If you like ideas provided by our team you can show us your support by liking and commenting.
Yours Sincerely,
Swallow Team 🔱
Disclamer:
We are not financial advisors. The content that we share on this website are for educational purposes and are our own personal opinions.
ZILUSDT.P trade ideas
Fast long on ZILFast long on ZILUSDT. The idea that we move in the flat channel and now after bottom line will move to up level of this channel. Will see...

$Zil Either wayDoesn't matter wich way it goes
Orders both ways
There's 8% swing to the upside if btc holds 21.5
There's 12% swing to the downside if .026 support fails

Zil 15mins shortI have a short spot of this trade using gartley chances to be weak in this area; entry point with a big candle rejection confirmation

Zilusd longterm view zilUsdt Longterm view on weekly. The wave count only checked on weekly chart looks super interesting. It seems that we have now worked on a peoper wave 1 impuls and on a corrective wave 2. the wace 2 is not yet officially done, but based on the target level, we should be close.
On the daily we have make sure the impuls trend will start to give more likelihood to this idea.
But the potential is definitely interesting.

ZIL AT 4H RESISTANCEZIL is at 4h resistance and trading with low volume which shows bearish signs
DYOR
SHARE TO YOUR FRIENDS IF YOU LOVE MY CHARTS
FOLLOW ON TWITTER

#ZILUSDT 6H Chart
Price is ranging in a rising wedge and it recently got heavily rejected off a 12h supply zone around $0.315. MACD is showing bullish weakness, RSI is bought and EMAs are bullish. I expect price to move down from here towards the 12h demand around $0.025 as a short term target. Waiting for confirmation.

ZIL Ascending Triangle Above TRAMAZil/USDT Create Ascending Triangle on Binance 4h Chart pattern above the Trama
Ascending Triangle
The ascending triangle is a bullish formation that usually forms during an uptrend as a continuation pattern. There are instances when ascending triangles form as reversal patterns at the end of a downtrend, but they are typically continuation patterns. Regardless of where they form, ascending triangles are bullish patterns that indicate accumulation.
Because of its shape, the pattern can also be referred to as a right-angle triangle. Two or more equal highs form a horizontal line at the top. Two or more rising troughs form an ascending trend line that converges on the horizontal line as it rises. If both lines were extended right, the ascending trend line could act as the hypotenuse of a right triangle. If a perpendicular line were drawn extending down from the left end of the horizontal line, a right triangle would form.

zil shortclear sign of reversal in the one minute timeframe. One hour time frame shows major rejection at the point of entry. Stop loss should be set and the highest point before rejection and profit take should be at the end of the reject

My ZILUSDT trade plan for short termMy ZILUSDT trade plan for short term. This is not a financial advice.

#ZILUSDT #LQRUSDT #TOBTC #LaqiraProtocol The price is moving in an upward channel and weakness is observed in the upward trend
Support $0.0255
static resistance $0.031 & dynamic resistance EMA200 Daily at price $0.0317

ZILUSDT Failure and departure from compression rangeFailure and departure from compression range
BREACK OUT TRIANGLE PATTERN
STRONG BUY SIGNAL
ZILUSDT| Wave One| Weekly S/R| Daily S/R| Price Action| Trend Evening Traders,
Today’s analysis – ZILUSDT- trading at and area of resistance where a rejection is plausible,
Points to consider,
- Price action corrective
- Weekly S/R Resistance
- Daily S/R Support
- Impulsive Wave
ZIULUSDT’s immediate price action is trading at a resistance point that is in technical confluence with the POC, Weekly S/R, Int Daily S/R and the .618 Fibonacci, allowing for a potential correction.
The immediate support will be the Daily S/R region, price respecting this rea will allow for completion of Wave Two.
Overall, ZILUSDT is a valid long on the pull back, this will allow for a defined entries, invalidation is multiple candle closes below the Daily S/R Support.
Hope this analysis helps,
Thank you for following my work,
And remember,
“It’s not whether you’re right or wrong that’s important, but how much money you make when you’re right and how much you lose when you‘re wrong.” -George Soros

ZIL/USD SHORTZil on 4h charts RSI divergence, Stoch Rsi losing momentum and rejecting of resistance. Expecting to break down the trend line and go down.


model seems to think its more likely longwe retest highs before going down any. Ive ran other models that show a bigger drop first but ultimately we retest the highs.

LONG ZILUSDT ZILUSDT WILL GO .02800 WITHOUT STOP
IN 10× LEVERAGE YOUR WORKING CAPITAL WILL GROW 300% FROM THIS LEVEL
1st target .02572
2nd target. .02750
3rd target .02820

ZILUSDT Analysis - 11 JANUARY 2023Hello Guys, Today's Analysis is on the ZILUSDT Symbol in a 1H Time frame, I Hope it Will be Useful for You, Don't Forget to Like, Follow, Comment


Is it Bulls' Time for ZIL?Looking at the daily chart of ZIL/USDT, the ZIL price was swinging from $0.01541 to $0.03426 within the past 30 days after going to its lowest of the month at $0.01541.
Bouncing back from the support level, ZIL is trading in the previous order block formed on 08 November 2022. If ZIL is able to break out of the order block and rises higher, we can expect ZIL to reach $0.05.
Meanwhile, our long-term ZIL price prediction for 2023 is bullish if it cannot break the support level. We can expect ZIL to reach $0.06 this year.
If ZIL cannot break the $0.03047 resistance 1 level, the bears may seize control and dethrone ZIL to a downtrend stance. In simple terms, the price of ZIL might fall to almost $0.01621, indicating a negative signal from the previous support level.

ZILUSDT TO MOONZILUSDT WILL BLAST SOON
10× LEVERAGE
MINIMUM 5% UP MOVE
U can see my previous idea as well


