ZIL : A Trade ideaZilliqa (ZIL/H1)
#ZIL is already down by 42% Since the recent pump and is consolidating inside a falling wedge. Will long some #ZIL if the Conditions happen :
1 - Downtrend line gets broken upwards📈
2 - Super trend indicator gives "Buy" Signal in the 1H Chart.📈
ZILUSDT.P trade ideas

ZIL - further confirmationZIL - further confirmation for this small Diamond Bottom pattern,
Pray we heading up soon <3
DIAMOND HAND!

ZIL - is there any diamond within diamond bottom pattern ? xDWhat you think guys ?
i just come across that this diamond bottom pattern that often seen in BTC chart,
what if ZIL forming this ? possible ?

ZILLIQA IS READY TO GO HIGHER Picture is clear with all detail. after hard correction, zilliqa ready to higher, and now best moment for buy. We can sell In 3 step but my target is last white line.

ZIL/USDT - Upcoming Reversal ZIL has pulled back and is in a sharp descending triangle. I would wait to see the breakout of the the top of the triangle resistance and confirm the retest the top line as support before putting in a long position.
This is not Financial Advice. This is simply an idea of chart patten recognition I will be using to compare in the future. Do your own research and practice proper risk management. Good luck to all.
More information of descending triangles:
www.investopedia.com

Zilliqa to 10c or ?Could we see 10c or above 14c? NFA I'm willing to bet that it's 10c trending downward. Let's see and find out $zil #zilliqa #zilfam

Ziliqa are we stopping ?We should not panic as for now, ZIL currently is still holding at the 0.382 up trend fib channel, looking forward for the bounce back <3
shorter should have good profit for now, let's give ZIL supporter a break.
overall is down -41% from ATH, but still positive toward long at this level ,
HOLD, DCA, Do not play high leverage :)

ZilusdtZiliqa Technical Analysis basically on elliott waves Principles and Priceaction Strategy
Zil can be 0.45$ very good opp to buy in 0.11$ and waiting for 0.45$ Price level
Wait and Watch.


longs are taking profitsis a bearish trend channel, targeting local and extremes supports now before a potential bounce.
targets: .142-.098-.053

Zil overall, my quick analysis.Zil has entered the bear market. If Zil wants to be on track again
this token needs to stay on top of a purple dash line. Otherwise, it will sideway down
to retest the last support.
At the moment, for me, it is not very interesting to buy. Should wait for the market to push it back above purple
dash line.


Zil Heading for previous high.Wait til 0.1 before buying back.
Zil is retracing back to the top of Wave 1.
Once it reaches there, we should be expecting Wave 5 moving to the upside around 0.3

ZilLU Buy OpportunityZilu can break all time high, Buy on Breakout
Condition Bitcoin must consolidate or go LOng

ZILLIQA DUMPET -20%Shorting ZIL down to REDLINE on VPVR in a shorted around $0.17 flipping long at $0.11 area
LIKE FOLLOW

Cup & Handle FormationHey all,
Here's my analysis on Ziliqa after forming a Cup & Handle on the hourly chart, it seems heading towards the 61.8 Fib. and if it bounces up and break the handle we might see another gain toward $0.24. and if the downtrend continues then it will reach to $0.126 and lower
Disclaimer: This is my personal opinion and not a financial advice. DYOR!!

$ZIL- On A Retracement$ZIL gave quite a helluva run.
You have got to Be patient for it to touch that rebuy zone or or you DCA from here!

ZIL/USDT wait for trigger to long!Waiting for an approach to the 0.126-0.132 region to see the price reaction. If we see a break in the down trend we can long. Alternatively we may see a turn around at current levels however i see ZIL heading down to the 0.12 support region.
Longs targeting the 0.26 region on a follow through surge in the price if the market reacts positively.
Not financial advice, just my view on current trends.
Have a great trading day ahead of you!

ZILBINANCE:ZILUSDTPERP
All the targets Entry price and stop loss has been market main trend line while the descending triangle pattern has been found

ZILUSDT LONG TRADE PLANLong signal for ZILUSDT.
Using this strategy:https://www.tradingview.com/script/nmmhJkAg-Sentiment-by-JDG-v5-0/
Use for 1 hour tf only

ZILLIQA what is next 💡Based on the chart after long time, we can see appropriate amount of volume for the price and sharp candlesticks ✔️
if
this volume continues, and the price stays above the support area, we will see more gain 🚀
before
more gain, we can see brief correction to the downside (close to our Fibonacci levels support zone)
if
the price breaks the support area here to the downside, we will see more correction ❌🧨
Please, feel free to ask your question, write it in the comments below, and I will answer.🐋
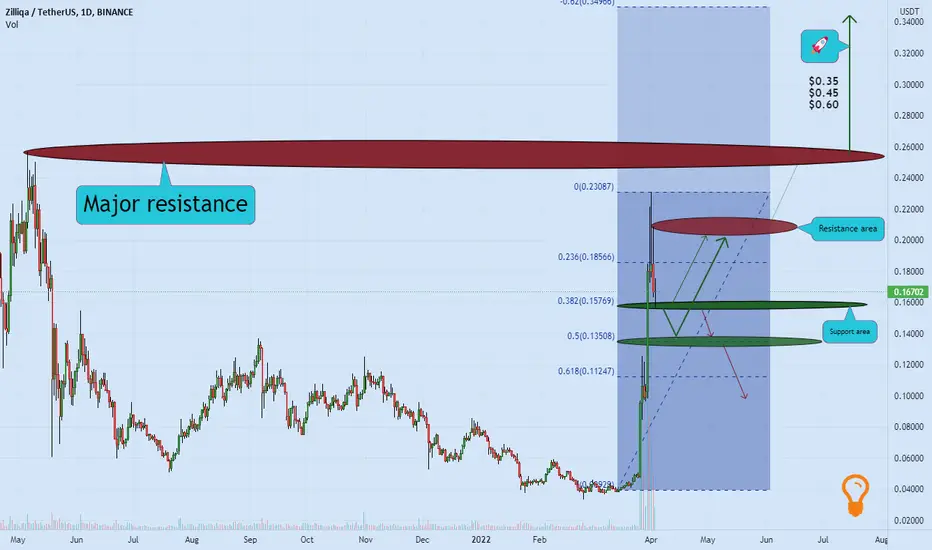

ZIL BULLZil shows a resistence in past few hours and waiting for a pump of other coins to get back to 0.20.
