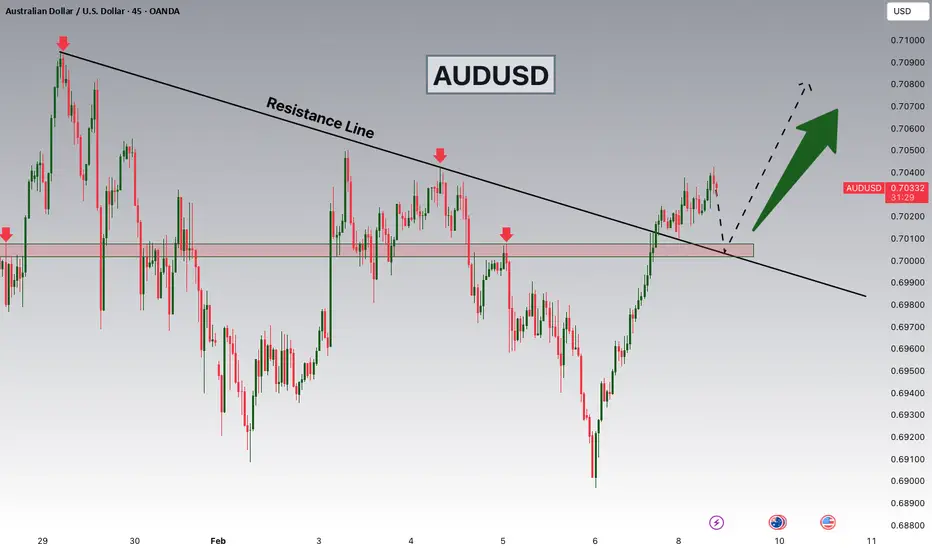
AUDUSD Breakout and Potential RetraceHey Traders, in today's trading session we are monitoring AUDUSD for a buying opportunity around 0.70000 zone, AUDUSD was trading in a downtrend and successfully managed to break it out. Currently is in a correction phase in which it is approaching the retrace area at 0.70000 support and resistance
Australian Dollar / U.S. Dollar
No trades
About Australian Dollar / U.S. Dollar
The Australian Dollar and the US Dollar pair belong the Majors, a group of the most popular traded pairs in the world. This pair's popularity soared because traders were attracted to the interest rate differential of the pair. This has waned in recent years due to economic volatility worldwide.
Related currencies
AUDUSD Rally Into Sell Zone | Strong Dollar Theme Returns!Hey Traders,
In today’s trading session we are monitoring AUDUSD for a potential selling opportunity around the 0.70200 zone.
AUDUSD remains in a clear downtrend and is currently in a corrective pullback, approaching a confluence resistance area near 0.70200, where the descending trendline aligns

AUD-USD Free Signal! Sell!
Hello,Traders!
AUDUSD reacts from a well-defined horizontal supply area after a strong bullish push. Rejection and bearish displacement indicate smart money distribution, favoring continuation toward lower liquidity.
--------------------
Stop Loss: 0.7024
Take Profit: 0.6984
Entry: 0.7017
Time Fr

AUDUSD Will Go Down! Short!
Take a look at our analysis for AUDUSD.
Time Frame: 4h
Current Trend: Bearish
Sentiment: Overbought (based on 7-period RSI)
Forecast: Bearish
The market is testing a major horizontal structure 0.697.
Taking into consideration the structure & trend analysis, I believe that the market will reach 0


AUD/USD | Going higher after BSL sweep? (READ THE CAPTION)By analysing the hourly chart of AUDUSD we can see that it barely failed to touch and sweep the liquidity pool above 0.7094 level, and it's being traded at 0.7090 at the moment. I expect liquidity sweep to happen relatively soon, and then a drop in price.
Targets for AUDUSD after the liquidity sweep

Technical Pullback or Early Signs of Trend Weakness?Hello everyone, let’s take a look at AUDUSD on the H4 timeframe.
After a fairly smooth and extended rally, AUDUSD has entered a clear corrective phase. Price has slipped below the fast EMA, while the medium-term EMA — the level that previously supported the entire uptrend — is now being tested but

AUDUSD: Upward Support And ResistanceHi everyone,
AUDUSD is in uptrend momentum move of support and resistance, the pair have been scaling on bullish rise, for a long time now, with the formation of higher highs, higher lows and support and resistance. price is presently at the resistance zone, in respect of the structure. we anticipa

AUDUSD Will Fall From ResistanceHello Traders
In This Chart AUDUSD HOURLY Forex Forecast By FOREX PLANET
today AUDUSD analysis 👆
🟢This Chart includes_ (AUDUSD market update)
🟢What is The Next Opportunity on AUDUSD Market
🟢how to Enter to the Valid Entry With Assurance Profit
This CHART is For Trader's that Want to Improve Their Te

AUDUSD Weekly Smart Money Map As Liquidity Shifts Control Price AUDUSD has completed a strong impulsive expansion from the accumulation base and is now transitioning into a distribution–rebalancing phase.
The current price action shows Smart Money shifting from aggressive markup into controlled liquidity rotation, with price respecting clear premium and discount

See all ideas
Summarizing what the indicators are suggesting.
Oscillators
Neutral
SellBuy
Strong sellStrong buy
Strong sellSellNeutralBuyStrong buy
Oscillators
Neutral
SellBuy
Strong sellStrong buy
Strong sellSellNeutralBuyStrong buy
Summary
Neutral
SellBuy
Strong sellStrong buy
Strong sellSellNeutralBuyStrong buy
Summary
Neutral
SellBuy
Strong sellStrong buy
Strong sellSellNeutralBuyStrong buy
Summary
Neutral
SellBuy
Strong sellStrong buy
Strong sellSellNeutralBuyStrong buy
Moving Averages
Neutral
SellBuy
Strong sellStrong buy
Strong sellSellNeutralBuyStrong buy
Moving Averages
Neutral
SellBuy
Strong sellStrong buy
Strong sellSellNeutralBuyStrong buy
Displays a symbol's price movements over previous years to identify recurring trends.
Frequently Asked Questions
The current rate of AUDUSD is 0.70508 USD — it has decreased by −0.10% in the past 24 hours. See more of AUDUSD rate dynamics on the detailed chart.
The value of the AUDUSD pair is quoted as 1 AUD per x USD. For example, if the pair is trading at 1.50, it means it takes 1.5 USD to buy 1 AUD.
The term volatility describes the risk related to the changes in an asset's value. AUDUSD has the volatility rating of 0.76%. Track all currencies' changes with our live Forex Heatmap and prepare for markets volatility.
The AUDUSD showed a 2.22% rise over the past week, the month change is a 6.00% rise, and over the last year it has increased by 12.25%. Track live rate changes on the AUDUSD chart.
Learn how you can make money on rate changes in numerous trading ideas created by our community.
Learn how you can make money on rate changes in numerous trading ideas created by our community.
AUDUSD is a major currency pair, i.e. a popular currency paired with USD.
Currencies are usually traded through forex brokers — choose the one that suits your needs and go ahead. You can trade AUDUSD right from TradingView charts — just log in to you broker account. Check out the list of our integrated brokers and find the best one for your needs and strategy.
When deciding to buy or sell currency one should keep in mind many factors including current geopolitical situation, interest rates, and other. But before plunging into a deep research, you can start with AUDUSD technical analysis. The technical rating for the pair is buy today, but don't forget that markets can be very unstable, so don't stop here. According to our 1 week rating the AUDUSD shows the buy signal, and 1 month rating is buy. See more of AUDUSD technicals for a more comprehensive analysis.