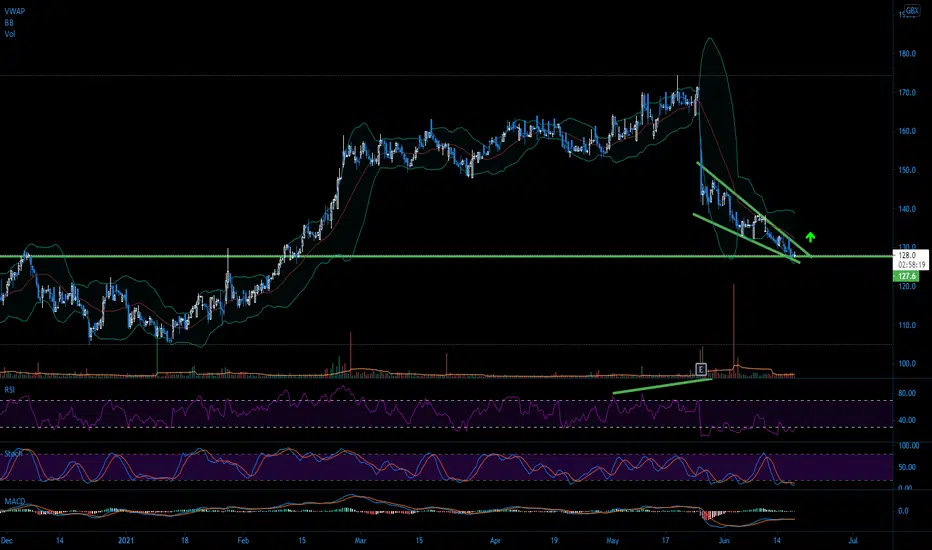
GREENCORE Possible reversal $GNC
#GREENCORE testing 4H support possible reversal soon.
good opportunity for long
Next report date
—
Report period
—
EPS estimate
—
Revenue estimate
—
0.0 GBP
46.30 M GBP
1.81 B GBP
417.62 M
About Greencore Group Plc
Sector
Industry
CEO
Dalton Timothy Philips
Website
Headquarters
Dublin
Founded
1991
ISIN
IE0003864109
FIGI
BBG000BS3YL4
Greencore Group Plc engages in the manufacture and supply of convenience foods. The company also involves in the Irish Ingredient trading businesses. Its products include sandwiches, salads, sushi, chilled ready meals, chilled soups and sauces, chilled quiche, ambient sauces and pickles, frozen Yorkshire puddings, cakes, and desserts. The company was founded in 1991 and is headquartered in Dublin, Ireland.
Related stocks

Summarizing what the indicators are suggesting.
Neutral
SellBuy
Strong sellStrong buy
Strong sellSellNeutralBuyStrong buy
Neutral
SellBuy
Strong sellStrong buy
Strong sellSellNeutralBuyStrong buy
Neutral
SellBuy
Strong sellStrong buy
Strong sellSellNeutralBuyStrong buy
An aggregate view of professional's ratings.
Neutral
SellBuy
Strong sellStrong buy
Strong sellSellNeutralBuyStrong buy
Neutral
SellBuy
Strong sellStrong buy
Strong sellSellNeutralBuyStrong buy
Neutral
SellBuy
Strong sellStrong buy
Strong sellSellNeutralBuyStrong buy
Displays a symbol's price movements over previous years to identify recurring trends.
Frequently Asked Questions
The current price of GNC is 242.0 GBX — it has decreased by −0.41% in the past 24 hours. Watch Greencore Group Plc stock price performance more closely on the chart.
Depending on the exchange, the stock ticker may vary. For instance, on LSE exchange Greencore Group Plc stocks are traded under the ticker GNC.
GNC stock has risen by 2.33% compared to the previous week, the month change is a −1.22% fall, over the last year Greencore Group Plc has showed a 10.00% increase.
We've gathered analysts' opinions on Greencore Group Plc future price: according to them, GNC price has a max estimate of 300.00 GBX and a min estimate of 185.00 GBX. Watch GNC chart and read a more detailed Greencore Group Plc stock forecast: see what analysts think of Greencore Group Plc and suggest that you do with its stocks.
GNC stock is 2.29% volatile and has beta coefficient of 0.80. Track Greencore Group Plc stock price on the chart and check out the list of the most volatile stocks — is Greencore Group Plc there?
Today Greencore Group Plc has the market capitalization of 1.05 B, it has increased by 0.67% over the last week.
Yes, you can track Greencore Group Plc financials in yearly and quarterly reports right on TradingView.
Greencore Group Plc is going to release the next earnings report on Nov 18, 2025. Keep track of upcoming events with our Earnings Calendar.
GNC net income for the last half-year is 19.80 M GBP, while the previous report showed 34.80 M GBP of net income which accounts for −43.10% change. Track more Greencore Group Plc financial stats to get the full picture.
Greencore Group Plc dividend yield was 1.09% in 2024, and payout ratio reached 19.86%. The year before the numbers were 0.00% and 0.00% correspondingly. See high-dividend stocks and find more opportunities for your portfolio.
As of Oct 16, 2025, the company has 13.3 K employees. See our rating of the largest employees — is Greencore Group Plc on this list?
EBITDA measures a company's operating performance, its growth signifies an improvement in the efficiency of a company. Greencore Group Plc EBITDA is 171.30 M GBP, and current EBITDA margin is 8.80%. See more stats in Greencore Group Plc financial statements.
Like other stocks, GNC shares are traded on stock exchanges, e.g. Nasdaq, Nyse, Euronext, and the easiest way to buy them is through an online stock broker. To do this, you need to open an account and follow a broker's procedures, then start trading. You can trade Greencore Group Plc stock right from TradingView charts — choose your broker and connect to your account.
Investing in stocks requires a comprehensive research: you should carefully study all the available data, e.g. company's financials, related news, and its technical analysis. So Greencore Group Plc technincal analysis shows the buy rating today, and its 1 week rating is strong buy. Since market conditions are prone to changes, it's worth looking a bit further into the future — according to the 1 month rating Greencore Group Plc stock shows the buy signal. See more of Greencore Group Plc technicals for a more comprehensive analysis.
If you're still not sure, try looking for inspiration in our curated watchlists.
If you're still not sure, try looking for inspiration in our curated watchlists.