How to Use VWAP in Confluence with StructureVWAP is one of the few indicators that consistently adds value when used correctly. It does not predict direction and it does not replace market structure, but it provides a powerful reference point for where fair value sits within the current session or trend.
When combined with structural analys
Bitcoin’s Next Move Starts Here Key Levels MappedBTC is currently in a technically critical phase. Price is trading below a major dynamic trendline resistance after a confirmed bearish break, keeping the broader structure corrective rather than impulsive. Momentum remains capped unless bulls reclaim key dynamic levels.
The plan from here is stra

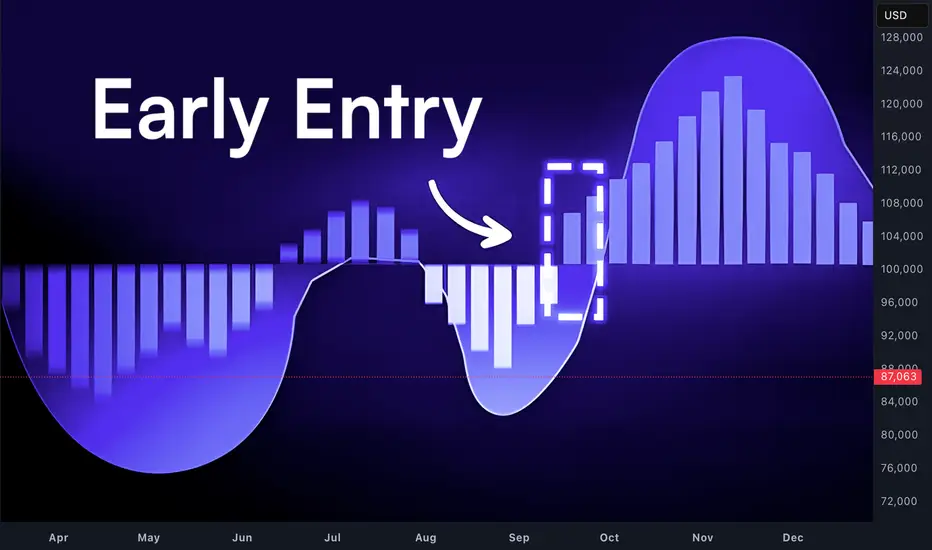
BTCUSD Holds Triangle Support - Bounce Toward 88,500 ExpectedHello traders! Here’s my technical outlook on BTC/USD based on the current chart structure. After a prolonged bearish move inside a downward channel, Bitcoin found a base near the lower boundary and reversed sharply, signaling seller exhaustion and a shift in momentum. This reversal was followed by

| This Chart Shows How We Look at BTC Halving & Market Cycles | This chart shows how we look at BTC halvings and market cycles. Every cycle follows a similar structure — accumulation, expansion, distribution, reaccumulation — but the way it plays out is never the same. That’s the key part most people miss.
Yes, around 539 days have already passed since the last

BITCOIN 'From Denial of the Bear Cycle to Bitcoin going to 0'We've been showing you since September why Bitcoin (BTCUSD) was structured to start a new Bear Cycle in October, mostly based on the very accurate 4-year Cycle Theory. Recently we've published analyses of the last indicators that practically confirmed that the market has already entered this Bear Cy

Hey guys guess what !!! $BTC is strong !!!If we pump this we break out of a long down trend. If you look to the left we have a similar structure that broke out the same way.
Do you think we can see history repeat it self ?
Comment like and share for more charts.
(If you need me to draw something up for you comment bellow)

The Language of Price | Lesson 1 – Candlestick TheoryLesson Focus: Candlestick Types (Theory)
This post introduces the basic concept of candlesticks and how price behavior is visually represented on a chart.
Candlesticks are one of the most fundamental tools in market structure analysis, as they reflect price movement, momentum, and market parti

Elise | BTCUSD – 30M – Compression Below Major SupplyBITSTAMP:BTCUSD
After a strong impulsive rally from the HTF demand zone (~86.8K), BTC transitioned into consolidation while respecting trend support. Multiple reactions from the trendline (purple circles) confirm buyer presence. However, upside progress is slowing as price meets heavy sell-side li

Bitcoin: Won't Break Support, Back To 95K?Bitcoin continues to maintain the broader support around the low 80Ks. While this formation appears to be a lower high consolidation (bearish), it could also be the key inflection point for a reversal back into a bullish structure. This possibility aligns with the broader bullish trend which is stil

Japan just sent a warning most Bitcoin traders are missing!Hey @TradingView Community,
Japan just sent a signal most traders are overlooking
Let me explain
The Bank of Japan is preparing to raise interest rates toward 0.75%
Levels not seen in decades
On the surface, it looks insignificant but In reality, it impacts global liquidity
For years, Japan ha

See all ideas
Summarizing what the indicators are suggesting.
Oscillators
Neutral
SellBuy
Strong sellStrong buy
Strong sellSellNeutralBuyStrong buy
Oscillators
Neutral
SellBuy
Strong sellStrong buy
Strong sellSellNeutralBuyStrong buy
Summary
Neutral
SellBuy
Strong sellStrong buy
Strong sellSellNeutralBuyStrong buy
Summary
Neutral
SellBuy
Strong sellStrong buy
Strong sellSellNeutralBuyStrong buy
Summary
Neutral
SellBuy
Strong sellStrong buy
Strong sellSellNeutralBuyStrong buy
Moving Averages
Neutral
SellBuy
Strong sellStrong buy
Strong sellSellNeutralBuyStrong buy
Moving Averages
Neutral
SellBuy
Strong sellStrong buy
Strong sellSellNeutralBuyStrong buy
Displays a symbol's price movements over previous years to identify recurring trends.
Curated watchlists where BTCUSD.P is featured.

Gen 1 crypto: from little acorns grow
15 No. of Symbols

Proof of Work: Embracing the crunch
27 No. of Symbols
See all sparks