We’ve introduced a powerful set of per share metrics to the Stock Screener and symbol pages — designed to help you compare companies more accurately. Let’s see what data you can add to your fundamental analysis to maximize it.
Why per share metrics matter
Per share metrics let you evaluate companies regardless of their size. They highlight a business’s efficiency, its attractiveness to shareholders, and its financial flexibility.
Take free cash flow (FCF) per share as an example. This metric shows how much free cash flow (the funds left after capital expenditures) is attributable to each share. It’s an important metric for understanding a company’s ability to finance dividends, buy back shares, or reduce debt without relying on external funding.
Imagine you’re comparing two energy companies — one large, one mid-sized. Both may generate similar amounts of free cash flow in absolute terms, but the smaller company could have a higher free cash flow per share.
| Metric | Larger company | Smaller company |
| Free cash flow, in millions $ | 1,000 | 500 |
| Shares, in millions | 200 | 50 |
| Free cash flow per share, $ | 5 | 10 |
| Stock price, $ | 50 | 40 |
| Yield (FCF‑yield), % | 10% | 25% |
In the example above, the mid-sized company generates twice the FCF per share, delivers a significantly higher FCF yield, and creates greater returns for shareholders.
Now, let’s see what other metrics are available and how they help with your analysis.
| Revenue per share | Revenue attributable to each share, ideal for comparing businesses of different sizes and their efficiency within a sector. |
| Operating cash flow per share | Cash flow from operations per share, showing how well reported profits are backed by real cash inflows. |
| Free cash flow per share | Shows the amount remaining after capital expenditures. Used to assess a company’s ability to finance dividends, share buybacks, or debt reduction. |
| EBIT per share | Operating profit before interest and taxes per share. Helps to evaluate operational performance without tax/debt effects. |
| EBITDA per share | Earnings before interest, taxes, depreciation, and amortization per share. This is used to assess operating profitability, especially in capital-intensive industries. |
| Book value per share | Net asset value per share based on the balance sheet. This is useful for evaluating fundamental value and identifying potentially undervalued stocks. |
| Total debt per share | Total company debt allocated per share. It’s helpful for analyzing financial stability and comparing debt levels between companies. |
| Cash per share | Cash and equivalents per share. Helps to gauge liquidity and reserves available to cover short-term liabilities. |
| Net current asset value per share | Shows the difference between current assets and current liabilities per share. Used in deep value analysis to identify stocks trading below the value of their liquid assets. |
| Tangible book value per share | Tangible assets (excluding intangibles) per share. This provides a conservative view of residual business value. |
| Working capital per share | Reflects the difference between current assets and liabilities. Helps assess a company’s ability to cover short-term obligations and maintain stable operations. |
| CapEx per share | Capital expenditures per share; used to assess growth strategies and investment activity. |
Half-year reporting and new columns
We’ve also added half-year as a reporting period for key financial metrics. This value sums the last two consecutive quarterly figures, making it especially useful for analyzing companies with non-standard reporting schedules — often found outside the U.S.
For the sake of transparency and clarity, two new columns have been added:
- Fiscal period end — the date marking the end of the reporting period for which the company prepares its financial statements. For example, June 30, 2025, would be the specific end date of a reporting period.
- Fiscal period — indicates the company’s reporting period to which the financial statements apply, such as Q2 2025, H1 2025, or FY 2024. This helps identify exactly which period the metrics correspond to.
These new columns give clarity on the reporting period behind each metric, so cross-company comparisons are easier and more accurate.

The Stock Screener now supports the following reporting periods:
- Quarterly
- Half-year
- Annual
- TTM (trailing twelve months)

How to use the new metrics
In the Stock Screener, you can simply add per share metrics as columns or filters.
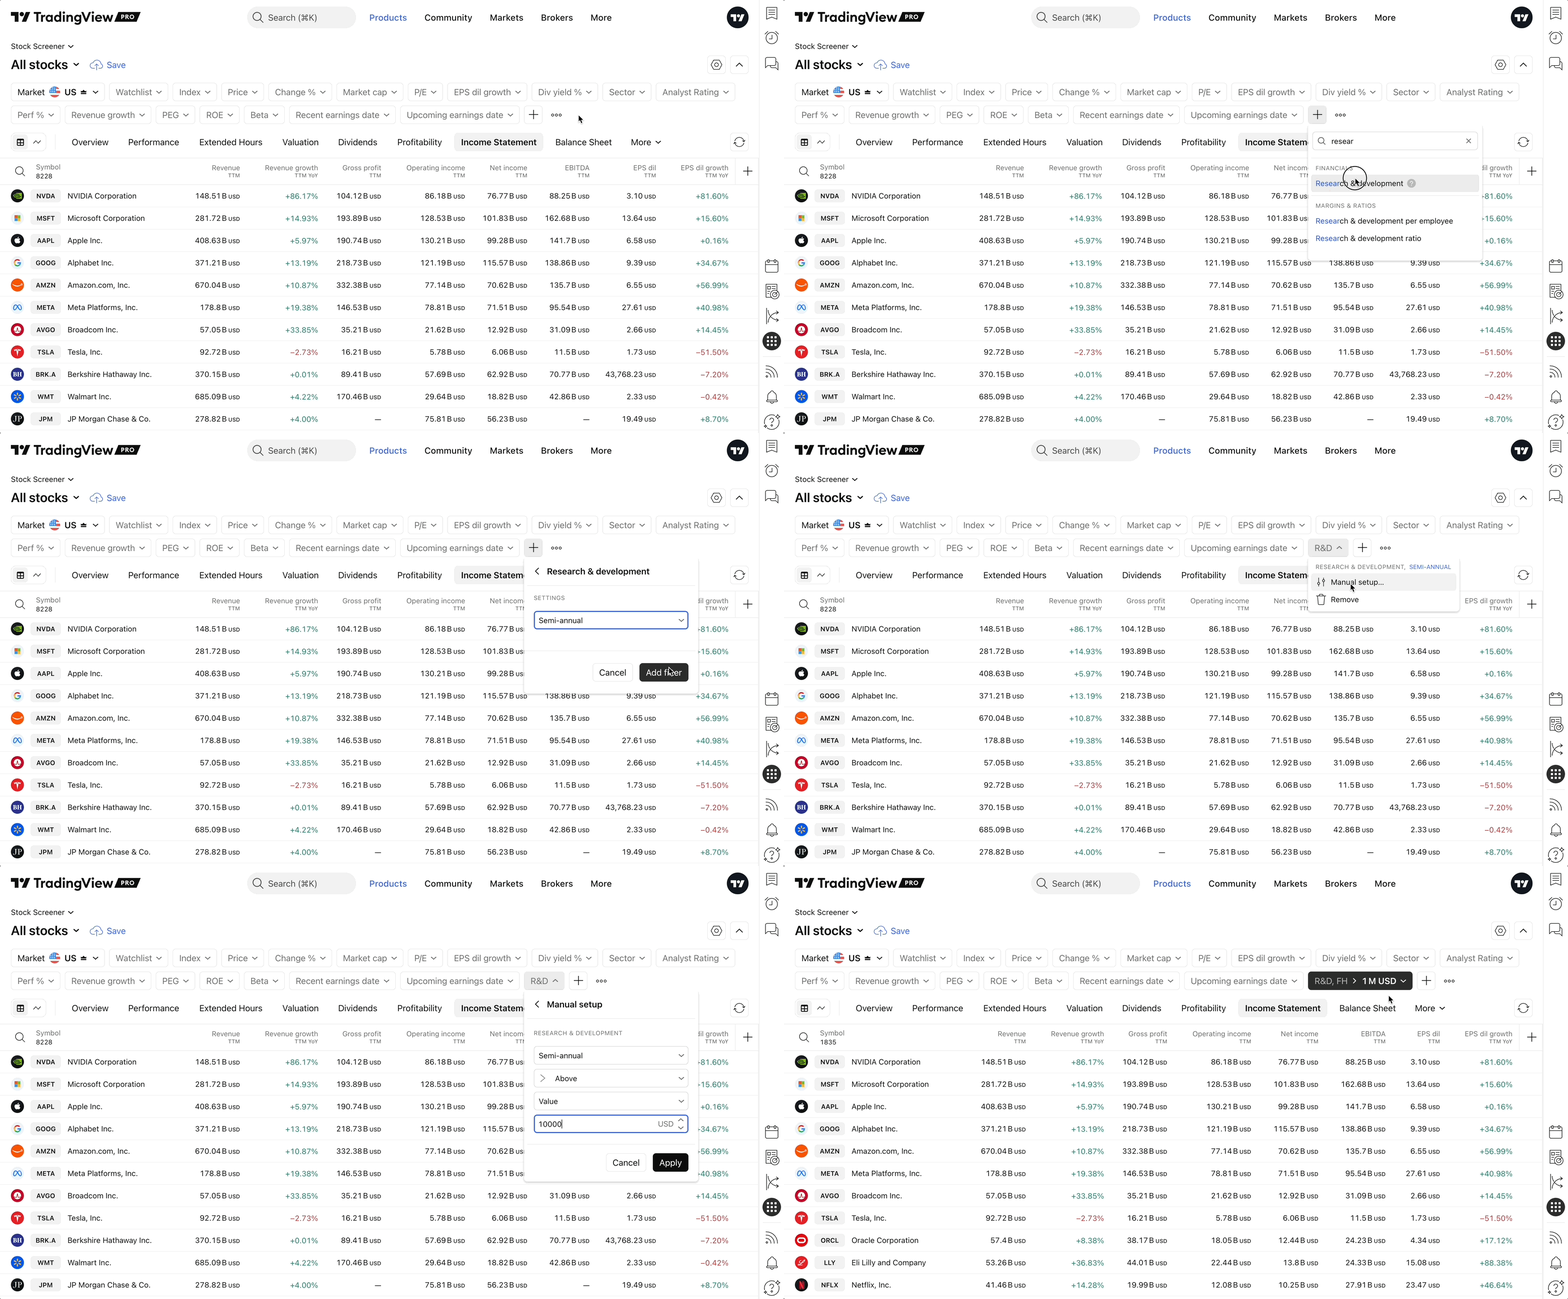
To add a filter, click the + button or press Shift + F on Windows and Mac devices in the top panel, then choose your desired metric. Then select the required reporting period. After adding the filter, you can customize it: select Manual setup from the filter drop-down list and enter your specific filter conditions.

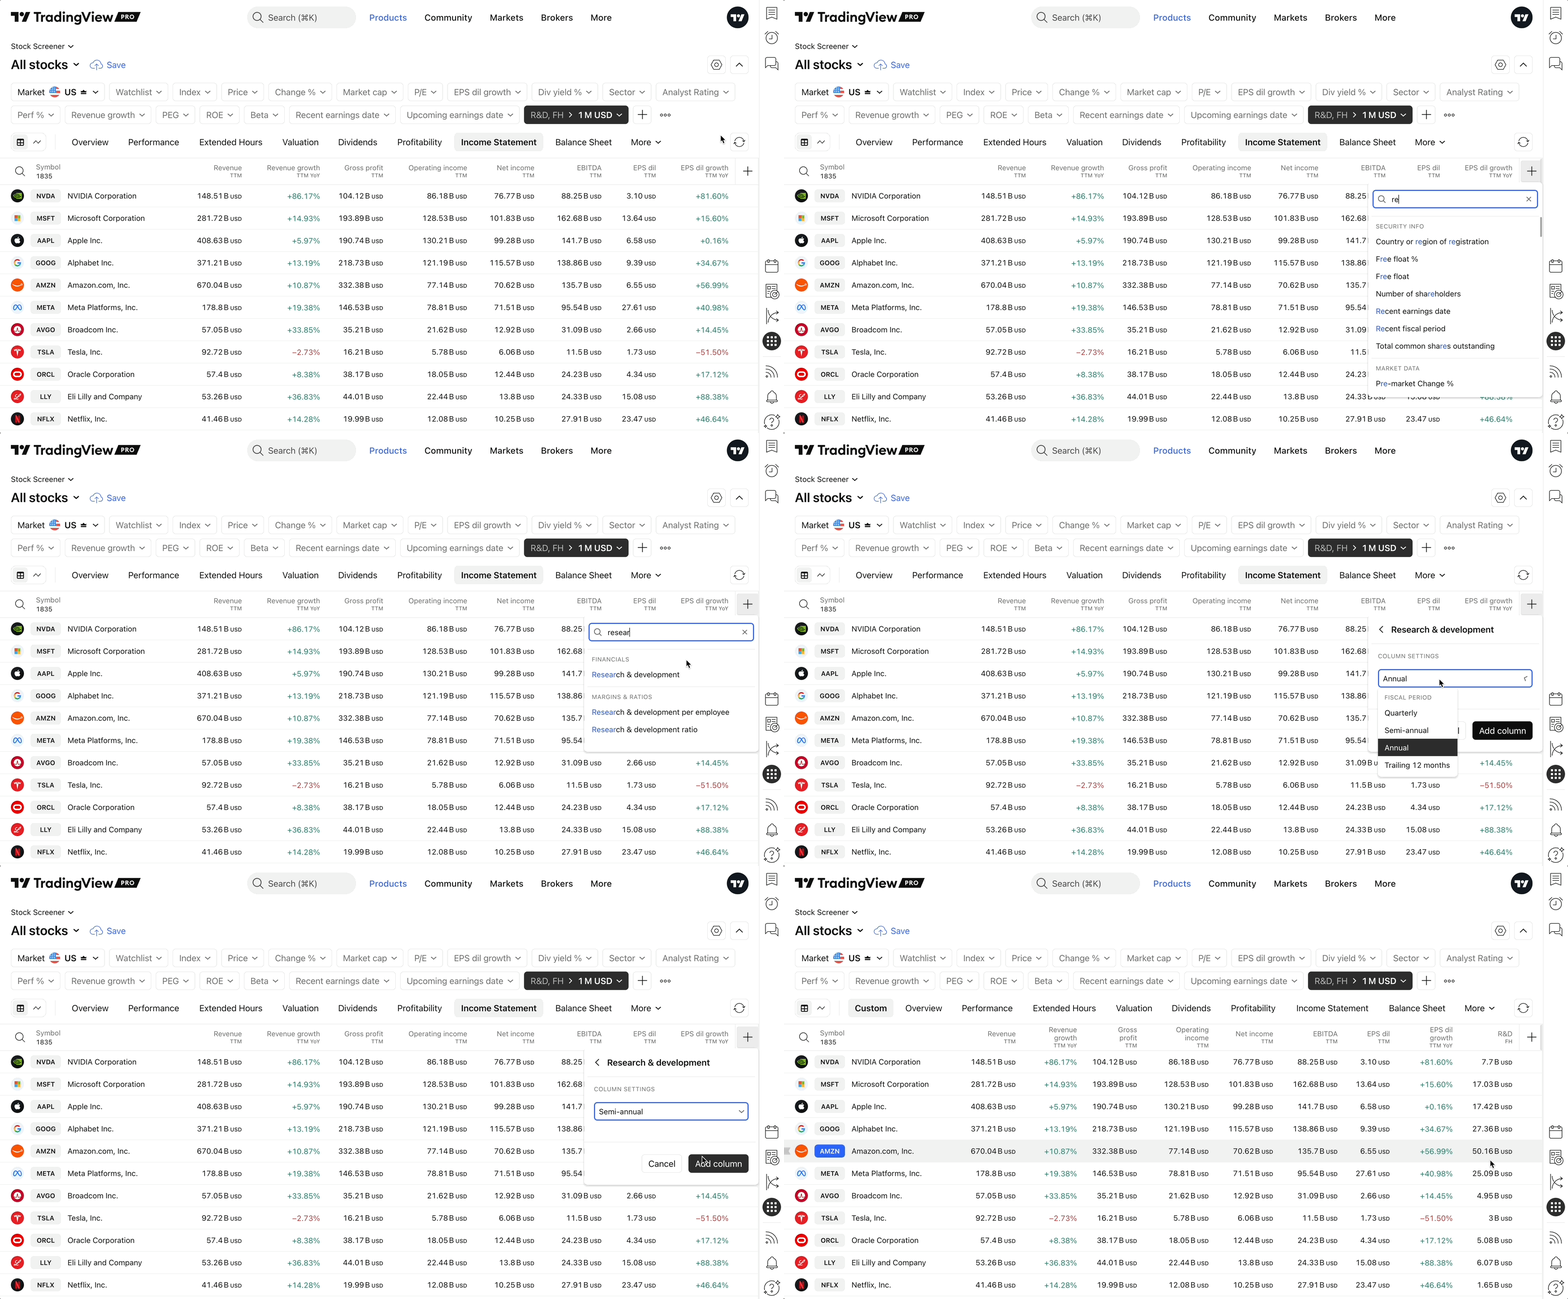
You can also add columns with the desired metrics by clicking the plus sign in the table header or using the Shift + C shortcut on Windows and Mac devices. Simply set the required reporting period, and sort the list as needed.

To make your analysis even more efficient, we’ve also added a new column set — it already contains all the important per share metrics, so you don’t have to set your screener manually.

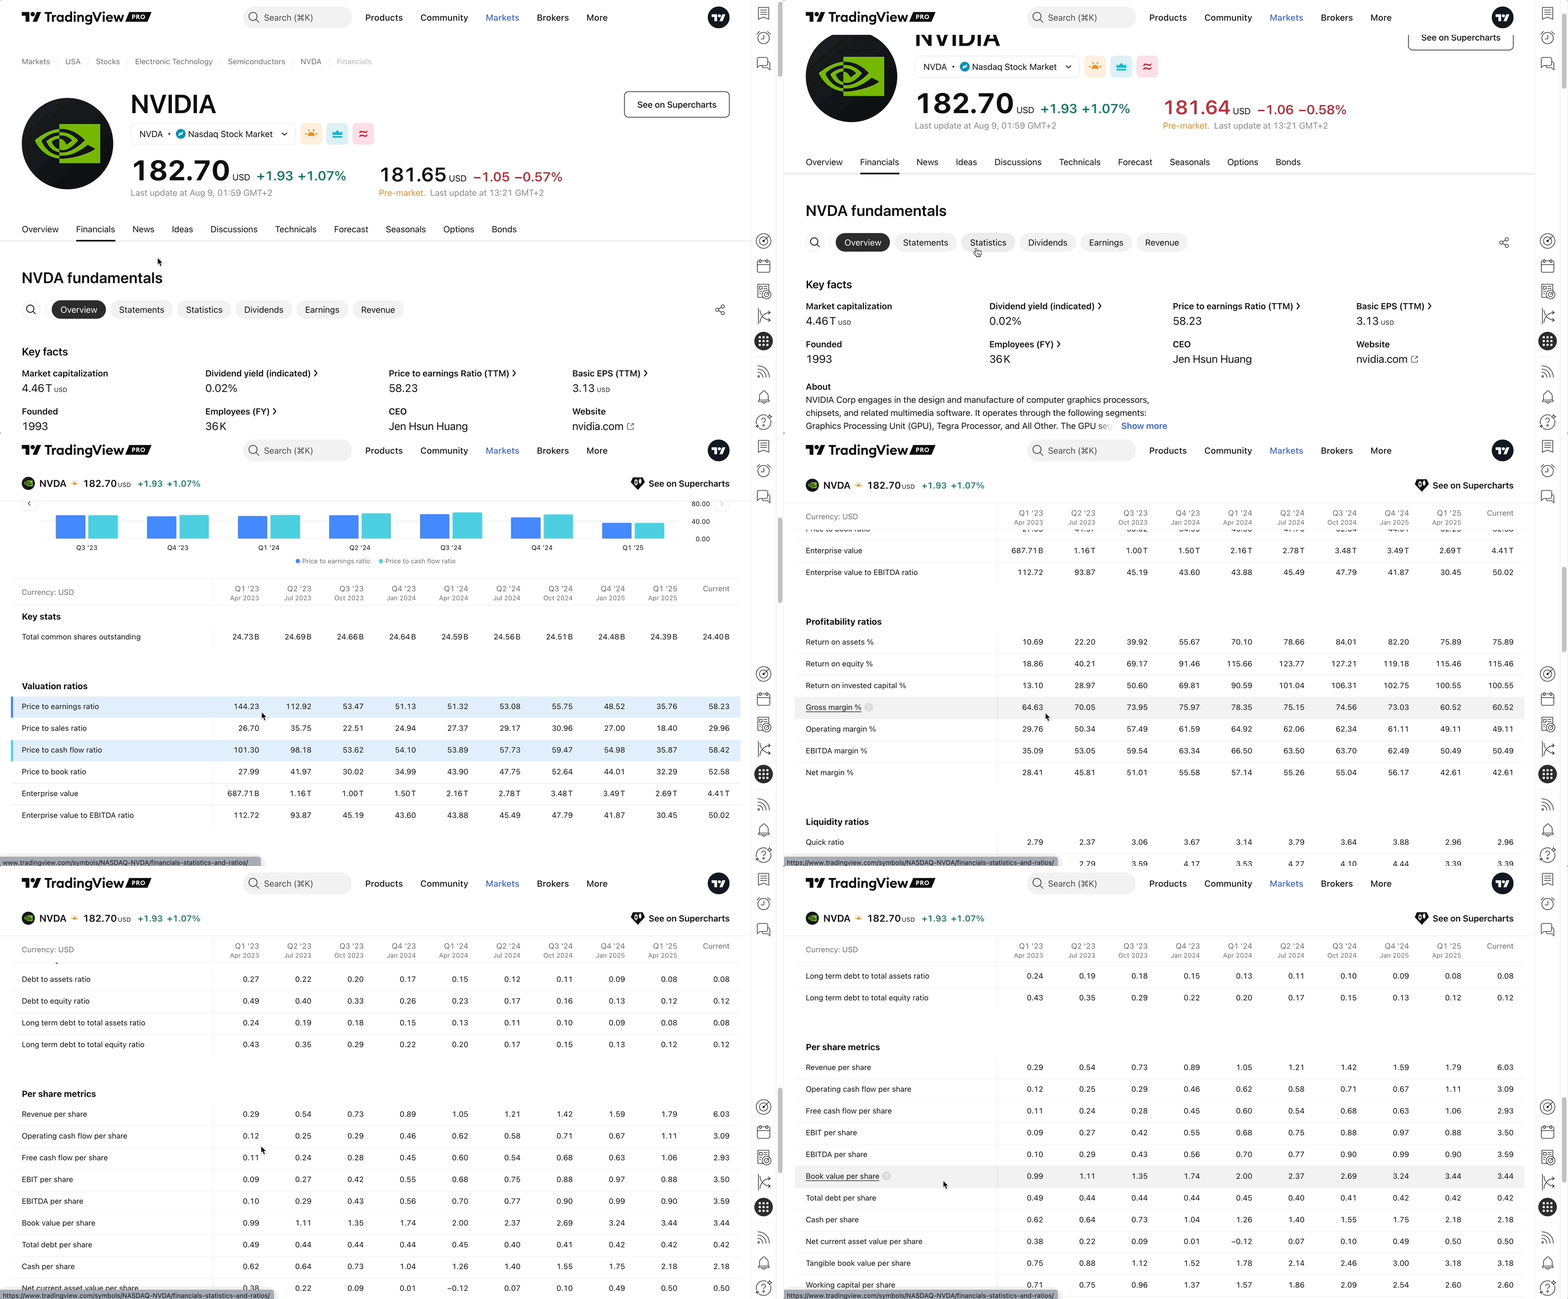
Per share metrics are also accessible on stock symbol pages. Simply navigate to the Financials tab, select Statistics, and scroll down to the Per share metrics section.

We hope this addition to our data will make your workflow smoother and your stock market analysis even more comprehensive. Compare companies with more precision to make more informed decisions and be among the first to spot promising trends.
Let us know what you think – your feedback fuels the enhancement of our platform.
Team TradingView
