Options trading is all about preparing for the unexpected. Our Strategy Builder now lets you model custom what-if scenarios — so you can see how your strategy behaves under different market conditions before they actually happen.
What-if scenarios were implemented in the first version of the Strategy Builder, but there were only a few static scenarios that users couldn’t change. Starting from recent updates, the strategy builder allows you to create custom what-if scenarios and put them on the options chart, in addition to default lines.
What is a “what-if scenario”
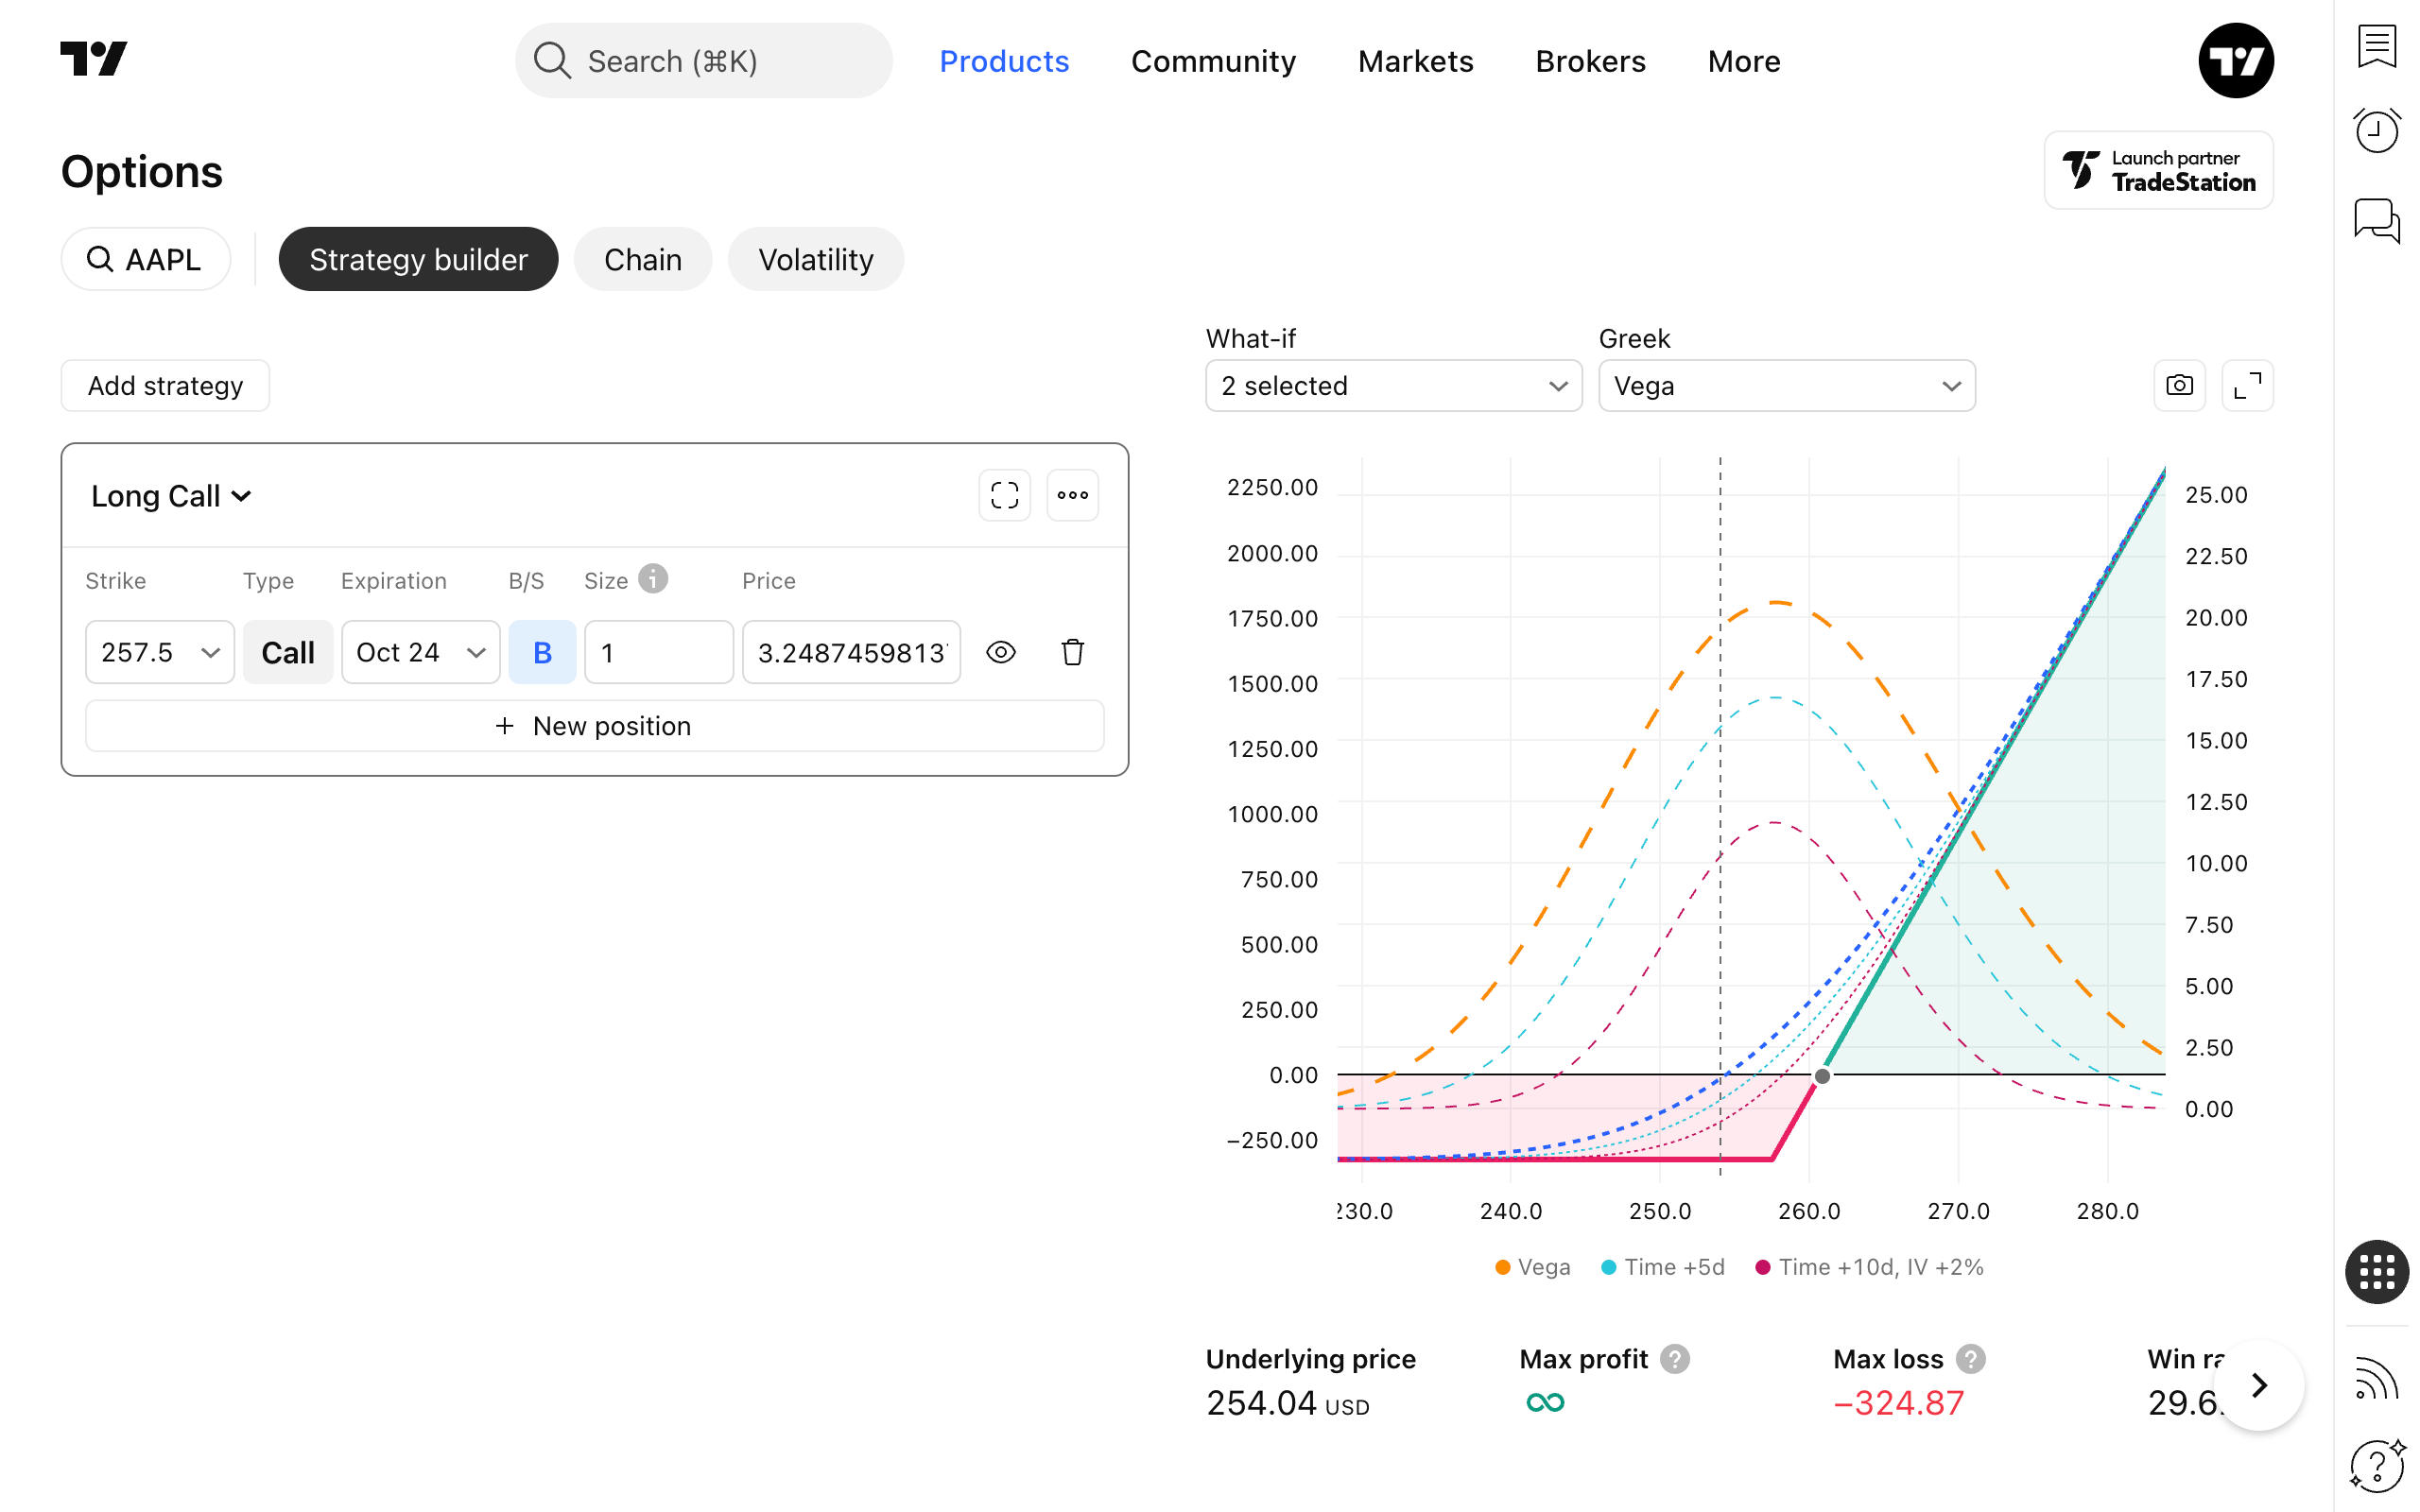
The strategy chart by default shows the payoff line (green+red on the screenshot), T+0 P&L line (blue line), and a selected Greek line (orange line). All these lines are calculated based on the current market conditions, including the current point in time and the current values of implied volatility.

The what-if scenario feature lets us calculate charts with modified market conditions. We could either choose a different moment in time (tomorrow or a week later, etc.) or an implied volatility level change or both of them.
Predefined scenarios
What-if scenarios’ controls are located above the chart. By default, the drop-down contains three predefined what-if scenarios: Time +5 days, IV +10% and IV -10%.
If you click a checkbox left to any of them, the corresponding line will be shown on the chart.

Custom scenarios
But the aim of predefined scenarios is to highlight the opportunity for users. The real power of what-if scenarios is the ability to create your own custom scenarios, store them, and apply them whenever needed. To create a custom scenario, click Add what-if… menu item in drop-down list.
In the opened Add what-if dialog, you can set up parameters of a custom scenario:
- Time shift. In days. It could be either positive (+1 is tomorrow, +2 is the day after tomorrow, etc) or negative (-1 is yesterday, etc.)
- IV shift. In percent. It could also be either positive or negative.
- Line style. Dot, dash, or solid line. Color will be picked automatically depending on how many scenarios you have selected to be added to a chart.
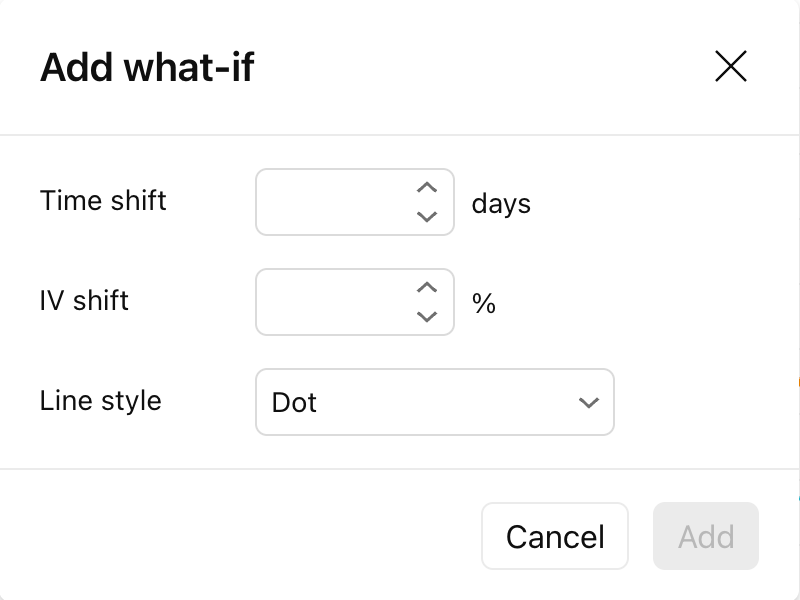
As soon as you click Add and close the dialog, a new scenario is created and added to the chart. The display name of a scenario will be created automatically, based on parameters.
Viewing multiple scenarios
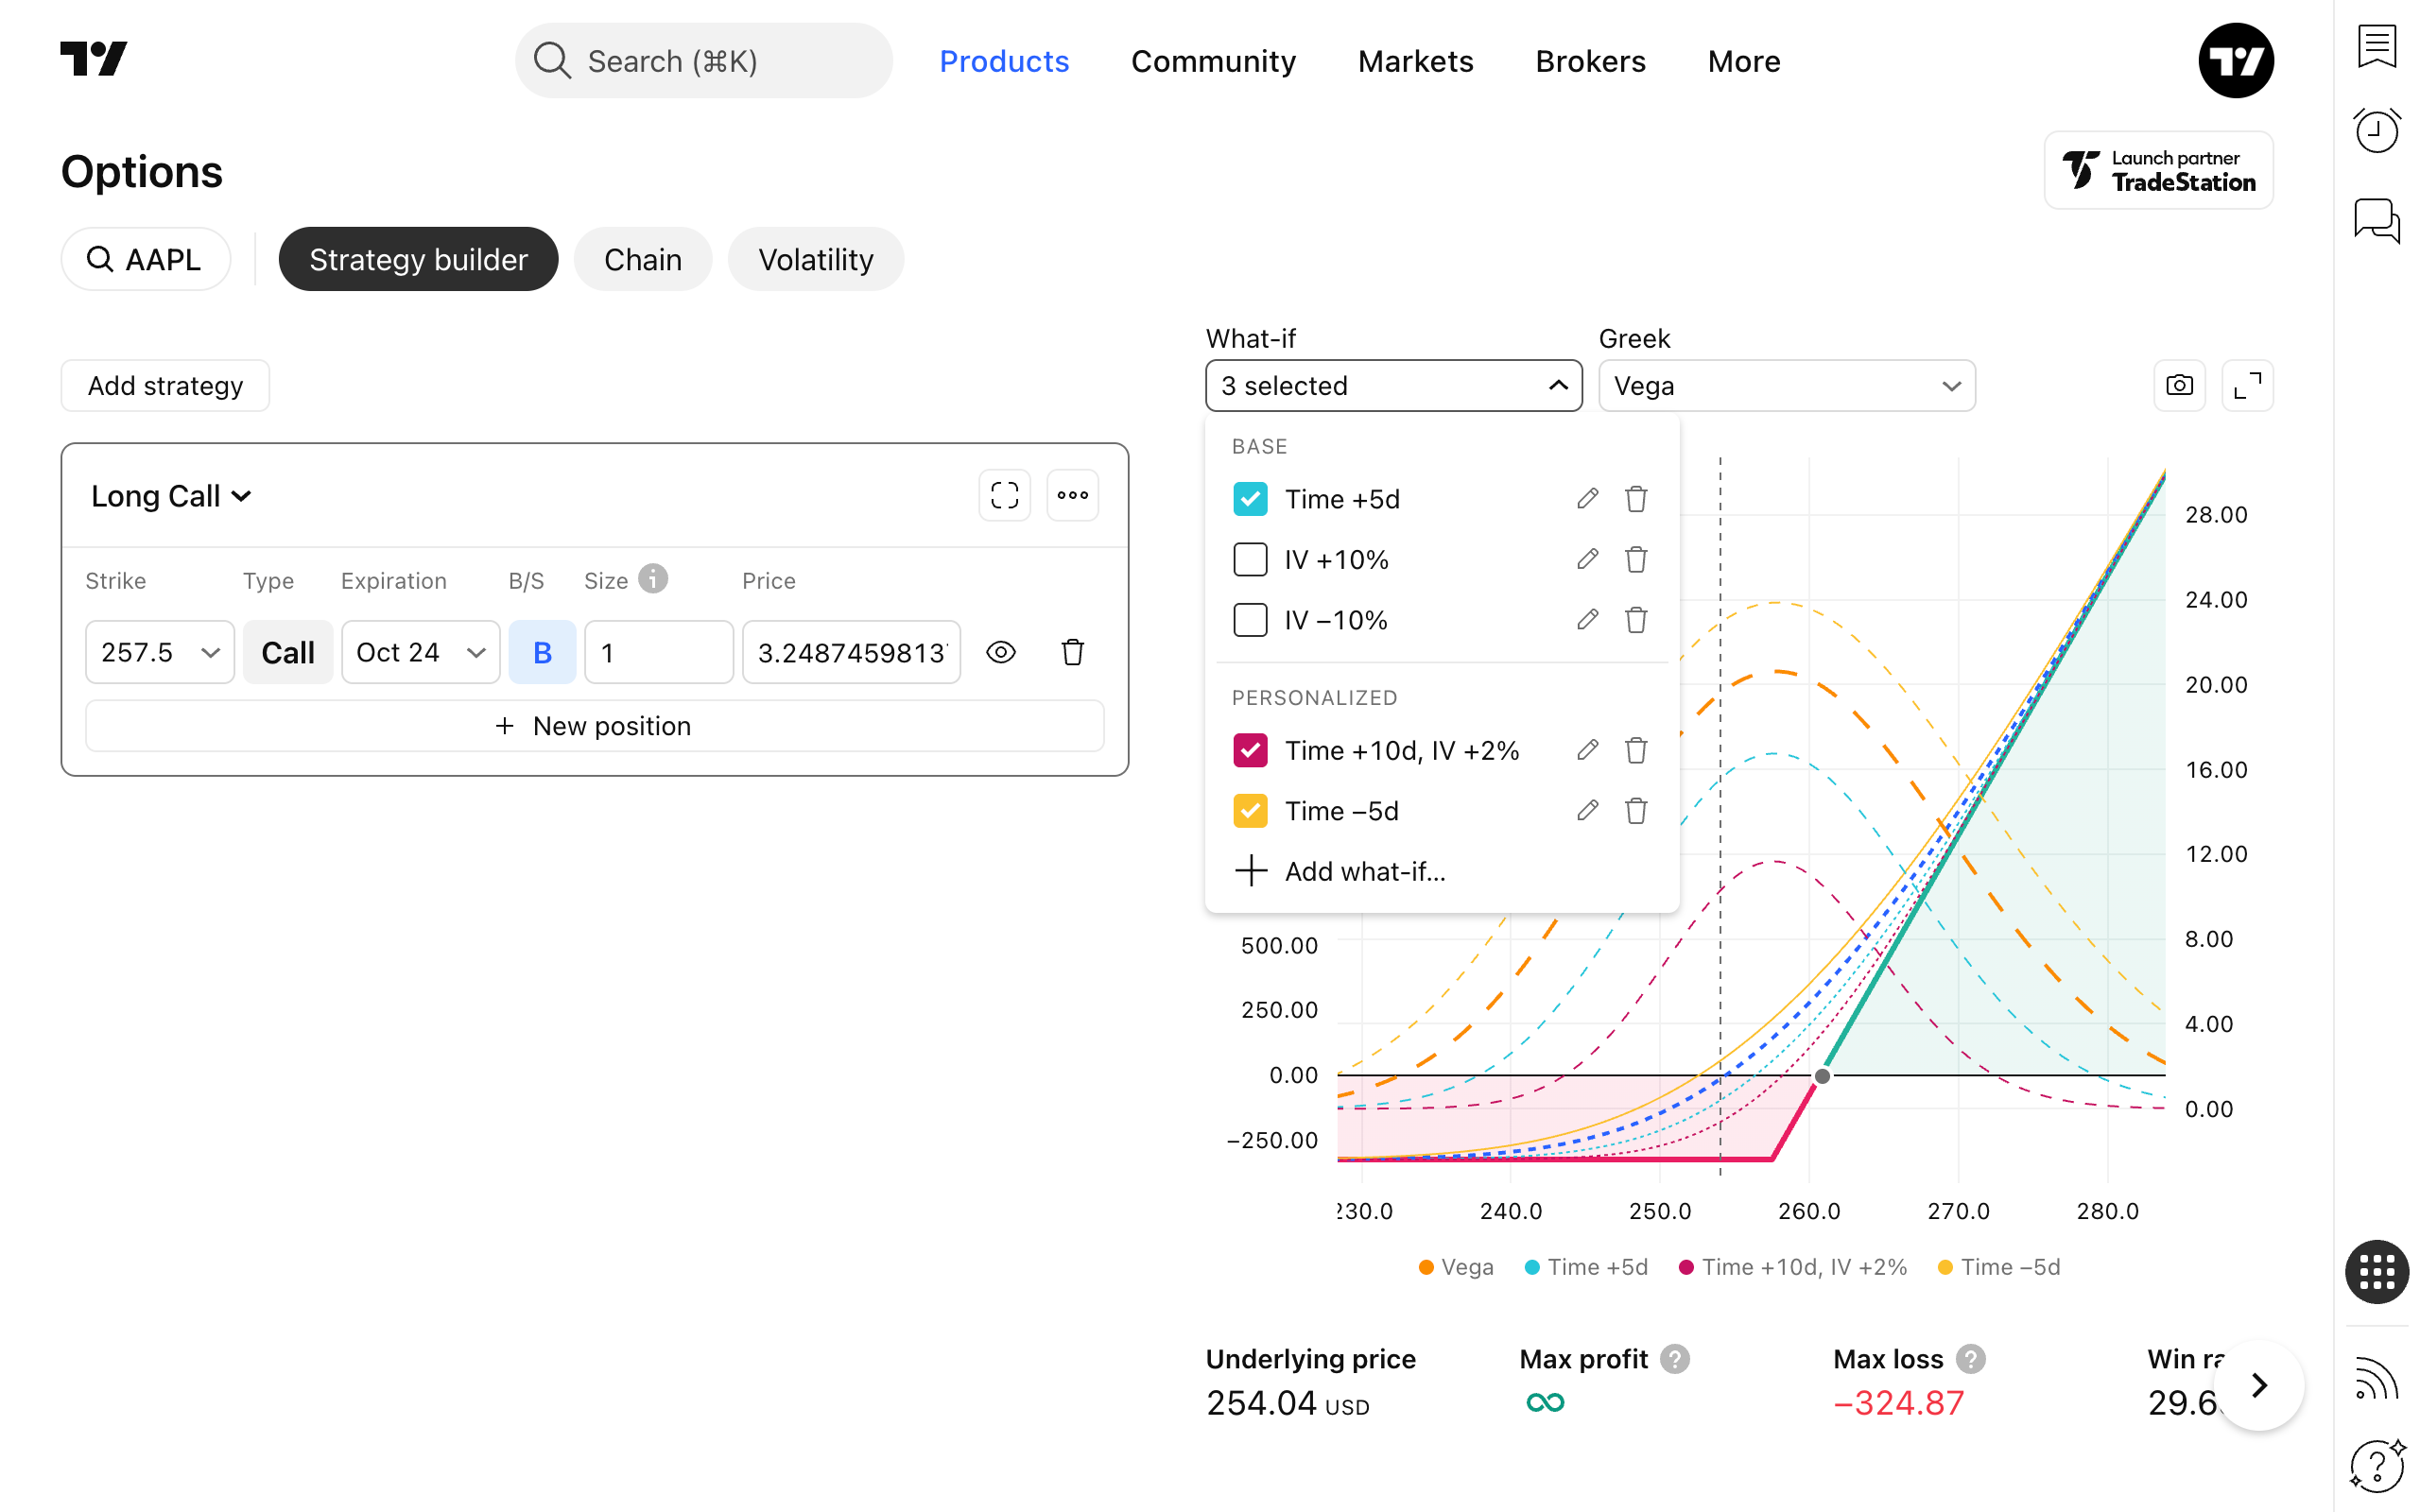
Suppose one holds a long OTM (nearly ATM) call position in AAPL with about 3 months till expiration. A bad scenario for this position is when the price doesn’t go up and the call option expires out of the money.
But that’s not the only risk. Even if the stock trades sideways near the strike, the option may still lose value because of time decay (theta) or a drop in implied volatility (IV). Both effects eat away at the premium, leaving the trader with losses even if the price didn’t move against them.
This is where multiple what-if scenarios come into play. You can plot not only a “no price change” scenario, but also add lines for “time passes by one month” and “IV falls by 10%” to see how those factors interact. By layering several scenarios on the same chart, you get a much clearer picture of what really threatens your position and how resilient it is under different market conditions.
To put multiple scenarios on a chart, just select them in the dropdown list.
With custom what-if scenarios, you’re no longer trading blind. You can anticipate how time and volatility changes affect your positions and adjust with confidence.
We hope this update will make your strategy-building more comfortable. Let us know what you think — your feedback helps us make the platform better.
Team TradingView