Apple Inc. (AAPL) Stock Developing Bearish Structure in 4-Hour Chart - Key Levels to Watch
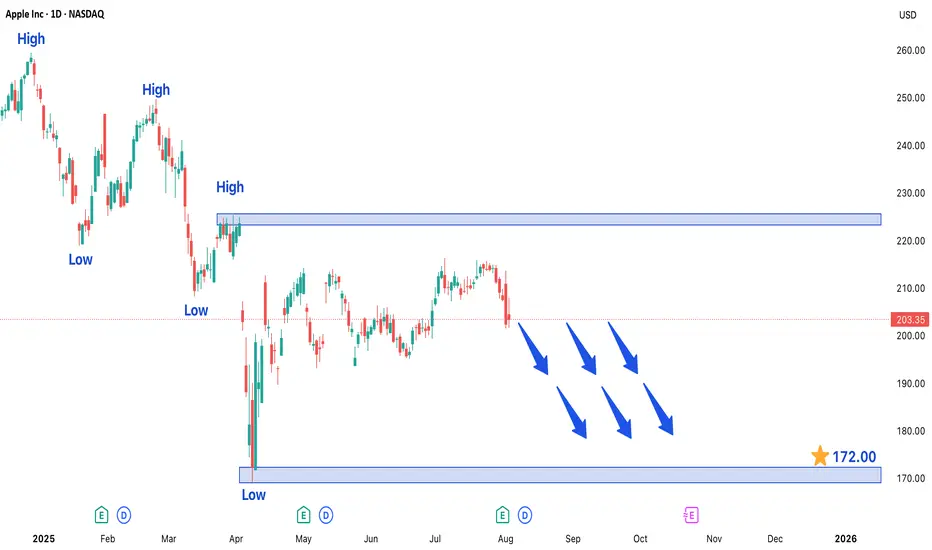
Technical analysis of Apple Inc.'s (AAPL) 4-hour chart reveals a concerning bearish trend formation that traders should monitor closely. The recent price action has shown strong selling pressure, confirmed by multiple large bearish candlesticks that indicate aggressive seller participation. This pattern suggests the stock is likely to maintain its downward trajectory in the near term unless significant buying pressure emerges.
Critical Price Levels and Market Structure
The current technical setup presents two crucial reference points for traders:
1. Downside Target at 172.00 - This level represents the next major support zone where we might see either:
- A potential pause in the downtrend
- Acceleration of selling if broken decisively
2. Upper Resistance at 226.00 - This price level now serves as a key ceiling for any bullish recovery attempts. A sustained move above this resistance would be required to invalidate the current bearish outlook.
Trading Dynamics and Key Observations
- The formation of consecutive lower highs and lower lows confirms the bearish structure
- Volume analysis shows increasing activity during down moves, supporting the bearish case
- Momentum indicators (RSI, MACD) are favoring sellers in the current market environment
Strategic Considerations for Traders
For those considering short positions:
- Ideal entry points would be on pullbacks toward recent resistance levels
- Conservative traders may wait for confirmation of rejection at 226.00 before entering
- Protective stops should be placed above key resistance levels
For potential buyers:
- Caution is advised until clear reversal signals appear
- The 172.00 level may offer a potential bounce opportunity if supported by volume
Risk Management Notes
Traders should remain vigilant for:
- Unexpected fundamental developments (earnings reports, product announcements)
- Sudden shifts in broader market sentiment
- Potential support at psychological levels (175.00, 170.00 round numbers)
The current technical picture suggests maintaining a bearish bias unless price action shows convincing signs of reversal, particularly through a sustained break above the 226.00 resistance level. As always, proper position sizing and risk management remain crucial in navigating this potentially volatile setup.
Disclaimer
The information and publications are not meant to be, and do not constitute, financial, investment, trading, or other types of advice or recommendations supplied or endorsed by TradingView. Read more in the Terms of Use.
Disclaimer
The information and publications are not meant to be, and do not constitute, financial, investment, trading, or other types of advice or recommendations supplied or endorsed by TradingView. Read more in the Terms of Use.