1. The "Breathing" Cloud (Changing Thickness)
The changing thickness of the White Cloud is the most important visual cue. Think of it as the "Lungs" of the Trend.
Expansion (Thickening Cloud):
What it means: The "Fast Core" (Cyan) is pulling away from the "Slow Core" (Magenta).
Analysis: This indicates Momentum Acceleration. The market is moving faster than its baseline. This is a "High Confidence" phase where you want to be aggressively holding or adding to positions.
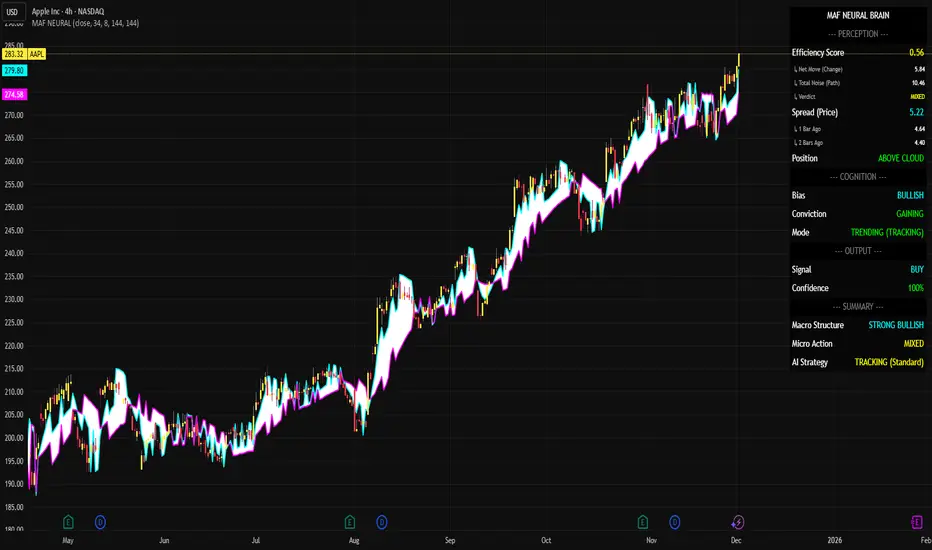
On Chart: You can see massive expansions during the rallies (May, June, Oct). The cloud gets huge, signaling a "Power Trend".
Contraction (Thinning Cloud):
What it means: The cores are converging (pinching together).
Analysis: This indicates Momentum Deceleration or Consolidation. The market is "exhaling" or taking a rest.
On Chart: Notice how the cloud gets very thin before the trend either reverses or explodes again. A thin cloud is a "Decision Point".
2. Dashboard Analysis (The "Brain")
The Dashboard confirms what the Cloud is showing visually:
Spread (Price): 5.77: This is a Wide Spread.
Verdict: The trend is currently Expanded. It is not in a "compression" phase; it is in a "run" phase.
Efficiency Score: 0.56 (MIXED):
Verdict: While the trend is up, the price action isn't a straight line. It's a bit "choppy" or "grinding" (Mixed). It's not a "Clean Trend" (0.8+), but it's not "Noise" (<0.3) either.
AI Strategy: TRACKING (Standard):
Verdict: Because the trend is Strong (Wide Spread) but the action is Mixed, the AI decides the best course of action is simply to Track it. Don't get shaken out by the wiggles, but don't be too aggressive. Just trail your stop.
Summary
Current Status: STRONG BULLISH TREND. Action: HOLD. The Cloud is thick (High Momentum), and the Dashboard is signaling "Strong Bullish". Even though the Efficiency is "Mixed" (some minor chop), the sheer width of the cloud protects you from getting stopped out prematurely. Ride the expansion.
The changing thickness of the White Cloud is the most important visual cue. Think of it as the "Lungs" of the Trend.
Expansion (Thickening Cloud):
What it means: The "Fast Core" (Cyan) is pulling away from the "Slow Core" (Magenta).
Analysis: This indicates Momentum Acceleration. The market is moving faster than its baseline. This is a "High Confidence" phase where you want to be aggressively holding or adding to positions.
On Chart: You can see massive expansions during the rallies (May, June, Oct). The cloud gets huge, signaling a "Power Trend".
Contraction (Thinning Cloud):
What it means: The cores are converging (pinching together).
Analysis: This indicates Momentum Deceleration or Consolidation. The market is "exhaling" or taking a rest.
On Chart: Notice how the cloud gets very thin before the trend either reverses or explodes again. A thin cloud is a "Decision Point".
2. Dashboard Analysis (The "Brain")
The Dashboard confirms what the Cloud is showing visually:
Spread (Price): 5.77: This is a Wide Spread.
Verdict: The trend is currently Expanded. It is not in a "compression" phase; it is in a "run" phase.
Efficiency Score: 0.56 (MIXED):
Verdict: While the trend is up, the price action isn't a straight line. It's a bit "choppy" or "grinding" (Mixed). It's not a "Clean Trend" (0.8+), but it's not "Noise" (<0.3) either.
AI Strategy: TRACKING (Standard):
Verdict: Because the trend is Strong (Wide Spread) but the action is Mixed, the AI decides the best course of action is simply to Track it. Don't get shaken out by the wiggles, but don't be too aggressive. Just trail your stop.
Summary
Current Status: STRONG BULLISH TREND. Action: HOLD. The Cloud is thick (High Momentum), and the Dashboard is signaling "Strong Bullish". Even though the Efficiency is "Mixed" (some minor chop), the sheer width of the cloud protects you from getting stopped out prematurely. Ride the expansion.
Disclaimer
The information and publications are not meant to be, and do not constitute, financial, investment, trading, or other types of advice or recommendations supplied or endorsed by TradingView. Read more in the Terms of Use.
Disclaimer
The information and publications are not meant to be, and do not constitute, financial, investment, trading, or other types of advice or recommendations supplied or endorsed by TradingView. Read more in the Terms of Use.