---
⚠️ Disclaimer:
This analysis reflects personal market observation and is not a buy or sell signal.
Always analyze the chart carefully and use proper risk management before entering any trade.
📢 Signal Alert
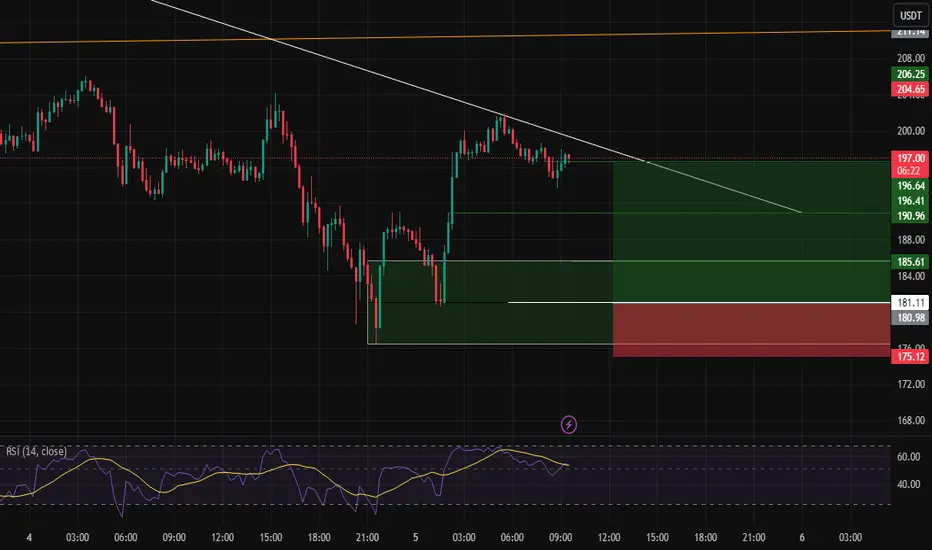
🔹 Pair: AAVE / USDT
📈 Trade Type: Long
💰 Entry Price: 181.11
🎯 Take-Profit Targets:
TP1 = 185.61
TP2 = 191.00
TP3 = 196.70
🛑 Stop-Loss: 177.20
📊 Timeframe: 1H
⚖️ Risk/Reward Ratio: 2.63
📌 Suggested Leverage: 5x–10x
🔄 After reaching TP1, move Stop-Loss to Entry to secure profits.
---
🧠 Technical Analysis Summary:
AAVE is showing bullish continuation after reclaiming the key support zone around $180, which previously acted as resistance.
The price is currently holding above the EMA50 and forming higher lows, indicating renewed buying momentum.
A breakout above $182–$183 could trigger acceleration toward the next resistances near $185.6 and $191.0.
RSI is trending above 50 and showing increasing strength, confirming momentum alignment with bulls.
The stop-loss at $177.20 sits below the recent swing low, allowing for healthy retracement while maintaining a solid R/R ratio.
⚙️ Trade Management Tip:
Wait for a bullish 1H candle close above $181 for confirmation before entry.
Take partial profits at TP1 and trail your stop to lock in gains as the price approaches higher targets.
---
⚠️ Disclaimer:
This analysis reflects personal market observation and is not a buy or sell signal.
Always analyze the chart carefully and use proper risk management before entering any trade.
📢 Signal Alert
🔹 Pair: AAVE / USDT
📈 Trade Type: Long
💰 Entry Price: 181.11
🎯 Take-Profit Targets:
TP1 = 185.61
TP2 = 191.00
TP3 = 196.70
🛑 Stop-Loss: 177.20
📊 Timeframe: 1H
⚖️ Risk/Reward Ratio: 2.63
📌 Suggested Leverage: 5x–10x
🔄 After reaching TP1, move Stop-Loss to Entry to secure profits.
---
🧠 Technical Analysis Summary:
AAVE is showing bullish continuation after reclaiming the key support zone around $180, which previously acted as resistance.
The price is currently holding above the EMA50 and forming higher lows, indicating renewed buying momentum.
A breakout above $182–$183 could trigger acceleration toward the next resistances near $185.6 and $191.0.
RSI is trending above 50 and showing increasing strength, confirming momentum alignment with bulls.
The stop-loss at $177.20 sits below the recent swing low, allowing for healthy retracement while maintaining a solid R/R ratio.
⚙️ Trade Management Tip:
Wait for a bullish 1H candle close above $181 for confirmation before entry.
Take partial profits at TP1 and trail your stop to lock in gains as the price approaches higher targets.
---
Disclaimer
The information and publications are not meant to be, and do not constitute, financial, investment, trading, or other types of advice or recommendations supplied or endorsed by TradingView. Read more in the Terms of Use.
Disclaimer
The information and publications are not meant to be, and do not constitute, financial, investment, trading, or other types of advice or recommendations supplied or endorsed by TradingView. Read more in the Terms of Use.