ABOT Weekly Technical Outlook – Long-Term Bullish Setup in Play
ABOT has presented a compelling long-term bullish setup following a strong recovery and consolidation phase. Here's a technical breakdown:
🔍 Chart Overview (1W TF):
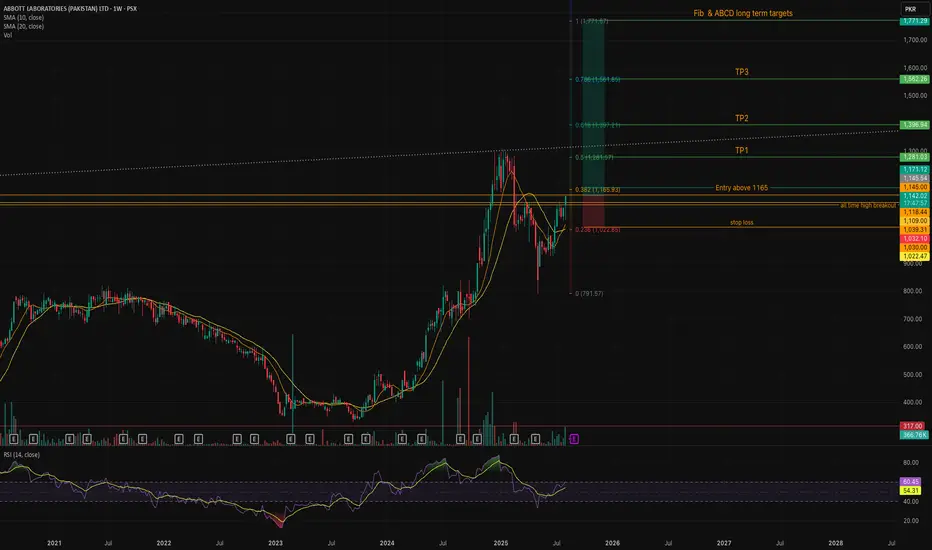
Entry Trigger: Confirmed breakout above PKR 1165, reclaiming the 0.382 Fibonacci level.
Stop Loss: Below key support zone near PKR 1022–1039, aligned with SMA 10 & 20.
Breakout Zone: ABOT is now retesting its previous all-time high zone between PKR 1145–1172, setting up for a potential continuation.
📐 Fibonacci & ABCD Projections – Long-Term Targets:
📌 TP1 (Fib 0.5): PKR 1281
📌 TP2 (Fib 0.618): PKR 1396
📌 TP3 (Fib 0.786): PKR 1562
🎯 Extended Target (Fib 1.0): PKR 1771
These levels align with a classic AB=CD harmonic projection, signaling potential for sustained upside over the coming months.
📈 Indicators Insight:
✅ SMA 10/20 crossover bullish; price now trades well above both.
✅ RSI (14) currently at 60.45, showing healthy momentum but still below overbought levels – room to run.
📊 Volume spikes on breakout candles confirm buyer interest.
💡 Strategy Summary:
📥 Buy Zone: Above PKR 1165
🛑 Stop Loss: Below PKR 1022
🎯 Targets: PKR 1281, 1396, 1562, and 1771
This is a textbook trend continuation setup following correction and consolidation. Keep a close watch on volume follow-through and strength above the breakout zone to confirm trend expansion.
🔍 Chart Overview (1W TF):
Entry Trigger: Confirmed breakout above PKR 1165, reclaiming the 0.382 Fibonacci level.
Stop Loss: Below key support zone near PKR 1022–1039, aligned with SMA 10 & 20.
Breakout Zone: ABOT is now retesting its previous all-time high zone between PKR 1145–1172, setting up for a potential continuation.
📐 Fibonacci & ABCD Projections – Long-Term Targets:
📌 TP1 (Fib 0.5): PKR 1281
📌 TP2 (Fib 0.618): PKR 1396
📌 TP3 (Fib 0.786): PKR 1562
🎯 Extended Target (Fib 1.0): PKR 1771
These levels align with a classic AB=CD harmonic projection, signaling potential for sustained upside over the coming months.
📈 Indicators Insight:
✅ SMA 10/20 crossover bullish; price now trades well above both.
✅ RSI (14) currently at 60.45, showing healthy momentum but still below overbought levels – room to run.
📊 Volume spikes on breakout candles confirm buyer interest.
💡 Strategy Summary:
📥 Buy Zone: Above PKR 1165
🛑 Stop Loss: Below PKR 1022
🎯 Targets: PKR 1281, 1396, 1562, and 1771
This is a textbook trend continuation setup following correction and consolidation. Keep a close watch on volume follow-through and strength above the breakout zone to confirm trend expansion.
Disclaimer
The information and publications are not meant to be, and do not constitute, financial, investment, trading, or other types of advice or recommendations supplied or endorsed by TradingView. Read more in the Terms of Use.
Disclaimer
The information and publications are not meant to be, and do not constitute, financial, investment, trading, or other types of advice or recommendations supplied or endorsed by TradingView. Read more in the Terms of Use.