ACAMD to target 1.12 then 1.40 after crossing Resistance
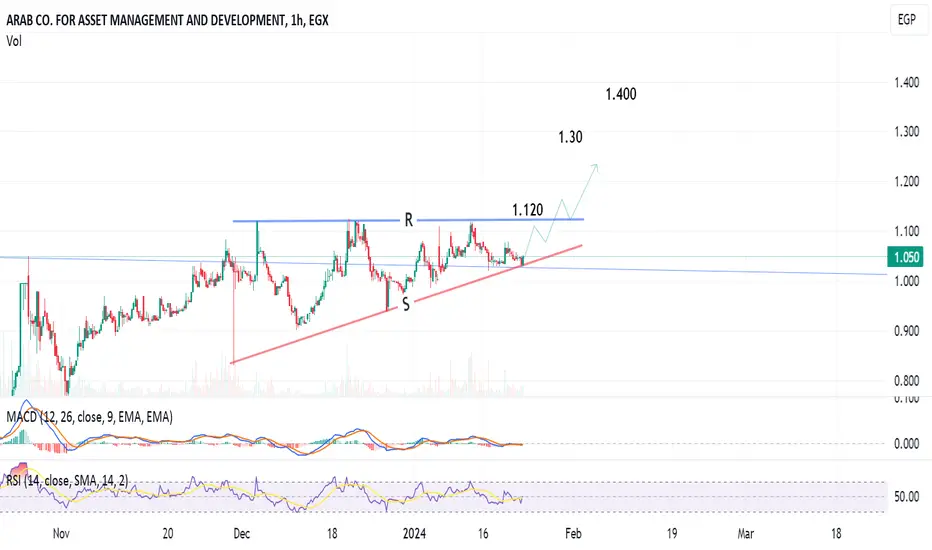
1-hour chart, the stock is trading in a rising triangle pattern, going to hit the Resistance line (blue) at around 1.118 - 1.120.
After crossing up, the target will be 1.30 then 1.40
Stop loss below the support line.
After crossing up, the target will be 1.30 then 1.40
Stop loss below the support line.
Related publications
Disclaimer
The information and publications are not meant to be, and do not constitute, financial, investment, trading, or other types of advice or recommendations supplied or endorsed by TradingView. Read more in the Terms of Use.
Related publications
Disclaimer
The information and publications are not meant to be, and do not constitute, financial, investment, trading, or other types of advice or recommendations supplied or endorsed by TradingView. Read more in the Terms of Use.