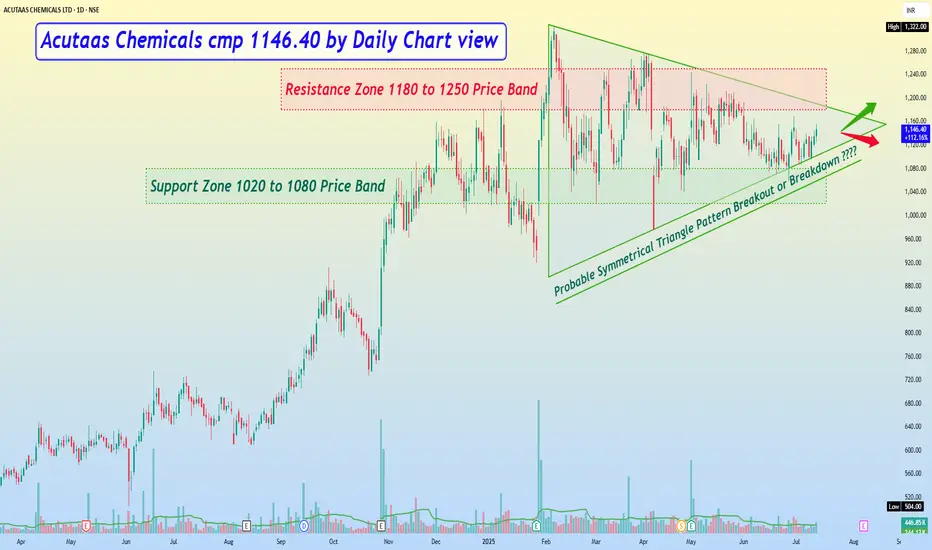
Acutaas Chemicals cmp 1146.40 by Daily Chart view
- Support Zone 1020 to 1080 Price Band
- Resistance Zone 1180 to 1250 Price Band
- Technical Indicators BB, EMA, MACD, RSI trending bit positively
- Probable Symmetrical Triangle Pattern Breakout or Breakdown ????
- Volumes seem to be going in close sync with the average traded quantity
- Support Zone 1020 to 1080 Price Band
- Resistance Zone 1180 to 1250 Price Band
- Technical Indicators BB, EMA, MACD, RSI trending bit positively
- Probable Symmetrical Triangle Pattern Breakout or Breakdown ????
- Volumes seem to be going in close sync with the average traded quantity
Disclaimer
The information and publications are not meant to be, and do not constitute, financial, investment, trading, or other types of advice or recommendations supplied or endorsed by TradingView. Read more in the Terms of Use.
Disclaimer
The information and publications are not meant to be, and do not constitute, financial, investment, trading, or other types of advice or recommendations supplied or endorsed by TradingView. Read more in the Terms of Use.