ADA vs BTC from last cycle:
Current Cycle:
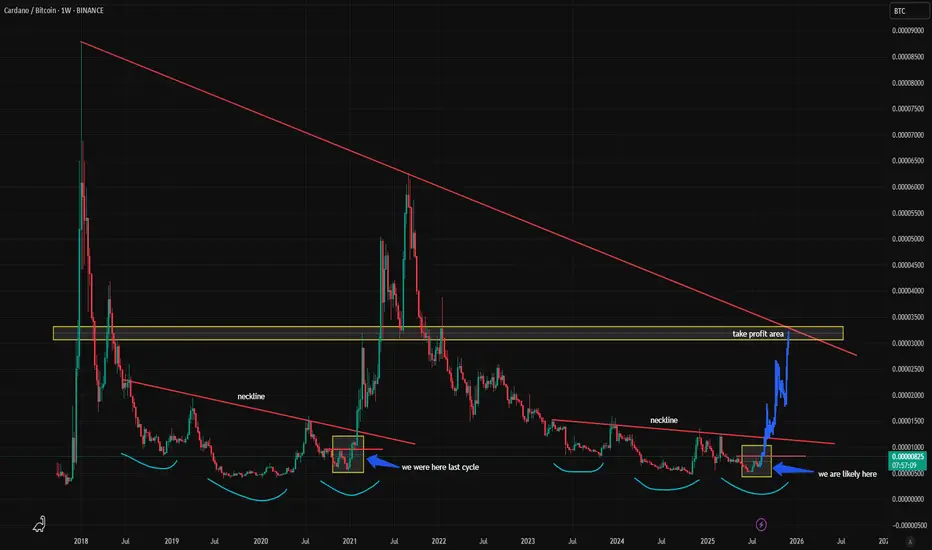
We could see a pullback in September back to the bottom of the yellow box, making a swing failure pattern (September of post halving years have always been red), but if resistance breaks than it could signal the start of a huge breakout.
- Inverse Head and Shoulders Pattern
- Break of Local Resistance (red horizontal line)
- Break of Neckline was the start of the bullrun for ADA/BTC
Current Cycle:
- Possible Inverse Head and Shoulders Pattern
- Awaiting Break of Local Resistance (red horizontal line)
- Awaiting Break of Neckline to start the bullrun for ADA/BTC
We could see a pullback in September back to the bottom of the yellow box, making a swing failure pattern (September of post halving years have always been red), but if resistance breaks than it could signal the start of a huge breakout.
Disclaimer
The information and publications are not meant to be, and do not constitute, financial, investment, trading, or other types of advice or recommendations supplied or endorsed by TradingView. Read more in the Terms of Use.
Disclaimer
The information and publications are not meant to be, and do not constitute, financial, investment, trading, or other types of advice or recommendations supplied or endorsed by TradingView. Read more in the Terms of Use.