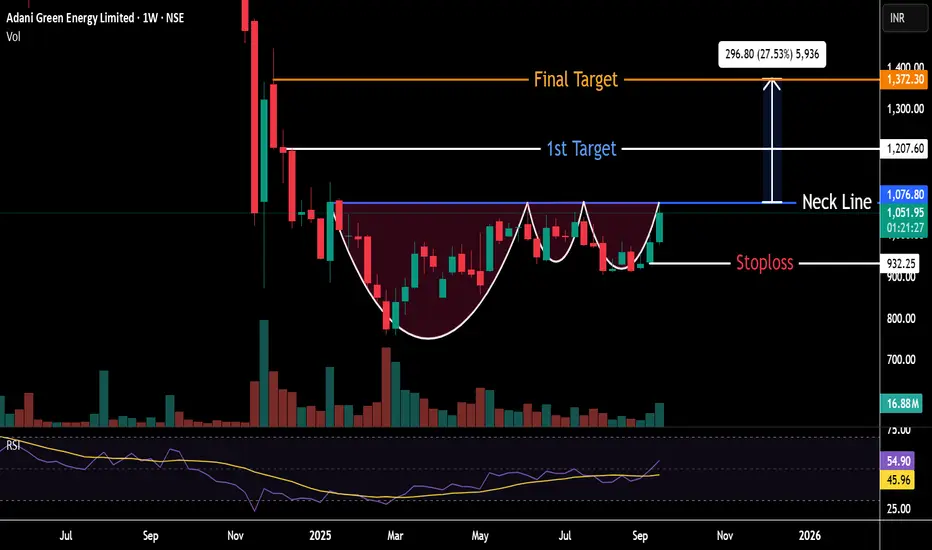
Adani Green formed Complex Cup & Handle Pattern on Daily & Weekly Chart . Currently Stock trading above 20,50 & 100 EMA & Try to close above 200 EMA (which is near about 1065 Level), Near about the same level (1076) is the Neckline area ,Where stock face resistance multiple times .RSI also indicating positive momentum in stock .If Breakout happened possible Target will be arround 1370 Rs with a stoploss of 930 Rs.
It"s not a buy or sell call ...For education only
It"s not a buy or sell call ...For education only
Disclaimer
The information and publications are not meant to be, and do not constitute, financial, investment, trading, or other types of advice or recommendations supplied or endorsed by TradingView. Read more in the Terms of Use.
Disclaimer
The information and publications are not meant to be, and do not constitute, financial, investment, trading, or other types of advice or recommendations supplied or endorsed by TradingView. Read more in the Terms of Use.